概述
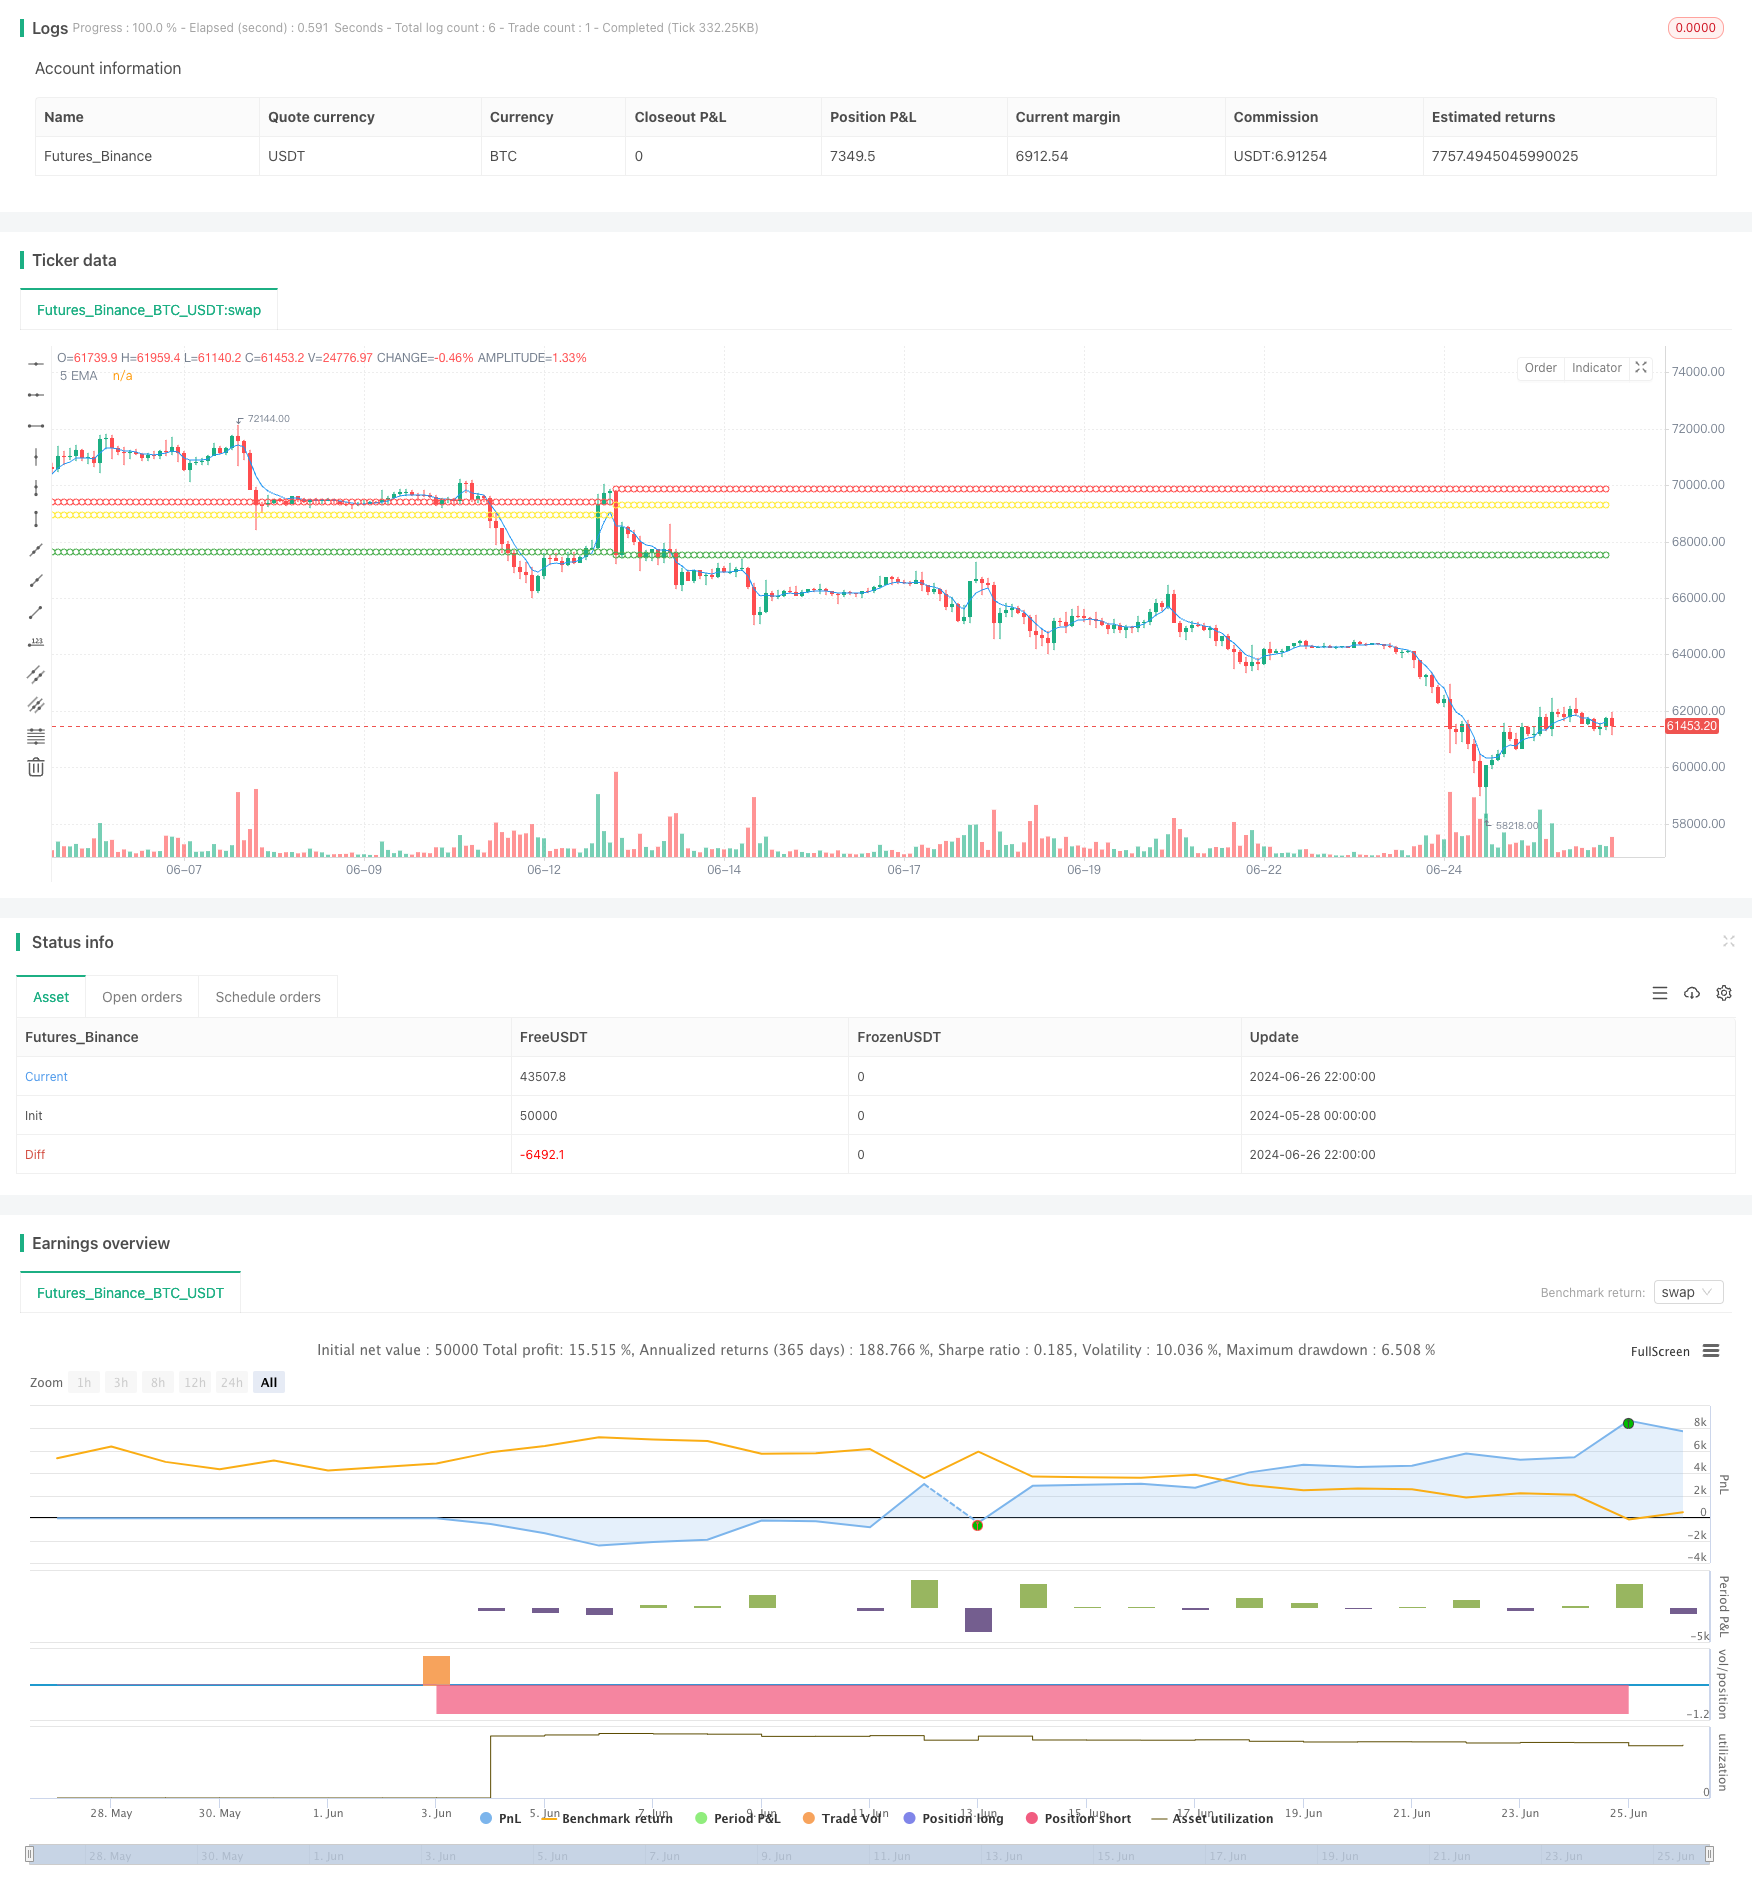
本文介绍了一种基于5周期指数移动平均线(5EMA)的趋势跟踪策略。该策略主要用于识别短期趋势反转机会,并通过设置动态止盈止损来管理风险。策略的核心思想是在价格突破5EMA时入场做空,并根据入场点设置相应的止损和获利目标。这种方法旨在捕捉市场的短期下跌趋势,同时通过严格的风险管理来保护交易资本。
策略原理
指标设置:策略使用5周期的指数移动平均线(5EMA)作为主要技术指标。
入场信号:
- 警戒蜡烛:当某根蜡烛的低点完全位于5EMA线之上时,被标记为警戒蜡烛。
- 入场条件:如果下一根蜡烛的低点低于或等于警戒蜡烛的低点,则触发做空入场信号。
交易执行:
- 入场价格:以警戒蜡烛的低点作为入场价格。
- 止损设置:将止损设置在警戒蜡烛的最高点。
- 获利目标:采用1:3的风险回报比,即获利目标设置为止损距离的3倍。
风险管理:
- 采用百分比风险模型,每次交易风险固定资金的一定比例。
- 使用动态止损和获利目标,根据每次交易的具体情况自动调整。
交易成本:考虑了0.1%的交易佣金,更贴近实际交易环境。
策略优势
趋势跟踪:通过5EMA指标有效捕捉短期趋势变化,提高入场时机的准确性。
风险控制:采用动态止损机制,根据市场波动自动调整止损位置,有效控制每笔交易的风险。
盈亏比优化:使用1:3的风险回报比,在控制风险的同时追求更高的收益潜力。
自动化执行:策略可以通过TradingView平台实现全自动化交易,减少人为干预和情绪影响。
适应性强:通过参数化设计,策略可以适应不同市场环境和交易品种。
成本考虑:纳入交易佣金计算,使回测结果更接近实际交易情况。
策略风险
假突破风险:在震荡市场中,可能会频繁触发假突破信号,导致连续亏损。
趋势反转风险:在强势上涨趋势中,频繁做空可能面临较大损失。
滑点风险:实际交易中的滑点可能导致入场价格偏离理想位置,影响策略表现。
过度交易:在高波动市场中可能产生过多交易信号,增加交易成本。
参数敏感性:策略表现可能对EMA周期和风险回报比等参数设置较为敏感。
策略优化方向
多周期确认:结合更长周期的趋势指标,如20EMA或50EMA,以减少假突破信号。
波动率过滤:引入ATR指标,在波动率过大时暂停交易,降低风险。
市场状态分类:开发市场状态识别模块,在不同市场环境下调整策略参数或暂停交易。
动态风险管理:根据账户盈亏情况动态调整每笔交易的风险敞口,实现更灵活的资金管理。
多品种应用:测试策略在不同交易品种上的表现,实现跨品种分散投资。
机器学习优化:利用机器学习算法动态优化EMA周期和风险回报比等参数。
结合基本面:整合重要经济数据发布等基本面因素,在特定时期调整策略行为。
总结
5EMA趋势跟踪动态止盈止损策略是一种简洁而有效的量化交易方法。它通过5EMA指标捕捉短期趋势反转机会,并使用动态止损和固定风险回报比来管理风险。策略的优势在于其简单性、自动化程度高和风险管理的有效性。然而,交易者需要注意假突破和趋势反转等潜在风险。
为了进一步提高策略的稳健性和盈利能力,可以考虑引入多周期确认、波动率过滤、市场状态分类等优化方向。同时,利用机器学习技术动态优化参数,以及在多个交易品种上进行测试和应用,都是值得探索的方向。
总的来说,这个策略为短期趋势交易提供了一个良好的起点,通过持续优化和风险管理,有潜力成为一个可靠的量化交易系统。然而,在实盘交易中应用之前,建议进行充分的回测和模拟交易,以确保策略在各种市场条件下的稳定性和可靠性。
/*backtest
start: 2024-05-28 00:00:00
end: 2024-06-27 00:00:00
period: 2h
basePeriod: 15m
exchanges: [{"eid":"Futures_Binance","currency":"BTC_USDT"}]
*/

//@version=5
strategy("5 EMA Short", overlay=true)

// Input
emaLength = input.int(5, "EMA Length", minval=1)
riskRewardRatio = input.float(3.0, "Risk-Reward Ratio", minval=1.0, step=0.1)

// Calculate 5 EMA
ema5 = ta.ema(close, emaLength)

// Identify alert candle
isAlertCandle = low > ema5 and low[1] > ema5[1]

// Entry condition
entryCondition = isAlertCandle[1] and low <= low[1]

// Calculate stop loss and take profit
stopLoss = high[1]
entryPrice = low[1]  // Entry price is the low of the alert candle
target = entryPrice - (stopLoss - entryPrice) * riskRewardRatio

// Variables to store trade information
var float tradeEntry = na
var float tradeSL = na
var float tradeTarget = na

// Execute strategy and store trade information
if (entryCondition)
    strategy.entry("Short", strategy.short, stop=stopLoss, limit=target)
    tradeEntry := entryPrice
    tradeSL := stopLoss
    tradeTarget := target

// Plot 5 EMA
plot(ema5, color=color.blue, linewidth=1, title="5 EMA")

// Plot entry, stop loss, and target only when a trade is triggered
plotshape(series=tradeEntry, title="Entry", location=location.absolute, color=color.yellow, style=shape.circle, size=size.tiny)
plotshape(series=tradeSL, title="Stop Loss", location=location.absolute, color=color.red, style=shape.circle, size=size.tiny)
plotshape(series=tradeTarget, title="Target", location=location.absolute, color=color.green, style=shape.circle, size=size.tiny)