概述
确认型均线交叉动量策略是一种结合了简单移动平均线(SMA)交叉和确认机制的量化交易策略。该策略利用短期和长期SMA的交叉来识别潜在的趋势变化,并通过额外的一个周期确认来提高信号的可靠性。策略还整合了止损和止盈机制,以管理风险和锁定利润。这种方法旨在捕捉市场趋势的转折点,同时减少虚假信号的影响。
策略原理
该策略的核心原理基于以下几个关键元素:
移动平均线交叉:策略使用两条SMA - 一条短期(10周期)和一条长期(30周期)。当短期SMA上穿长期SMA时,产生买入信号;当短期SMA下穿长期SMA时,产生卖出信号。
确认机制:为了减少虚假信号,策略要求交叉信号在下一个周期得到确认。具体来说,买入条件不仅要求前一周期的短期SMA上穿长期SMA,还要求当前周期的短期SMA仍然高于长期SMA。卖出信号同理。
风险管理:策略内置了止损和止盈机制。止损设置为1%,以限制潜在损失;止盈设置为10%,以锁定可观利润。
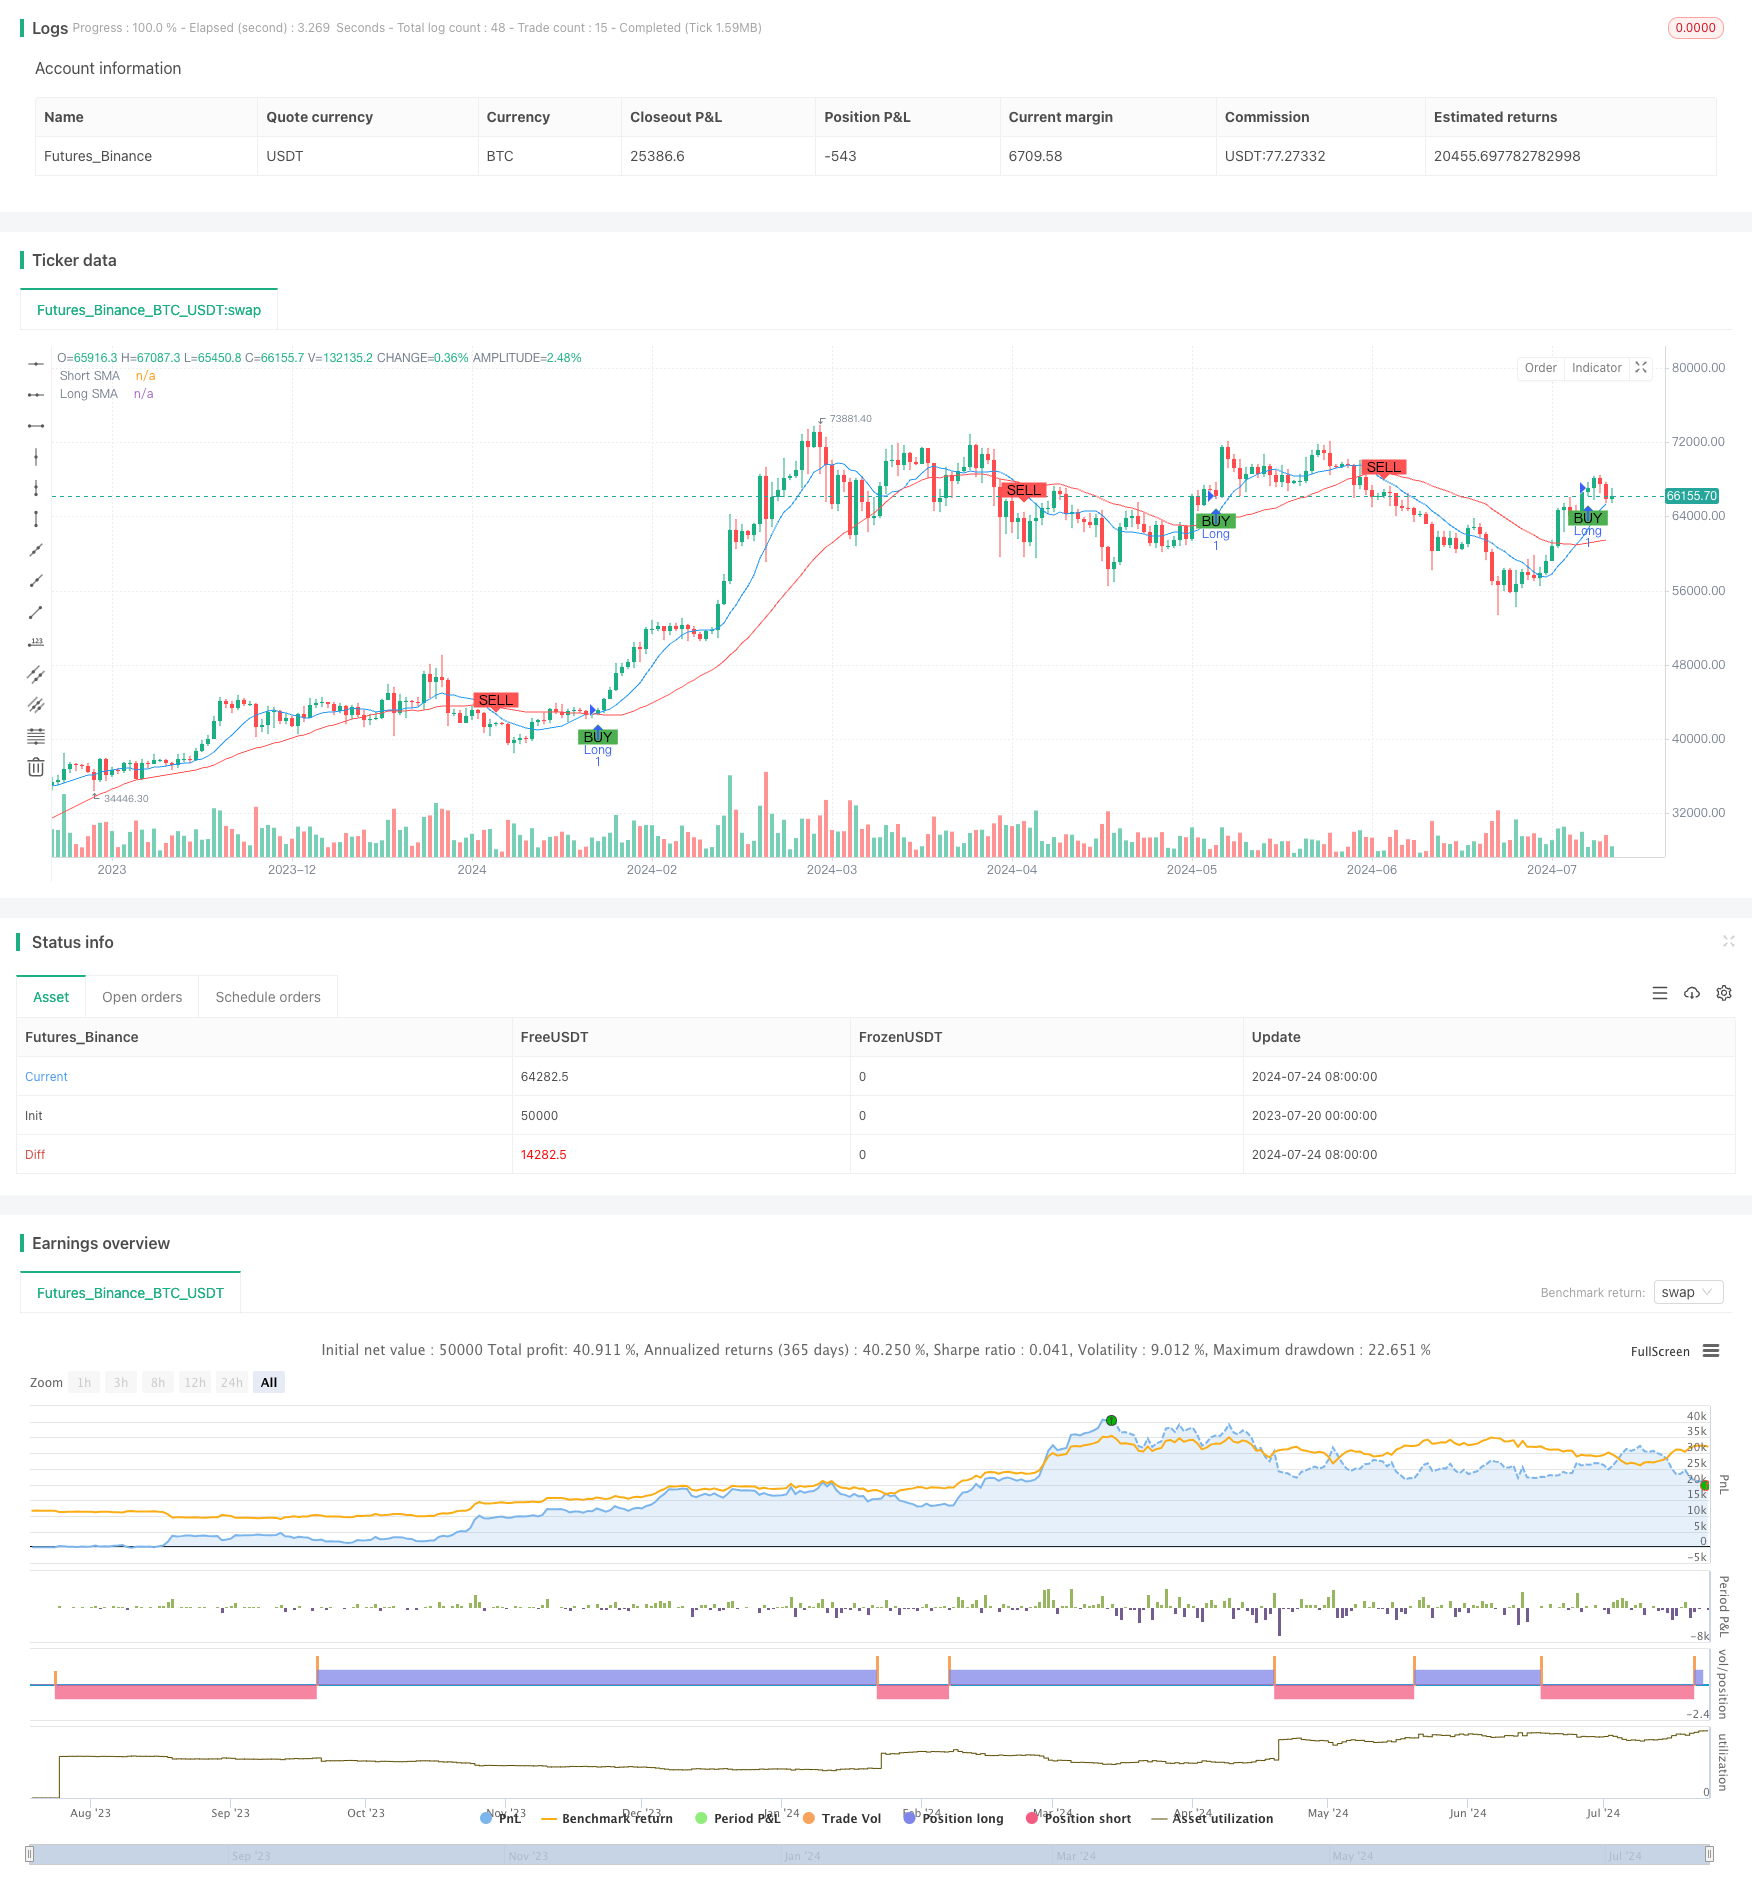
可视化:策略在图表上绘制了短期和长期SMA,以及买卖信号标记,方便交易者直观地观察市场状况和策略信号。
策略优势
趋势跟踪:通过使用SMA交叉,策略能够有效地识别和跟踪市场趋势,适合中长期交易。
信号确认:额外的一个周期确认机制有助于减少虚假信号,提高交易的可靠性。
风险管理:内置的止损和止盈机制有助于控制风险和保护利润,这对于长期稳定的交易至关重要。
灵活性:交易者可以根据自己的需求调整SMA周期、止损和止盈水平,使策略适应不同的市场环境和个人风险偏好。
可视化:策略提供了清晰的图表指示,包括SMA线和买卖信号标记,有助于交易者快速理解市场状况和策略判断。
策略风险
滞后性:作为滞后指标,SMA可能在快速变化的市场中反应不够及时,导致错过一些交易机会或产生滞后的信号。
震荡市场:在横盘或震荡市场中,SMA交叉策略可能产生频繁的假信号,导致过度交易和不必要的损失。
固定止损:1%的固定止损可能在某些高波动性市场中过于紧密,导致频繁被触发。
缺乏市场环境过滤:策略没有考虑整体市场环境,可能在不适合趋势跟踪的市场条件下仍然发出信号。
单一技术指标:仅依赖SMA可能忽视其他重要的市场信息,如成交量、波动率等。
策略优化方向
动态止损:考虑使用ATR(平均真实范围)来设置动态止损,使其能够根据市场波动性自动调整。
市场环境过滤:引入ADX(平均方向指数)等指标来评估市场趋势强度,仅在强趋势市场中执行交易。
多重时间框架分析:结合更长期的移动平均线或趋势指标,以确保交易方向与更大的市场趋势一致。
量化确认:除了价格确认外,考虑加入成交量确认,以增加信号的可靠性。
机器学习优化:使用机器学习算法动态调整SMA参数,以适应不同的市场周期。
回测和优化:对不同的参数组合进行全面的回测,找出在各种市场条件下表现最佳的设置。
总结
确认型均线交叉动量策略是一种结合了经典技术分析和风险管理的量化交易方法。通过使用SMA交叉和确认机制,该策略旨在捕捉市场趋势的重要转折点,同时通过额外的确认步骤来减少假信号。内置的止损和止盈机制进一步增强了策略的风险管理能力。
然而,像所有交易策略一样,它并非完美无缺。在震荡市场中的表现可能不尽如人意,且过度依赖单一技术指标可能导致忽视其他重要的市场信息。通过引入动态止损、市场环境过滤和多重时间框架分析等优化措施,可以显著提高策略的稳健性和适应性。
最终,成功应用这种策略需要交易者深入理解其原理,不断进行回测和优化,并根据个人风险承受能力和市场洞察力进行适当的参数调整。在正确的应用和持续改进下,确认型均线交叉动量策略有潜力成为交易者工具箱中的有力武器。
/*backtest
start: 2023-07-20 00:00:00
end: 2024-07-25 00:00:00
period: 1d
basePeriod: 1h
exchanges: [{"eid":"Futures_Binance","currency":"BTC_USDT"}]
*/

//@version=5
strategy("SMA Crossover Strategy with Confirmation", overlay=true)

// Input settings
shortSmaLength = input.int(10, title="Short SMA Length")
longSmaLength = input.int(30, title="Long SMA Length")
stopLossPercent = input.float(1.0, title="Stop Loss (%)", step=0.1) / 100
takeProfitPercent = input.float(10.0, title="Take Profit (%)", step=0.1) / 100

// Calculations
shortSma = ta.sma(close, shortSmaLength)
longSma = ta.sma(close, longSmaLength)

// Buy signal: Short SMA crosses above Long SMA and holds for one bar
buyCondition = ta.crossover(shortSma[1], longSma[1]) and shortSma > longSma

// Sell signal: Long SMA crosses above Short SMA and holds for one bar
sellCondition = ta.crossunder(shortSma[1], longSma[1]) and longSma > shortSma

// Execute strategy orders
if (buyCondition)
    strategy.entry("Long", strategy.long, stop=close * (1 - stopLossPercent), limit=close * (1 + takeProfitPercent))

if (sellCondition)
    strategy.entry("Short", strategy.short, stop=close * (1 - stopLossPercent), limit=close * (1 + takeProfitPercent))

// Plotting
plot(shortSma, title="Short SMA", color=color.blue)
plot(longSma, title="Long SMA", color=color.red)

// Signal markers on price chart
plotshape(series=buyCondition, title="Buy Signal", location=location.belowbar, color=color.green, style=shape.labelup, text="BUY")
plotshape(series=sellCondition, title="Sell Signal", location=location.abovebar, color=color.red, style=shape.labeldown, text="SELL")