PVT-EMA Trend Crossover Volume-Price Strategy
Author: ChaoZhang, Date: 2024-11-27 15:01:02Tags: PVTEMA

Overview
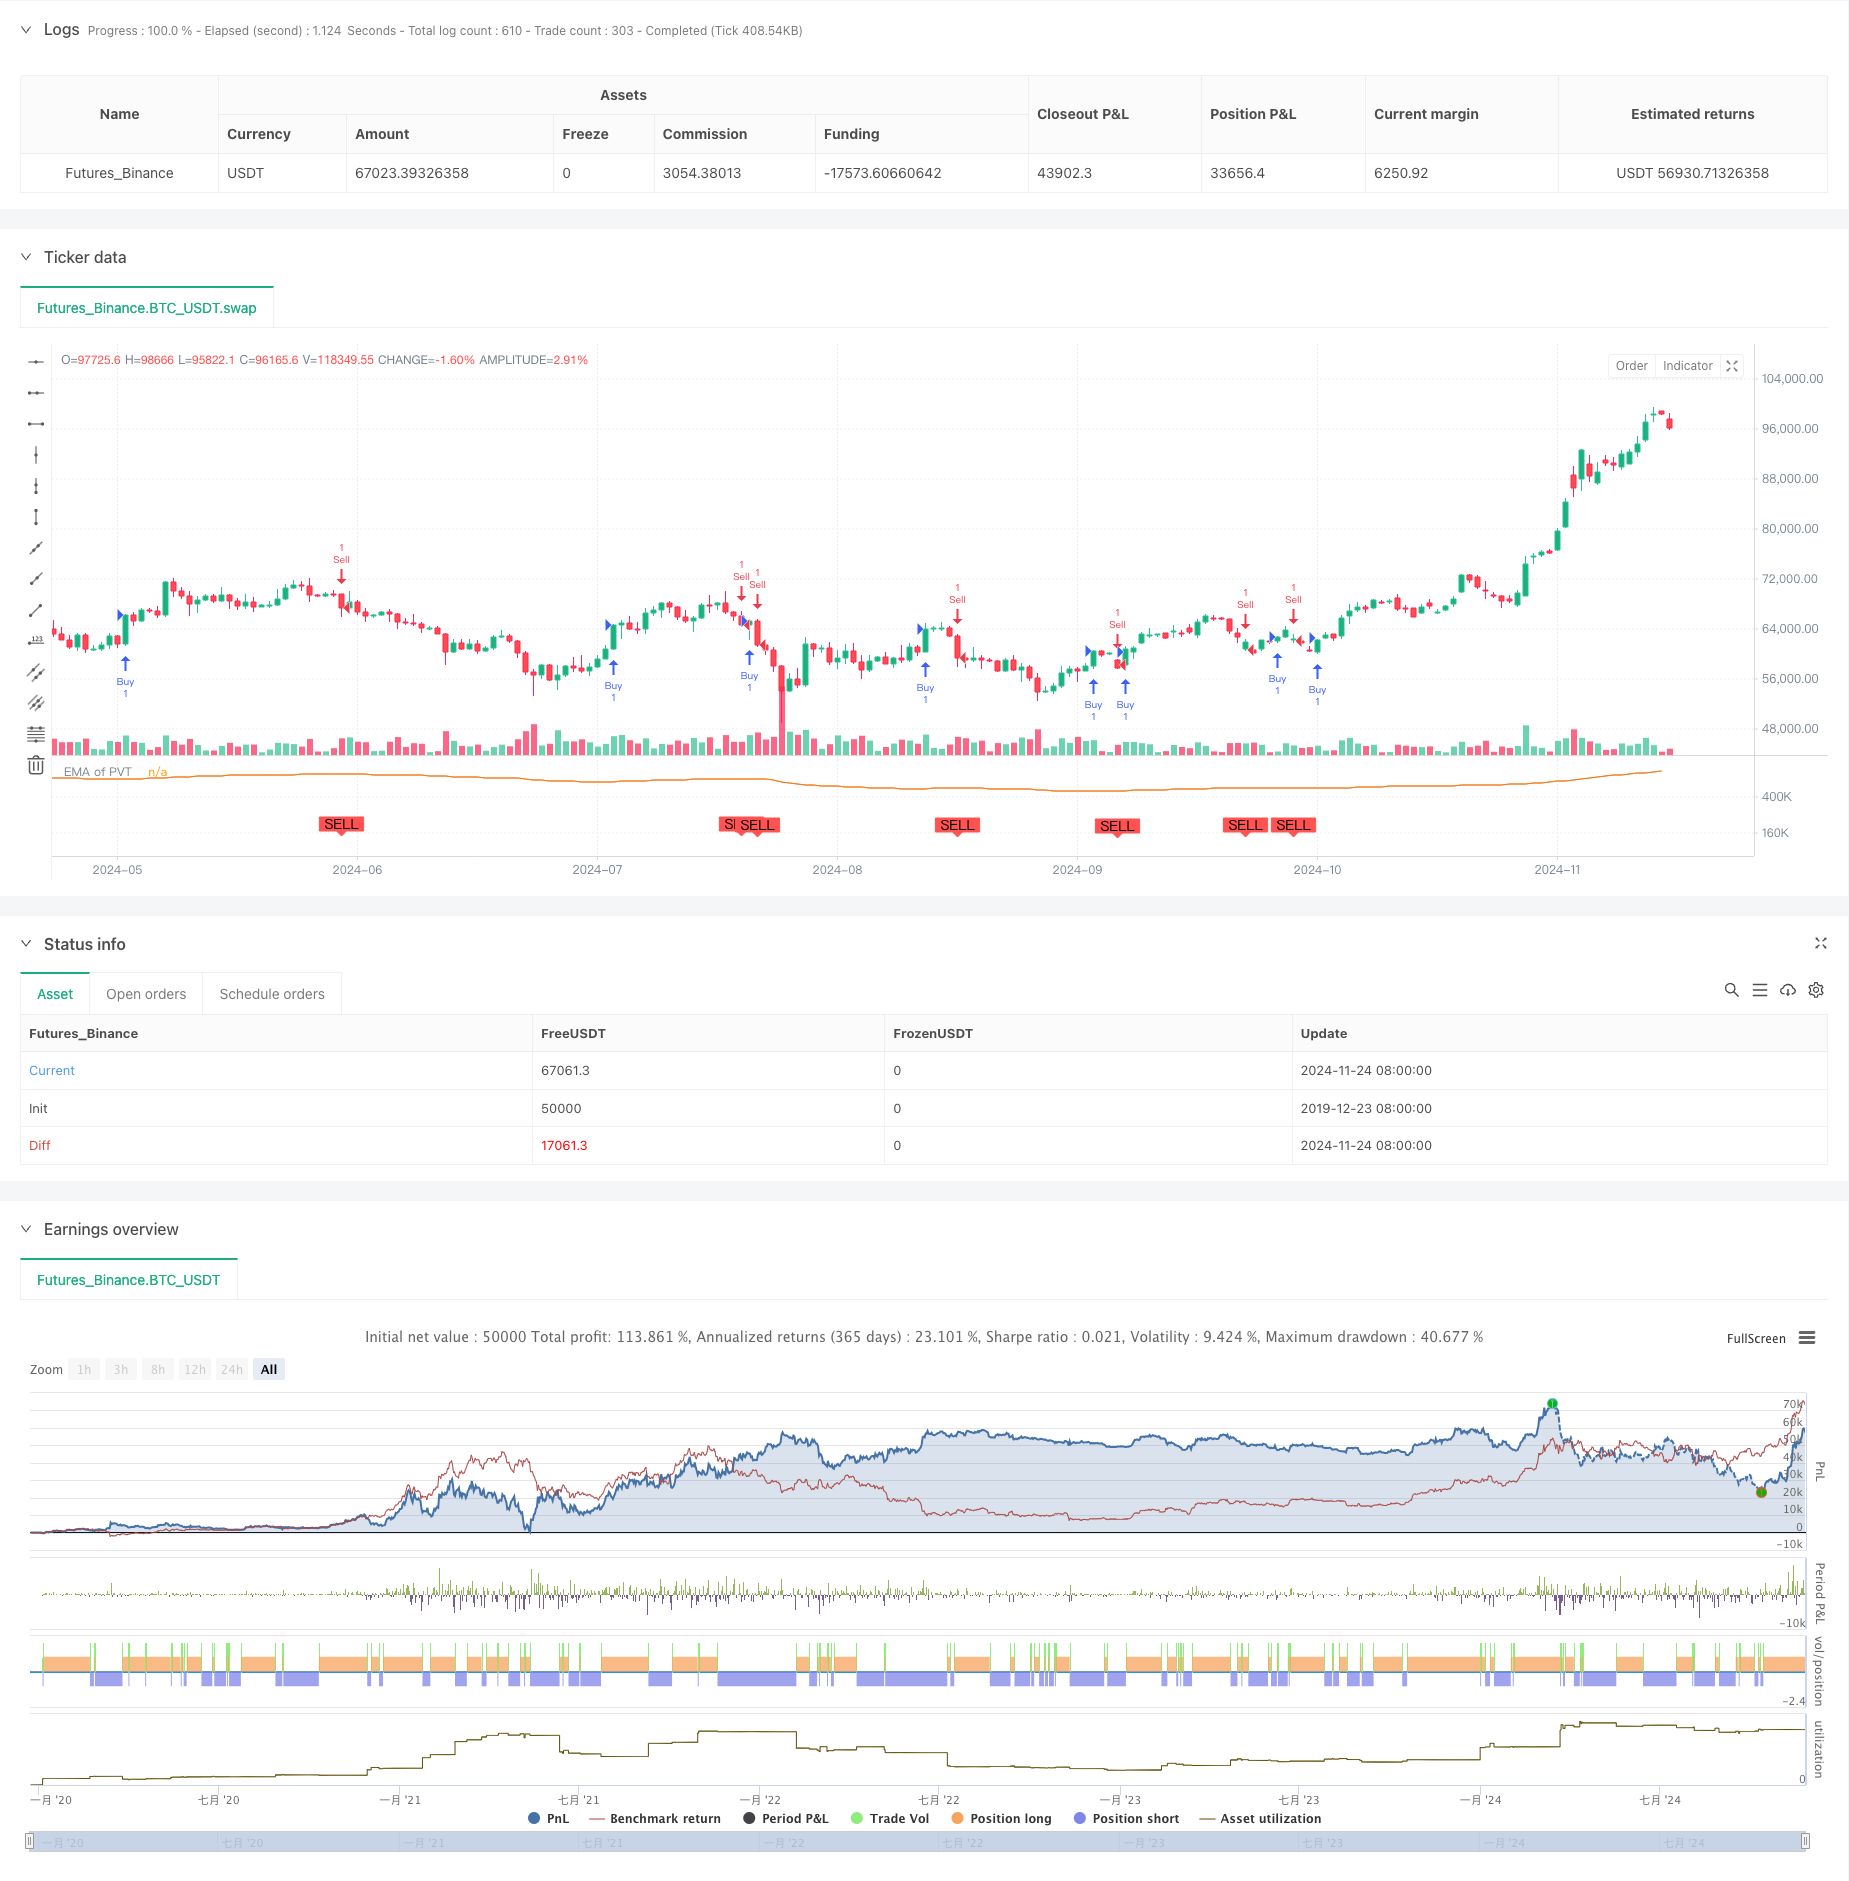
This strategy is a trend-following trading system based on the crossover between the Price Volume Trend (PVT) indicator and its Exponential Moving Average (EMA). The strategy identifies market trend changes by monitoring the crossover situations between PVT and its EMA, thereby capturing potential trading opportunities. This method combines price movements and volume changes to more accurately reflect true market trends.
Strategy Principle
The core of the strategy utilizes the PVT indicator, which tracks market trends by combining price movements with trading volume. Specifically, the PVT value is calculated by accumulating the product of daily price change percentage and daily volume. A 20-period EMA of PVT is then calculated as a reference line. Buy signals are generated when PVT crosses above its EMA, while sell signals are generated when PVT crosses below its EMA. These crossover signals are used to determine market trend turning points.
Strategy Advantages
- Price-Volume Integration: The strategy provides a more comprehensive market analysis by integrating price and volume data.
- Trend Confirmation: Using EMA as a filter reduces false signals and improves trading reliability.
- Clear Signals: Crossover signals are clear and easy to execute.
- High Adaptability: The strategy can be applied to different market environments, performing particularly well in markets with significant volume fluctuations.
- Adjustable Parameters: The EMA period can be adjusted according to different trading timeframes and market characteristics.
Strategy Risks
- Lag: Due to the use of EMA, signals may have some delay.
- Poor Performance in Ranging Markets: May generate frequent false signals in sideways markets.
- Money Management: The strategy itself doesn’t set stop-loss or take-profit levels, requiring traders to manage risk independently.
- Volume Dependency: Strategy effectiveness heavily relies on the quality and reliability of volume data.
- Transaction Costs: Frequent trading signals may result in high transaction costs.
Strategy Optimization Directions
- Stop-Loss Optimization: Suggest adding dynamic stop-loss mechanisms using ATR or fixed percentage stops.
- Signal Filtering: Can add trend filters, such as longer-period moving averages, to reduce false signals.
- Position Management: Suggest dynamically adjusting position sizes based on signal strength and market volatility.
- Time Filtering: Can incorporate trading time filters to avoid trading during highly volatile periods.
- Multi-timeframe Confirmation: Consider adding multiple timeframe confirmation mechanisms to improve signal reliability.
Conclusion
The PVT-EMA Trend Crossover Strategy is a complete trading system that combines price, volume, and trend analysis. While it has certain lag and false signal risks, the strategy can become a reliable trading tool through appropriate optimization and risk management. Traders are advised to conduct thorough backtesting before live implementation and adjust parameters according to specific market characteristics.
/*backtest
start: 2019-12-23 08:00:00
end: 2024-11-25 08:00:00
period: 1d
basePeriod: 1d
exchanges: [{"eid":"Futures_Binance","currency":"BTC_USDT"}]
*/

// This Pine Script™ code is subject to the terms of the Mozilla Public License 2.0 at https://mozilla.org/MPL/2.0/
// © PakunFX

//@version=5
strategy(title="PVT Crossover Strategy", shorttitle="PVT Strategy", overlay=false, calc_on_every_tick=true)

// PVTの計算
var cumVol = 0.
cumVol += nz(volume)
if barstate.islast and cumVol == 0
    runtime.error("No volume is provided by the data vendor.")
src = close
pvt = ta.cum(ta.change(src) / src[1] * volume)

// EMAの計算(PVTをソースに使用)
emaLength = input.int(20, minval=1, title="EMA Length")
emaPVT = ta.ema(pvt, emaLength)
// プロットをオフにする
plot(emaPVT, title="EMA of PVT", color=#f37f20, display=display.none)

// クロスオーバー戦略
longCondition = ta.crossover(pvt, emaPVT)
shortCondition = ta.crossunder(pvt, emaPVT)

// シグナル表示もオフにする
plotshape(series=longCondition, title="Buy Signal", location=location.belowbar, color=color.green, style=shape.labelup, text="BUY", display=display.none)
plotshape(series=shortCondition, title="Sell Signal", location=location.abovebar, color=color.red, style=shape.labeldown, text="SELL", display=display.none)

// 戦略エントリー
if (longCondition)
    strategy.entry("Buy", strategy.long)
if (shortCondition)
    strategy.entry("Sell", strategy.short)
- Multi-Indicator Synergistic Trend Following Strategy with Dynamic Stop-Loss System
- Combo 2/20 EMA & Bandpass Filter
- EMA TREND CLOUD
- TrendScalp-FractalBox-3EMA
- EMA Crossover with Short-term Signals Strategy
- Ichimoku Cloud Smooth Oscillator
- Multi-EMA Golden Cross Strategy with Tiered Take-Profit
- Dynamic Dual EMA Crossover Quantitative Trading Strategy
- Backtesting- Indicator
- Dual EMA Momentum Trend Trading Strategy with Full Body Candle Signal System
- EMA Crossover Strategy with Stop Loss and Take Profit Optimization System
- VWAP-MACD-RSI Multi-Factor Quantitative Trading Strategy
- Triple Moving Average Trend Following and Momentum Integration Quantitative Trading Strategy
- Z-Score and Supertrend Based Dynamic Trading Strategy: Long-Short Switching System
- Adaptive Bollinger Breakout with Moving Average Quantitative Strategy System
- AI-Optimized Adaptive Stop-Loss Trading System with Multiple Technical Indicator Integration
- Multi-Period Moving Average Crossover with Volume Analysis System
- Dual Moving Average Momentum Tracking Quantitative Strategy
- Dual Moving Average Crossover Strategy with Adaptive Stop-Loss and Take-Profit
- Adaptive Trend Following Strategy Based on Momentum Oscillator
- MACD-EMA Multi-Period Dynamic Crossover Quantitative Trading System
- MACD Dynamic Oscillation Cross-Prediction Strategy
- VWAP-ATR Dynamic Price Action Trading System
- Dynamic Trend Quantitative Strategy Based on Bollinger Bands and RSI Cross
- Mean Reversion Strategy with Bollinger Bands, RSI and ATR-Based Dynamic Stop-Loss System
- Dynamic Trading Strategy System Based on Parabolic SAR Indicator
- Adaptive Volatility and Momentum Quantitative Trading System (AVMQTS)
- Advanced Trend Trading Strategy Based on Bollinger Bands and Candlestick Patterns
- ATR Volatility and Moving Average Based Adaptive Trend Following Exit Strategy
- Dual EMA Momentum Trend Trading Strategy with Full Body Candle Signal System