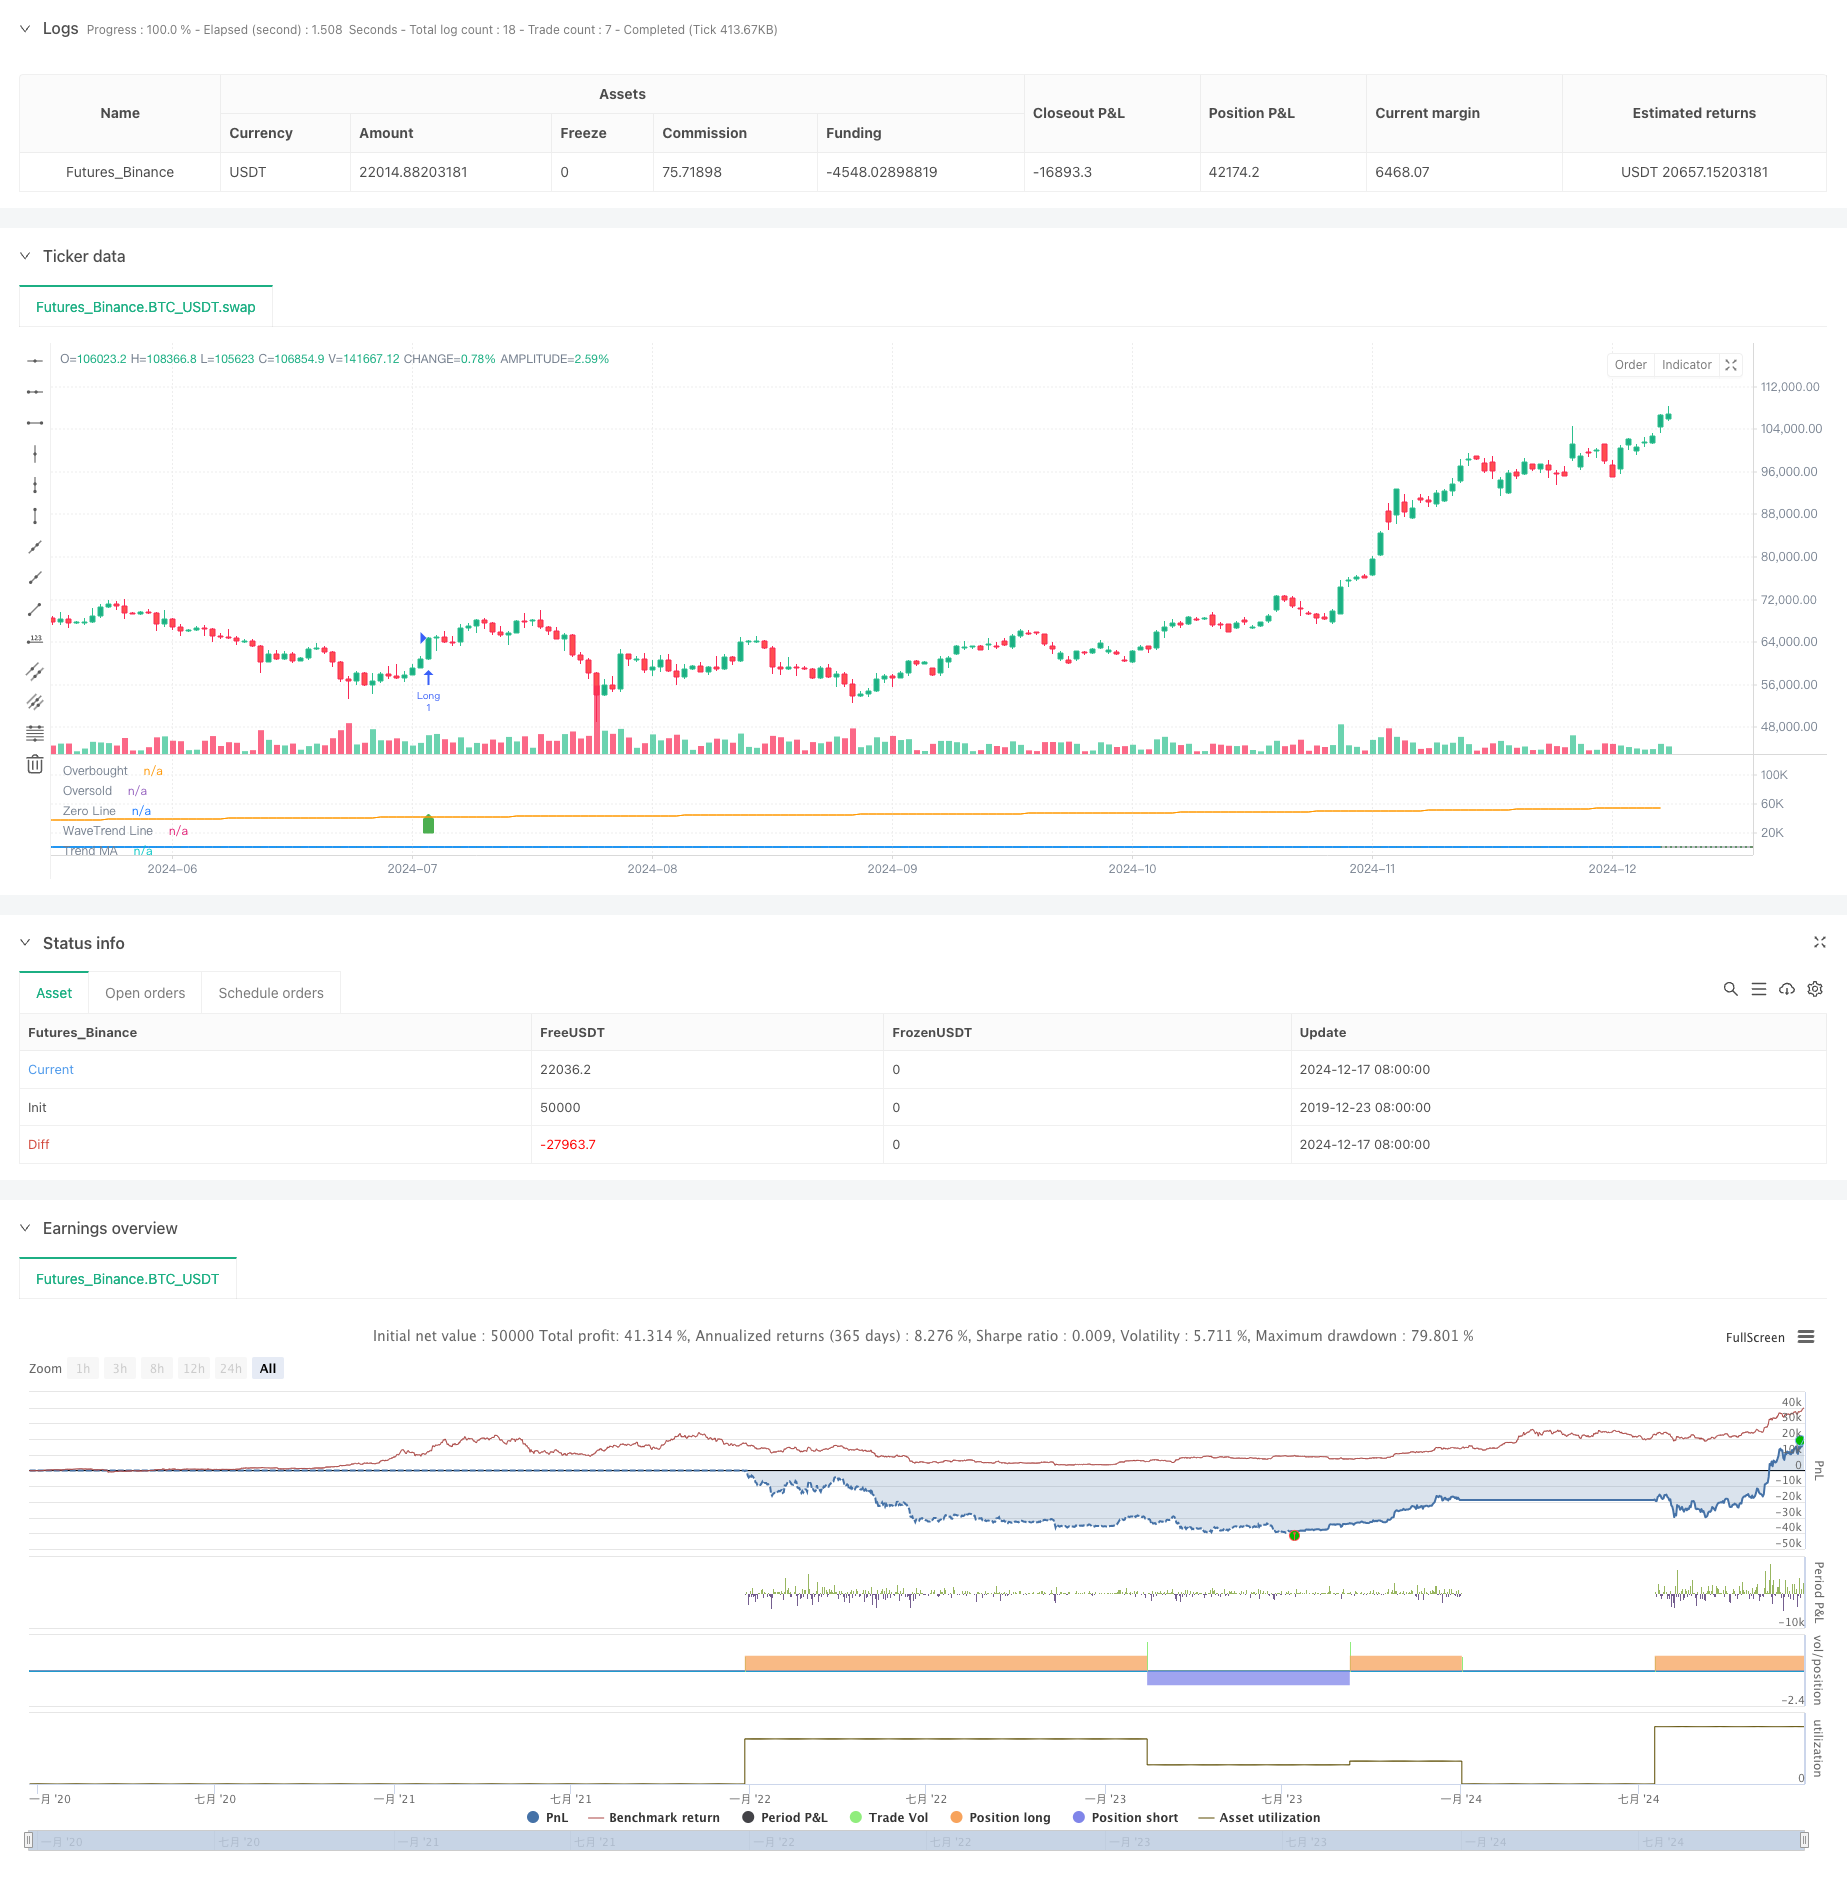
গতিশীল তরঙ্গ-প্রবণতা ট্র্যাকিং কৌশল
লেখক:চাওঝাং, তারিখঃ ২০২৪-১২-২০ট্যাগঃইএমএএসএমএএইচএলসিএমএ

সারসংক্ষেপ
এই কৌশলটি ওয়েভট্রেন্ড সূচক এবং প্রবণতা অনুসরণের উপর ভিত্তি করে একটি পরিমাণগত ট্রেডিং সিস্টেম। এটি একটি সম্পূর্ণ ট্রেডিং সিদ্ধান্তের কাঠামো গঠনের জন্য ওয়েভট্রেন্ড সূচককে চলমান গড়ের সাথে একত্রিত করে। কৌশলটি তরঙ্গ প্রবণতা মান এবং সামগ্রিক বাজারের প্রবণতা গণনা করতে ইএমএ এবং এসএমএ ব্যবহার করে, ওভারকপ এবং ওভারসোল্ড থ্রেশহোল্ডের মাধ্যমে বাজারের বাঁক চিহ্নিত করে এবং ট্রেডিং নির্ভুলতা উন্নত করতে প্রবণতা ফিল্টার অন্তর্ভুক্ত করে।
কৌশল নীতি
এই কৌশল নিম্নলিখিত ধাপগুলির মাধ্যমে বাস্তবায়িত হয়:
- HLC গড় মূল্য গণনা করুন (উচ্চ, নিম্ন এবং বন্ধ মূল্যের গড়)
- ইএসএ লাইন পাওয়ার জন্য ইএমএ ব্যবহার করে এইচএলসি গড়টি মসৃণ করুন
- EMA ব্যবহার করে HLC গড় এবং ESA লাইনের মধ্যে বিচ্যুতি গণনা এবং মসৃণ
- বিচ্যুতি উপর ভিত্তি করে K মান গণনা এবং চূড়ান্ত TCI লাইন পেতে EMA সঙ্গে দুবার মসৃণ
- প্রবণতা ফিল্টার হিসাবে দীর্ঘমেয়াদী প্রবণতা লাইন গণনা করতে এসএমএ ব্যবহার করুন
- যখন TCI লাইন ওভারকুপেড/ওভারসোল্ড লেভেল অতিক্রম করে এবং ট্রেন্ডের দিকনির্দেশের সাথে সামঞ্জস্য করে তখন ট্রেডিং সংকেত উৎপন্ন করে
কৌশলগত সুবিধা
- উচ্চ সংকেত নির্ভরযোগ্যতাঃ WaveTrend সূচক এবং প্রবণতা ফিল্টার একত্রিত করে কার্যকরভাবে মিথ্যা সংকেত হ্রাস করে
- সম্পূর্ণ ঝুঁকি নিয়ন্ত্রণঃ সময়মত স্টপ লস করার জন্য অতিরিক্ত ক্রয়/অতিরিক্ত বিক্রয়ের সীমা পরিষ্কার করুন
- শক্তিশালী অভিযোজনযোগ্যতাঃ বিভিন্ন বাজারের অবস্থার জন্য কৌশলগত পরামিতিগুলি নমনীয়ভাবে সামঞ্জস্য করা যেতে পারে
- স্পষ্ট অপারেশনাল লজিকঃ স্পষ্ট প্রবেশ এবং প্রস্থান শর্ত, সহজ বাস্তবায়ন
- বিস্তৃত বিশ্লেষণঃ স্বল্পমেয়াদী ও দীর্ঘমেয়াদী প্রবণতা উভয়ই বিবেচনা করে, বাণিজ্যের স্থিতিশীলতা উন্নত করে
কৌশলগত ঝুঁকি
- প্রবণতা বিপরীত হওয়ার ঝুঁকিঃ অস্থির বাজারে বিলম্ব হতে পারে
- প্যারামিটার সংবেদনশীলতাঃ বিভিন্ন প্যারামিটার সমন্বয়গুলি ব্যাপকভাবে ভিন্ন ফলাফলের দিকে নিয়ে যেতে পারে
- বাজারের অভিযোজনযোগ্যতাঃ বিভিন্ন বাজারে ঘন ঘন ট্রেডিং সৃষ্টি করতে পারে
- মূলধন ব্যবস্থাপনাঃ বাজারের অস্থিরতা মোকাবেলায় যুক্তিসঙ্গত অবস্থান নিয়ন্ত্রণের প্রয়োজন
- প্রযুক্তিগত নির্ভরতাঃ প্রযুক্তিগত সূচকগুলির উপর নির্ভরশীলতা মৌলিক কারণগুলিকে উপেক্ষা করতে পারে
কৌশল অপ্টিমাইজেশান নির্দেশাবলী
- ভোল্টেবিলিটি ফিল্টার যোগ করুনঃ উচ্চ ভোল্টেবিলিটি সময়কালে ট্রেডিং থ্রেশহোল্ড সামঞ্জস্য করুন
- মাল্টি-টাইমফ্রেম বিশ্লেষণ অন্তর্ভুক্ত করুনঃ নির্ভুলতা উন্নত করতে বিভিন্ন সময়সীমার সংকেতগুলি একত্রিত করুন
- প্যারামিটার অভিযোজন অপ্টিমাইজ করুনঃ বাজারের অবস্থার উপর ভিত্তি করে সূচক প্যারামিটারগুলিকে গতিশীলভাবে সামঞ্জস্য করুন
- মুনাফা/হানি ব্যবস্থাপনা উন্নত করাঃ গতিশীল লাভ গ্রহণ এবং স্টপ-লস প্রক্রিয়া যোগ করা
- ভলিউম নিশ্চিতকরণ যোগ করুনঃ সংকেত নির্ভরযোগ্যতা উন্নত করতে ভলিউম বিশ্লেষণ অন্তর্ভুক্ত করুন
সংক্ষিপ্তসার
কৌশলটি ওয়েভট্রেন্ড সূচককে প্রবণতা ফিল্টারগুলির সাথে বুদ্ধিমানভাবে একত্রিত করে একটি শক্তিশালী ট্রেডিং সিস্টেম তৈরি করে। অপারেশনাল সরলতা বজায় রেখে এটি ব্যাপক বাজার বিশ্লেষণ অর্জন করে। যদিও কিছু ঝুঁকি রয়েছে, কৌশলটি সঠিক ঝুঁকি ব্যবস্থাপনা এবং ক্রমাগত অপ্টিমাইজেশনের মাধ্যমে ভাল ব্যবহারিক মূল্য এবং বিকাশের সম্ভাবনা রয়েছে।
/*backtest
start: 2019-12-23 08:00:00
end: 2024-12-18 08:00:00
period: 1d
basePeriod: 1d
exchanges: [{"eid":"Futures_Binance","currency":"BTC_USDT"}]
*/

// This Pine Script™ code is subject to the terms of the Mozilla Public License 2.0 at https://mozilla.org/MPL/2.0/
// © mojomarv

//@version=6
strategy("WaveTrend with Trend Filter", shorttitle="WaveTrend Trend", overlay=false, initial_capital = 100000)

// Inputs for the WaveTrend indicator
inputLength = input.int(10, title="Channel Length", minval=1)
avgLength = input.int(21, title="Average Length", minval=1)
obLevel = input.float(45, title="Overbought Level")
osLevel = input.float(-45, title="Oversold Level")
showSignals = input.bool(true, title="Show Buy/Sell Signals")

// Trend filter input
maLength = input.int(500, title="Trend MA Length", minval=1)

// Calculate WaveTrend values
hlc_avg = (high + low + close) / 3  // Renamed from hlc3 to hlc_avg
esa = ta.ema(hlc_avg, inputLength)
d = ta.ema(math.abs(hlc_avg - esa), inputLength)
k = (hlc_avg - esa) / (0.015 * d)
ci = ta.ema(k, avgLength)
tci = ta.ema(ci, avgLength)

// Moving average for trend detection
trendMA = ta.sma(close, maLength)

// Determine trend
bullishTrend = close > trendMA
bearishTrend = close < trendMA

// Generate signals with trend filter
crossUp = ta.crossover(tci, osLevel)
crossDown = ta.crossunder(tci, obLevel)

// Plot WaveTrend
plot(tci, title="WaveTrend Line", color=color.new(color.blue, 0), linewidth=2)
hline(obLevel, "Overbought", color=color.red, linestyle=hline.style_dotted)
hline(osLevel, "Oversold", color=color.green, linestyle=hline.style_dotted)
hline(0, "Zero Line", color=color.gray, linestyle=hline.style_solid)

// Plot moving average for trend visualization
plot(trendMA, title="Trend MA", color=color.orange, linewidth=1)

// Plot buy and sell signals
plotshape(showSignals and crossUp, title="Buy Signal", location=location.belowbar, style=shape.labelup, color=color.new(color.green, 0), size=size.small)
plotshape(showSignals and crossDown, title="Sell Signal", location=location.abovebar, style=shape.labeldown, color=color.new(color.red, 0), size=size.small)

// Alerts
alertcondition(crossUp, title="Buy Alert", message="WaveTrend Buy Signal (Trend Confirmed)")
alertcondition(crossDown, title="Sell Alert", message="WaveTrend Sell Signal (Trend Confirmed)")
alertcondition(bullishTrend, title="bull", message="WaveTrend Sell Signal (Trend Confirmed)")
alertcondition(bearishTrend, title="bear", message="WaveTrend Sell Signal (Trend Confirmed)")

// Strategy logic
if crossUp and bullishTrend
    strategy.entry("Long", strategy.long)

if crossDown
    strategy.close("Long")

if crossDown and bearishTrend
    strategy.entry("Short", strategy.short)

if crossUp
    strategy.close("Short")
- এমএ, এসএএমএ, এমএ ঢাল, ট্রেইলিং স্টপ লস, পুনরায় প্রবেশ
- মাল্টি-পিরিয়ড চলমান গড় ক্রসওভার কৌশল অনুসরণ করে গতিশীল প্রবণতা
- ডায়নামিক ফিবোনাচি রিট্র্যাকশন ট্রেডিং কৌশল
- বোলিংজার অ্যামেজিং অ্যালার্ট R1
- মাল্টি-লেভেল ফিবোনাচি ইএমএ ট্রেন্ড অনুসরণকারী কৌশল
- ইচিমোকু ক্লাউড ব্রেকআউট এবং স্টপ-লস সিস্টেমের সাথে কৌশল অনুসরণ করে মাল্টি-টেকনিক্যাল ইন্ডিকেটর ট্রেন্ড
- দ্বৈত গতিশীল সূচক অপ্টিমাইজেশান কৌশল
- অপ্টিমাইজড লং ট্রেডিংয়ের জন্য এমএসিডি এবং মার্টিনগেল সংমিশ্রণ কৌশল
- ডাবল মুভিং এভারেজ এমএসিডি ক্রসওভার তারিখ-সামঞ্জস্যযোগ্য পরিমাণগত ট্রেডিং কৌশল
- MACD Multi-Interval Dynamic Stop-Loss এবং Take-Profit ট্রেডিং সিস্টেম
- সমর্থন/প্রতিরোধের সাথে মাল্টি-পিরিয়ড আরএসআই ডিভার্জেন্স
- ডায়নামিক ড্রাউনডাউন কন্ট্রোল সিস্টেমের সাথে অভিযোজিত প্রবণতা অনুসরণ কৌশল
- মাল্টি-ইএমএ গোল্ডেন ক্রস স্ট্র্যাটেজি
- মাল্টি-টেকনিক্যাল ইন্ডিকেটর ক্রস-ট্রেন্ড ট্র্যাকিং কৌশলঃ আরএসআই এবং স্টোকাস্টিক আরএসআই সিনার্জি ট্রেডিং সিস্টেম
- ডায়নামিক ক্রয় এন্ট্রি কৌশল যা ইএমএ ক্রসিং এবং ক্যান্ডেল বডি অনুপ্রবেশকে একত্রিত করে
- বুদ্ধিমান ওয়েভ-ট্রেন্ড ডলার খরচ গড় চক্রীয় ট্রেডিং কৌশল
- ম্যাকডি-আরএসআই ক্রসওভার ট্রেন্ড বোলিংজার ব্যান্ডস অপ্টিমাইজেশন সিস্টেমের সাথে কৌশল অনুসরণ করে
- এডাপ্টিভ ইএমএ ডায়নামিক পজিশন ব্রেকআউট ট্রেডিং স্ট্র্যাটেজি
- মাল্টি-ইন্ডিকেটর ডায়নামিক ট্রেডিং অপ্টিমাইজেশান কৌশল
- ডায়নামিক প্রফিট লক পরিমাণগত ট্রেডিং কৌশল সহ মাল্টি-এসএমএ জোনের ব্রেকআউট
- ভলিউম কনফার্মেশনের সাথে স্ট্রাকচারের বিরতি
- মাল্টি ইন্ডিকেটর ডায়নামিক স্টপ-লস ইম্পুটাম ট্রেডিং ট্রেন্ড কৌশল
- ফিবোনাচি রিট্র্যাক্সেন্ট লেভেলের উপর ভিত্তি করে পরিমাণগত ট্রেডিং কৌশল অনুসরণ করে মাল্টি-কন্ডিশন ট্রেন্ড
- ট্রেডিং কৌশল অনুসারে মাল্টি-মোভিং গড় প্রবণতা
- মাল্টি-ফিল্টার ট্রেন্ড ব্রুকথ্রু স্মার্ট মুভিং এভারেজ ট্রেডিং স্ট্র্যাটেজি
- ডায়নামিক ইএমএ (EMA) -এর অগ্রগতি ও বিপরীতমুখী কৌশল
- জি-চ্যানেল সূচক সহ গতিশীল প্রবণতা গতি অপ্টিমাইজেশন কৌশল
- মাল্টি-লেভেল এটিএইচ ডায়নামিক ট্র্যাকিং ট্রিপল এন্ট্রি কৌশল
- গারম্যান-ক্লাস ভোলটাইলিটি ডায়নামিক ট্র্যাকিং কৌশল সহ অভিযোজিত ভিডাব্লুএপি ব্যান্ড
- ইএমএ ক্রস স্ট্র্যাটেজি অনুসরণ করে একাধিক সূচক ট্রেন্ড