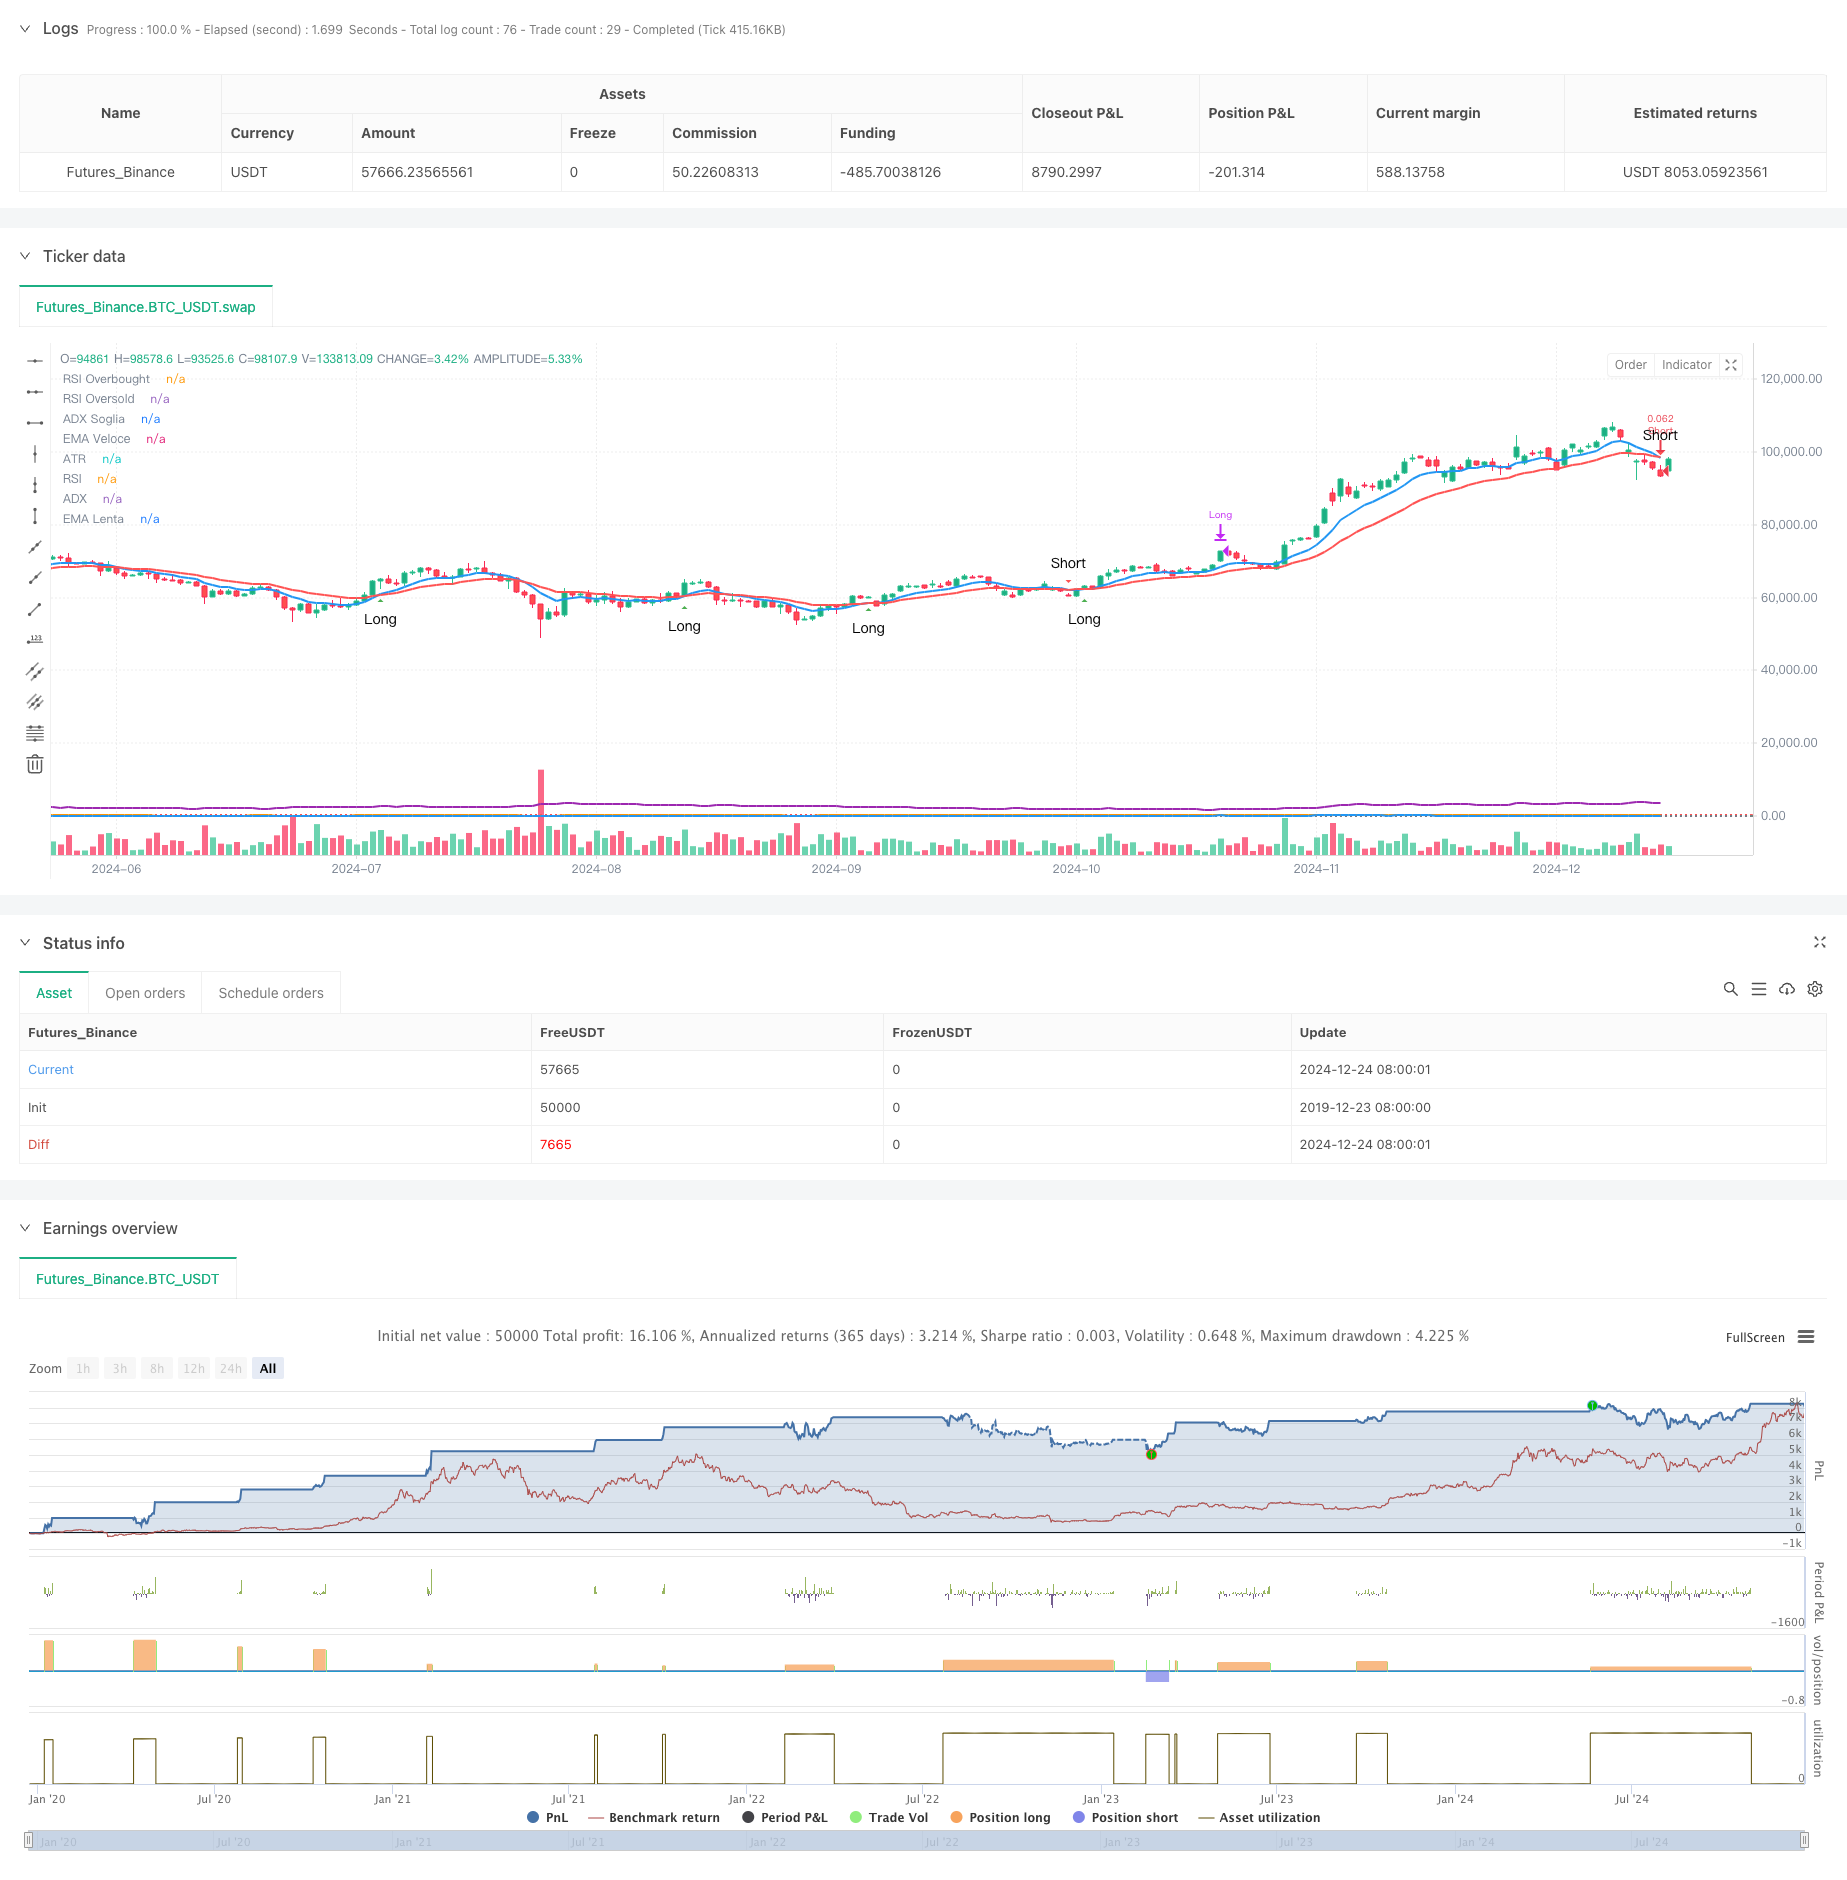
Hochfrequenz-Dynamikoptimierungsstrategie auf der Grundlage mehrfacher technischer Indikatoren
Schriftsteller:ChaoZhang, Datum: 2024-12-27Tags:EMARSIADXATRSLTPHFT

Übersicht
Diese Strategie ist eine Hochfrequenz-Handelsstrategie, die auf einem 15-minütigen Zeitrahmen basiert. Sie kombiniert mehrere technische Indikatoren, darunter den Exponential Moving Average (EMA), den Relative Strength Index (RSI), den Average Directional Index (ADX) und den Average True Range (ATR), um eine präzise Handelssignalerfassung und ein dynamisches Risikomanagement zu erreichen.
Strategieprinzipien
Die Kernlogik basiert auf dem Crossover von schneller EMA (9 Perioden) und langsamer EMA (21 Perioden) zur Erzeugung von Handelssignalen. Der RSI (14 Perioden) filtert überkaufte/überverkaufte Zonen, der ADX (14 Perioden) bestätigt die Trendstärke und der ATR (14 Perioden) setzt dynamisch Stop-Loss- und Take-Profit-Levels fest. Die Kombination mehrerer technischer Indikatoren gewährleistet Signalzuverlässigkeit. Die Einstiegsbedingungen umfassen:
Strategische Vorteile
- Hohe Signalzuverlässigkeit: Die Quervalidierung mehrerer technischer Indikatoren verbessert die Genauigkeit der Handelssignale erheblich
- Flexibles Risikomanagement: Dynamische Stop-Loss- und Take-Profit-Einstellungen auf Basis von ATR werden automatisch an die Marktvolatilität angepasst
- Ausreichende Handelsmöglichkeiten: Ein 15-minütiger Zeitrahmen bietet ausreichende Handelsmöglichkeiten
- Hohe Sichtbarkeit: Klares Diagrammaufbau und Signalanzeige erleichtern schnelle Entscheidungen
- Hohe Automatisierung: Komplettes Signalsystem unterstützt die automatisierte Handelsausführung
Strategische Risiken
- Marktvolatilitätsrisiko: Der Hochfrequenzhandel kann in volatilen Märkten mit einem Verschiebungsrisiko konfrontiert sein.
- Risiko eines falschen Ausbruchs: Kurze Zeitrahmen können falsche Signale erzeugen, die eine ADX-Filterung erfordern.
- Geldmanagementrisiko: Häufiges Handeln kann zu kumulierten Gebühren führen, die eine angemessene Positionsgröße erfordern
- Technisches Risiko: Mehrere Indikatoren können unter bestimmten Marktbedingungen widersprüchliche Signale erzeugen
- Ausführungsrisiko: Automatisierte Handelssysteme erfordern eine stabile Netzwerkumgebung und Ausführungsbedingungen
Strategieoptimierungsrichtlinien
- Optimierung von Indikatorparametern: Parameter können durch Backtesting optimiert werden, um sich besser an spezifische Marktbedingungen anzupassen
- Verbesserung des Signalfilters: Als Hilfsfilterbedingungen können Lautstärken angezeigt werden
- Verbesserung der Risikokontrolle: Dynamisches Positionsmanagement kann eingeführt werden, um die Handelsgröße anhand der Marktvolatilität anzupassen
- Zeitfensteroptimierung: Handelszeitfenster können dynamisch an unterschiedliche Marktphasen angepasst werden
- Optimierung der Stop-Loss-Strategie: Zur Verbesserung des Gewinnschutzes kann ein Trailing Stop-Loss-Mechanismus eingeführt werden
Zusammenfassung
Die Strategie erreicht ein Gleichgewicht zwischen Signalfassung und Risikokontrolle im Hochfrequenzhandel durch die Synergie mehrerer technischer Indikatoren. Klares Visualisierungsdesign und umfassende Automatisierungsunterstützung machen sie sehr praktisch. Durch kontinuierliche Optimierung und Risikomanagementverbesserungen verspricht die Strategie eine stabile Performance in verschiedenen Marktumgebungen. Während Risiken bestehen, können sie durch richtige Parameter-Einstellungen und Risikokontrollmaßnahmen kontrolliert werden.
/*backtest
start: 2019-12-23 08:00:00
end: 2024-12-25 08:00:00
period: 1d
basePeriod: 1d
exchanges: [{"eid":"Futures_Binance","currency":"BTC_USDT"}]
*/

//@version=5
strategy("Scalping BTC Ottimizzato - Grafica Chiara", shorttitle="Scalp BTC Opt", overlay=true, default_qty_type=strategy.percent_of_equity, default_qty_value=10)

// === 📊 INPUTS ===
// 📈 Medie Mobili
emaFastLength = input.int(9, title="EMA Veloce", minval=1)
emaSlowLength = input.int(21, title="EMA Lenta", minval=1)

// 💡 RSI
rsiLength = input.int(14, title="RSI Length", minval=1)
rsiOverbought = input.int(70, title="RSI Overbought")
rsiOversold = input.int(30, title="RSI Oversold")

// 📊 ATR (Stop Loss e Take Profit)
atrLength = input.int(14, title="ATR Length", minval=1)
stopATR = input.float(1.5, title="Stop Loss (ATR Multiplo)", step=0.1)
takeProfitATR = input.float(2.0, title="Take Profit (ATR Multiplo)", step=0.1)

// 🔀 ADX
adxLength = input.int(14, title="ADX Length", minval=1)
adxSmoothing = input.int(14, title="ADX Smoothing", minval=1)
adxThreshold = input.int(20, title="Soglia ADX per Trend Forte", minval=1)

// === 📊 CALCOLI PRINCIPALI ===
// 📈 Medie Mobili
emaFast = ta.ema(close, emaFastLength)
emaSlow = ta.ema(close, emaSlowLength)

// 💡 RSI
rsi = ta.rsi(close, rsiLength)

// 📊 ATR
atr = ta.atr(atrLength)

// 🔀 ADX tramite DMI con Smoothing
[adx, diPlus, diMinus] = ta.dmi(adxLength, adxSmoothing)

// === 📊 CONDIZIONI LONG E SHORT ===
// ✅ Long: EMA Veloce incrocia EMA Lenta al rialzo, RSI sotto 70, ADX > 20
longCondition = (ta.crossover(emaFast, emaSlow)) and (rsi < rsiOverbought) and (adx > adxThreshold)

// 🔻 Short: EMA Veloce incrocia EMA Lenta al ribasso, RSI sopra 30, ADX > 20
shortCondition = (ta.crossunder(emaFast, emaSlow)) and (rsi > rsiOversold) and (adx > adxThreshold)

// 📉 Stop Loss e Take Profit Dinamici
longStop = strategy.position_avg_price - (atr * stopATR)
longTarget = strategy.position_avg_price + (atr * takeProfitATR)

shortStop = strategy.position_avg_price + (atr * stopATR)
shortTarget = strategy.position_avg_price - (atr * takeProfitATR)

// === 🚀 INGRESSO E USCITA ===
// 🚦 Ingresso LONG
if (longCondition and strategy.position_size == 0)
    strategy.entry("Long", strategy.long)
    strategy.exit("TakeProfit/StopLoss Long", stop=longStop, limit=longTarget)

// 🚦 Ingresso SHORT
if (shortCondition and strategy.position_size == 0)
    strategy.entry("Short", strategy.short)
    strategy.exit("TakeProfit/StopLoss Short", stop=shortStop, limit=shortTarget)

// 🛑 USCITA MANUALE BASATA SU RSI
if (rsi > rsiOverbought and strategy.position_size > 0)
    strategy.close("Long", comment="RSI Overbought Exit")

if (rsi < rsiOversold and strategy.position_size < 0)
    strategy.close("Short", comment="RSI Oversold Exit")

// === 📊 VISUALIZZAZIONE GRAFICA OTTIMIZZATA ===

// 📈 MEDIE MOBILI ANCORATE ALLE CANDELE
plot(emaFast, title="EMA Veloce", color=color.blue, linewidth=2)
plot(emaSlow, title="EMA Lenta", color=color.red, linewidth=2)

// 📊 SEGNALI VISIVI ANCORATI ALLE CANDELE
plotshape(longCondition, title="Segnale Long", style=shape.triangleup, location=location.belowbar, color=color.green, text="Long", size=size.small)
plotshape(shortCondition, title="Segnale Short", style=shape.triangledown, location=location.abovebar, color=color.red, text="Short", size=size.small)

// 📊 RSI (Pannello Separato)
var float rsiPanel = na
rsiPanel := rsi
plot(rsiPanel, title="RSI", color=color.orange, linewidth=2)
hline(rsiOverbought, "RSI Overbought", color=color.red, linestyle=hline.style_dotted)
hline(rsiOversold, "RSI Oversold", color=color.green, linestyle=hline.style_dotted)

// 📊 ADX (Pannello Separato)
var float adxPanel = na
adxPanel := adx
plot(adxPanel, title="ADX", color=color.blue, linewidth=2)
hline(adxThreshold, "ADX Soglia", color=color.gray, linestyle=hline.style_dotted)

// 📊 ATR (Pannello Separato)
var float atrPanel = na
atrPanel := atr
plot(atrPanel, title="ATR", color=color.purple, linewidth=2)

// 🔔 ALERT
alertcondition(longCondition, title="Segnale Long", message="Entra Long Manualmente!")
alertcondition(shortCondition, title="Segnale Short", message="Entra Short Manualmente!")
- Volumenbasierte dynamische DCA-Strategie
- RSI-Momentum und ADX-Strength-Trend-basiertes Kapitalmanagementsystem
- Verstärkte dynamische mehrjährige Anpassungsentwicklung nach Handelssystem
- Dynamische Long/Short-Swing-Handelsstrategie mit gleitendem Durchschnitts-Crossover-Signalsystem
- Multiperiodische EMA-Crossover mit RSI-Impuls und ATR-Volatilitäts-basierter Tendenz nach Strategie
- Multi-Timeframe Trend Following Trading System mit ATR- und MACD-Integration
- Multidimensionales Anomalien-Strategie-Analyse-System für Gold Freitag
- Doppel-EMA-Crossover mit RSI-Momentum-Verstärkter Handelsstrategie
- Dynamischer Trend nach Strategie, die Supertrend und EMA kombiniert
- Multi-RSI-EMA-Momentum-Hedging-Strategie mit Skalierung von Positionen
- Synergistisches Handelssystem für mehrere technische Indikatoren
- Triple Supertrend und exponentieller gleitender Durchschnittstrend nach quantitativer Handelsstrategie
- Cloud-basierte Bollinger-Bänder Doppel gleitender Durchschnitt Quantitative Trendstrategie
- Mehrstufige quantitative Handelsstrategie auf der Grundlage der Trenddivergenz der Bollinger-Bänder
- Quantitative Handelsstrategie auf der Grundlage von Fibonacci 0,7-Level-Trend-Durchbruch
- Anpassungsfähige Handelsstrategie für mehrjährige Fractal-Breakout-Order
- Optimierte Strategie für das Risiko-Rendite-Verhältnis auf der Grundlage eines gleitenden Durchschnitts-Crossovers
- Anpassungstrend nach dynamischer Trenderkennungsstrategie
- Grenzüberschreitende dynamische Handelsstrategie auf Basis von Bollinger-Bändern
- Momentumbasierte SMI-Kreuzungs-Signal-Adaptive-Vorhersage-Strategie
- Mehrfach gleitender Durchschnitt Crossover Signal Erweiterte Handelsstrategie