Zwei-Perioden-RSI-Trendmomentum-Strategie mit Pyramiden-Positionsmanagementsystem
Schriftsteller:ChaoZhang, Datum: 2025-01-17 16:22:28Tags:RSI- Nein.

Übersicht
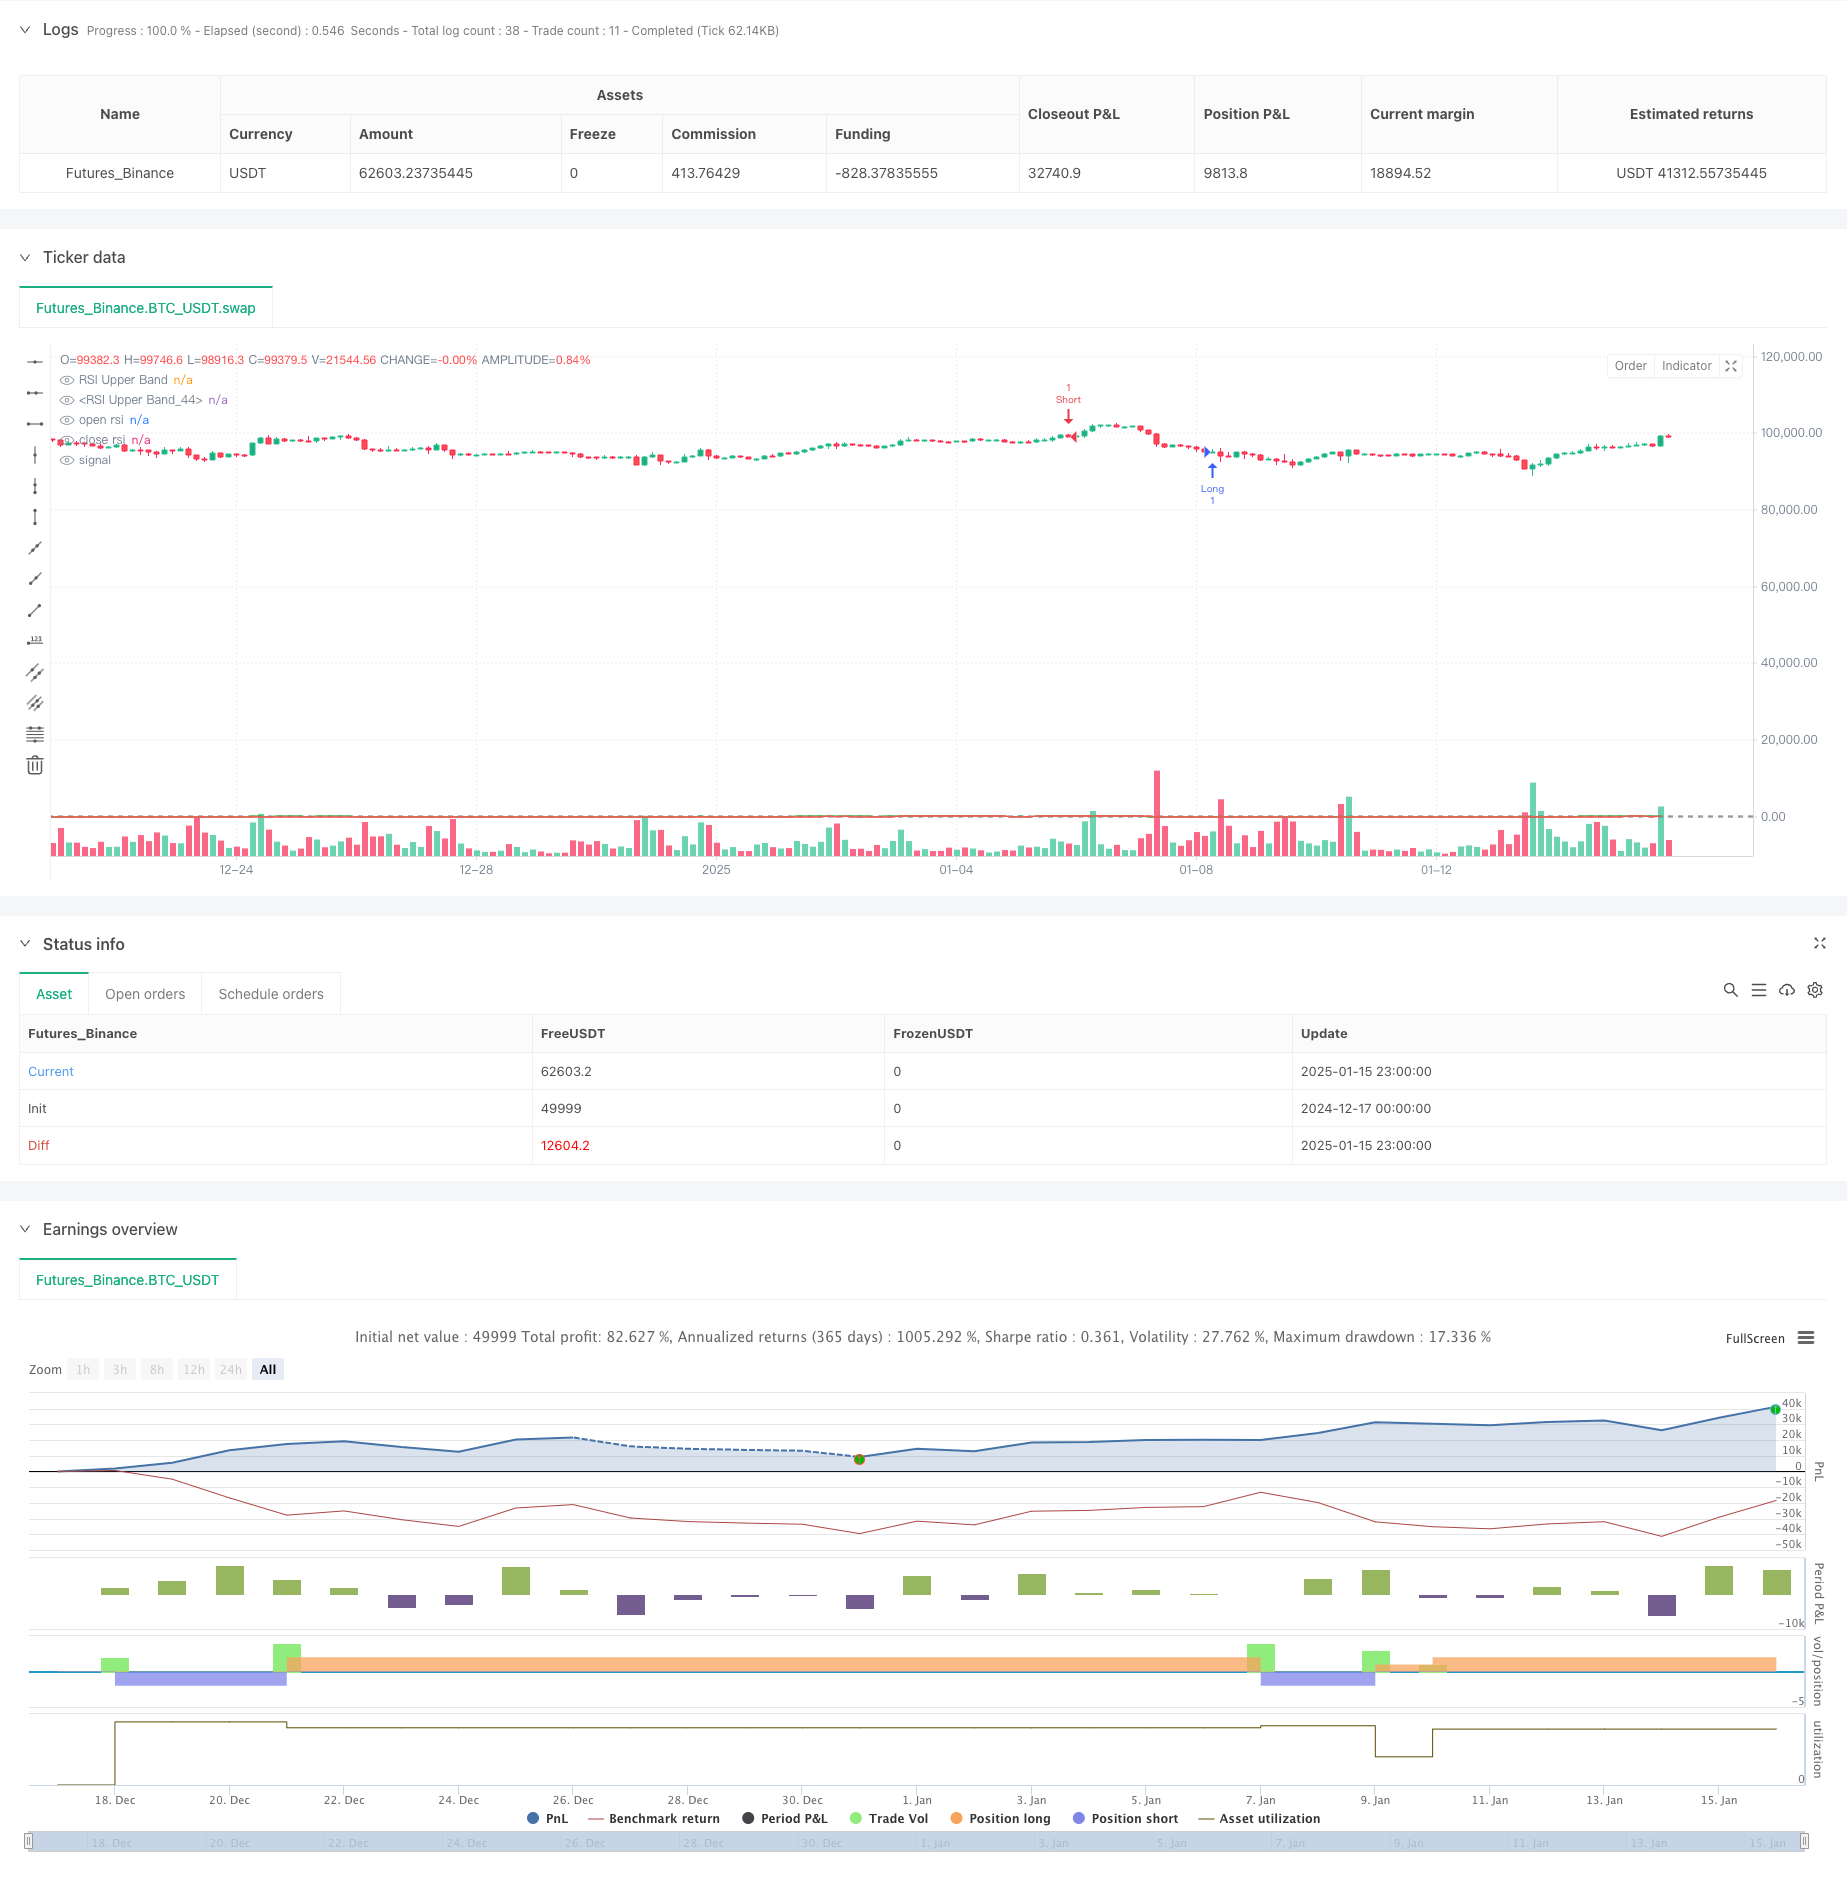
Diese Strategie ist ein Trend-Folgende Trading-System, das auf einem Dual-Periode-RSI (Relative Strength Index) basiert, kombiniert mit einem pyramidenförmigen Positionsmanagement. Die Strategie vergleicht RSI-Indikatoren aus zwei verschiedenen Perioden (14 und 30) um am Trendbeginn Trades einzugeben und fügt Positionen durch Limit-Orders während der Trendfortsetzung hinzu, um die Trend-Erfassung zu maximieren.
Strategieprinzip
Die Strategie verwendet dual-periodische RSI-Crossover-Signale als Trading-Trigger in Kombination mit Pyramiden-Positionsmanagement. 1. Einstiegssignale: Verwendet als Einstiegssignale den 14-Perioden-RSI-Durchbruch von Überverkauft (30) und Übergekauft (70) 2. Positionszuschlag: Implementiert die sekundäre Positionszuschlag durch Limit-Orders, die nach dem ersten Eintrag bei einer 1,5%igen Preisdifferenz festgelegt werden. 3. Exit-Signale: Verwendet den 30-Perioden-RSI als Exit-Indikator und löst Schließung aus, wenn der RSI aus Überkauf oder Erholung von Überverkaufszonen fällt 4. Positionssteuerung: Das System erlaubt maximal zwei Positionen (pyramide = 2) mit unabhängig konfigurierbaren Eingangsmengen
Strategische Vorteile
- Starke Trendfassung: Bessere Ermittlung und Verfolgung von mittelfristigen bis langfristigen Trends durch Doppelzeit-RSI-Koordination
- Optimiertes Risiko-Rendite-Verhältnis: Verwendet eine Pyramidenstrategie, um die Rendite nach der Trendbestätigung zu erhöhen
- Flexible Positionsverwaltung: Anpassungsfähiger Einstieg und zusätzliche Positionsgrößen auf der Grundlage von Marktbedingungen und Kapital
- Dynamisches Stop-Loss-Design: Verwendet den langfristigen RSI als Exit-Indikator, um vorzeitige Exits zu vermeiden
- Starke Anpassungsfähigkeit der Parameter: Die wichtigsten Parameter können für verschiedene Marktmerkmale optimiert werden
Strategische Risiken
- Das Risiko eines unsicheren Marktes: Kann durch häufigen Handel auf Märkten mit Bandbreiteverlust entstehen
- Slipperrisiko: Zusätzliche Positionsbestellungen mit Limit-Orders können in volatilen Märkten den optimalen Eintrittszeitpunkt verfehlen
- Kapitalverwaltungsrisiko: Doppelpositionen können zu erheblichen Rücknahmen führen
- Trendumkehrrisiko: Die inhärente Verzögerung des RSI-Indikators kann die Stop-Loss-Ausführung bei Trendumkehrungen verzögern.
- Risiko der Optimierung von Parametern: Überoptimierung kann zu schlechten Ergebnissen im realen Handel führen
Strategieoptimierungsrichtlinien
- Einführung von Trendfiltern: Hinzufügen von gleitenden Durchschnitten oder ADX-Indikatoren zur Verbesserung der Zuverlässigkeit des Eingangssignals
- Optimierung des Positionsmanagements: Entwicklung eines dynamischen Positionsgrößerungssystems auf der Grundlage von Volatilität
- Verbesserung des Stop-Loss-Mechanismus: Überlegen Sie, Trailing-Stops oder ATR-basierte Stop-Loss-Lösungen hinzuzufügen
- Hinzufügen von Filtern für das Marktumfeld: Einbeziehung von Volatilitätsindikatoren zur Anpassung von Strategieparametern unter unterschiedlichen Marktbedingungen
- Verbesserte Positionszusatzlogik: Dynamische Anpassung der Kursunterschiede aufgrund der Volatilität
Zusammenfassung
Die Strategie erzielt eine effektive Trend-Erfassung durch die Kombination von Dual-Periode-RSI und Pyramiden-Positionen. Sie implementiert ein komplettes Handelssystem, einschließlich Eintritts-, Positionszusatz-, Stop-Loss- und Positionsmanagement-Elemente. Durch Parameteroptimierung und Risikomanagementverbesserungen verspricht die Strategie eine stabile Performance im tatsächlichen Handel. Händlern wird empfohlen, die Parameter vor der Live-Implementierung gründlich zu testen und an bestimmte Marktmerkmale anzupassen.
/*backtest
start: 2024-12-17 00:00:00
end: 2025-01-16 00:00:00
period: 3h
basePeriod: 3h
exchanges: [{"eid":"Futures_Binance","currency":"BTC_USDT","balance":49999}]
*/

//@version=5
strategy("RSI Top Strategy", overlay=true, pyramiding=2)

qty1 = input( 1 , "Qty first entry", group="Strategy settings")
qty2 = input( 1 , "Qty second entry", group="Strategy settings")
avg1 = input.float( 1.5 , "% averaging ", group="Strategy settings")

overSold = input( 30 , group="open RSI Settings")
overBought = input( 70 , group="open RSI Settings")
rsi1len = input.int(14, minval=1, title="open RSI Length", group="open RSI Settings")

overSold2 = input( 30 , group="close RSI Settings")
overBought2 = input( 70 , group="close RSI Settings")
rsi2len = input.int(30, minval=1, title="close RSI Length", group="close RSI Settings")

price = close
vrsi = ta.rsi(price, rsi1len)
vrsi2 = ta.rsi(price, rsi2len)

sz=strategy.position_size

co = ta.crossover(vrsi, overSold)
cu = ta.crossunder(vrsi, overBought)
if (not na(vrsi))
	if (co) and not (sz>0)
		strategy.entry("Long", strategy.long, qty = qty1, comment="Long")
		Avgl=close-close*0.01*avg1
		strategy.entry("AvgL", strategy.long, qty = qty2, limit=Avgl, comment="AvgL")
	if (cu) and not (sz<0)
		strategy.entry("Short", strategy.short, qty = qty1, comment="Short")
		Avgs=close+close*0.01*avg1
		strategy.entry("AvgS", strategy.short, qty = qty2, limit=Avgs, comment="AvgS")
//plot(strategy.equity, title="equity", color=color.red, linewidth=2, style=plot.style_areabr)

if sz[1]<0 and sz<0 and vrsi2<overBought2 and vrsi2[1]>=overBought2
    strategy.close_all("x")
if sz[1]>0 and sz>0 and vrsi2>overSold2  and vrsi2[1]<=overSold2
    strategy.close_all("x")

plot(vrsi,'open rsi',color=color.green)
plot(vrsi2,'close rsi',color=color.red)

hline(overBought, "RSI Upper Band", color=#787B86)
hline(overSold, "RSI Upper Band", color=#787B86)
- Momentum-Trend Ichimoku Cloud-Handelsstrategie
- Mehrfachbestätigung Umkehrung Kaufstrategie
- Erweiterte dynamische Fibonacci-Retracement-Trend-Quantitative Handelsstrategie
- Beste TradingView-Strategie
- Die RSI-Dynamik ist eine dynamische Anziehungs-Stop-Loss-Strategie.
- Bei der Berechnung der Vermögenswerte für die Berechnung der Vermögenswerte für die Berechnung der Vermögenswerte für die Berechnung der Vermögenswerte für die Berechnung der Vermögenswerte für die Berechnung der Vermögenswerte für die Berechnung der Vermögenswerte für die Berechnung der Vermögenswerte
- Dynamische RSI-Überverkauft-Rebound-Handelsstrategie mit Stop-Loss-Optimierungsmodell
- Kurzfristige Handelsstrategie auf Basis von Bollinger-Bändern, gleitenden Durchschnitten und RSI
- Strategie für gleitende Durchschnittswerte und Relative Strength Index
- Trend des dynamischen Durchschnitts nach Strategie
- Dynamisches Doppelindikator-Strategie-System
- Mehrdimensionale Trendanalyse mit ATR-basierter dynamischer Stoppmanagementstrategie
- Anpassungsfähige Bollinger-Bänder - Handelsstrategie zur Umkehrung der Mittelwerte
- Erweiterte Trendbestätigungsstrategie mit mehreren Indikatoren
- Handelsstrategie für den Handel mit zwei gleitenden Durchschnitten-RSI-Mehrsignaltrend
- Anpassungsfähige Handelsstrategie nach Trend und Multi-Bestätigung
- Dynamisches EMA-System kombiniert mit RSI-Momentumsindikator für eine optimierte Intraday-Handelsstrategie
- Multi-Technischer Indikator Überschreitender Trend der Dynamik nach Strategie
- Dynamische Stop-Loss-Anpassung Elephant Bar Trend nach der Strategie
- Multi-Timeframe-Handelsstrategie, die Harmonische Muster und Williams-Prozess kombiniert
- EMA-Trend mit Rundzahl-Breakout-Handelsstrategie
- Dynamische RSI-Quantitative Handelsstrategie mit mehrfacher gleitender Durchschnittsverknüpfung
- Strategie zur Überschreitung des Dynamischen Trendindikators RSI
- Mehrdimensionaler KNN-Algorithmus mit Volumen-Preis-Candlestick-Pattern-Handelsstrategie
- Dual Crossover-Trend nach Strategie: EMA und MACD synergistisches Handelssystem
- SMA-basierte intelligente Trailing Stop-Strategie mit Intraday-Mustererkennung
- Adaptive Multi-Strategy Dynamic Switching System: Eine quantitative Handelsstrategie, die Trendverfolgung und Bereichsschwankungen kombiniert
- Erweiterte mehrindikatorische mehrdimensionale Quantifizierungsstrategie
- Quantitatives Handelssystem mit mehrfacher Regression und dynamischer Preisspanne