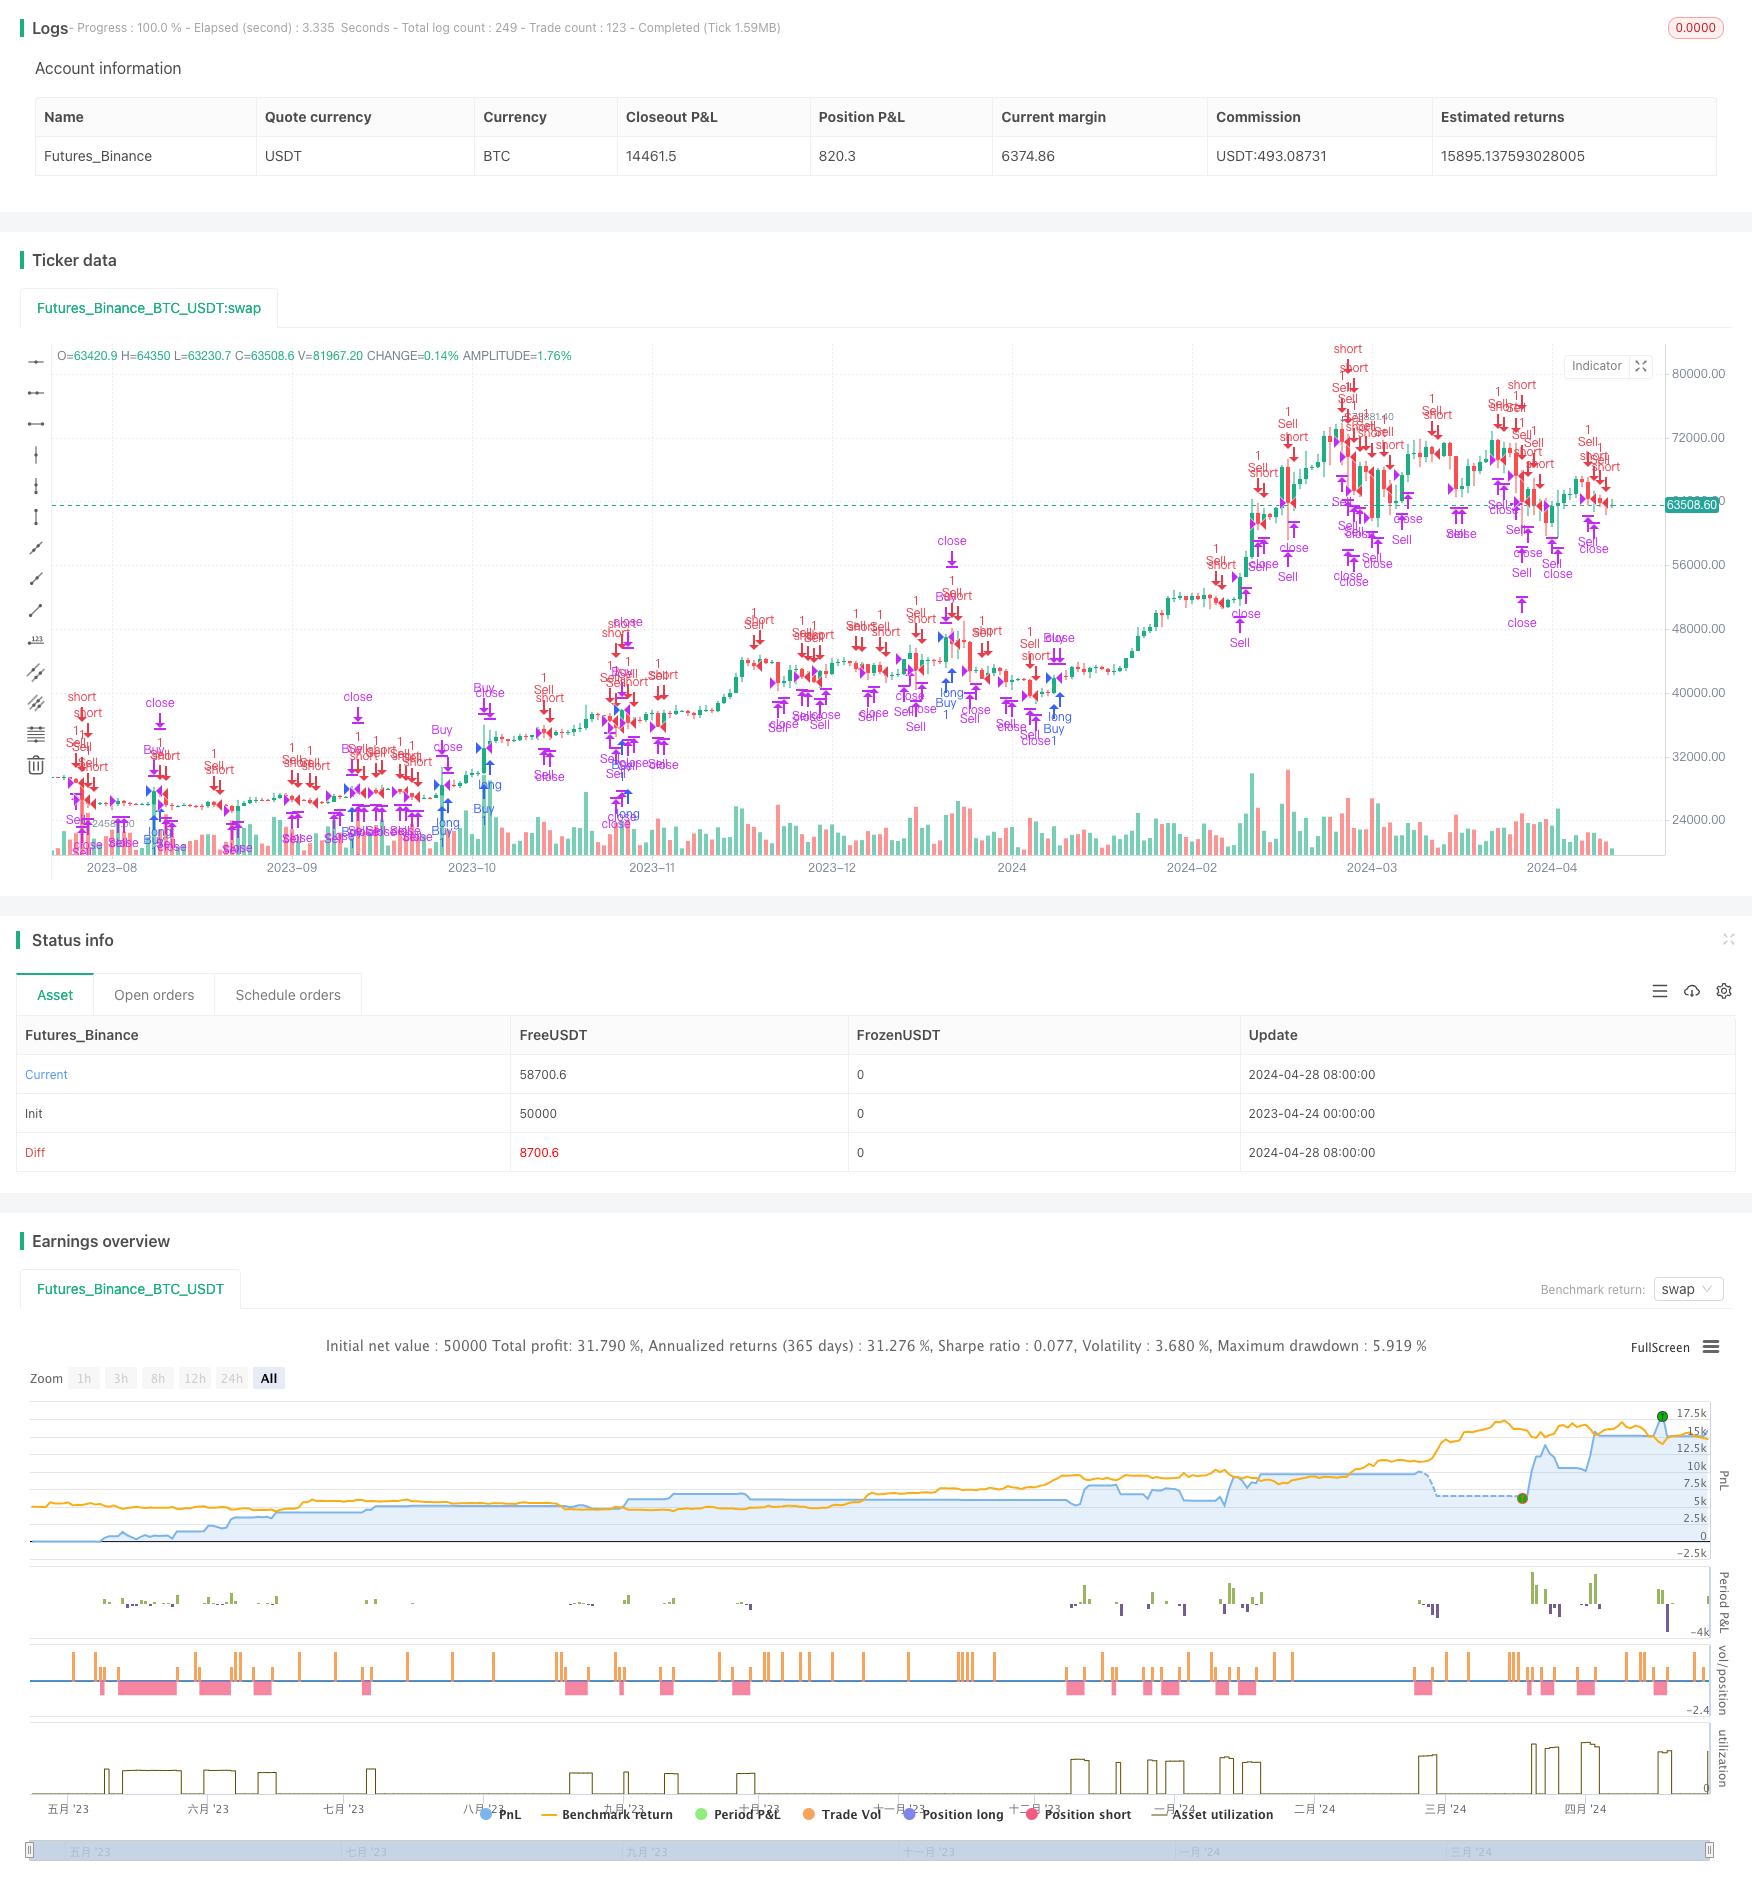
Overview
The RSI Direction Change Strategy is a trading strategy based on the Relative Strength Index (RSI) indicator. The strategy monitors changes in the RSI to determine shifts in market trends and executes buy, sell, and close orders based on the magnitude of RSI changes and price reversals. This strategy is primarily designed for commodity futures trading, aiming to capture opportunities arising from changes in market trends while achieving low-risk, high-return trading objectives.
Strategy Principles
The core of this strategy is to use the RSI indicator to determine changes in market trends. Specifically, the strategy follows these steps to execute trades:
- Calculate the value of the RSI indicator.
- Calculate the magnitude of change in the RSI indicator, which is the difference between the current RSI value and the previous RSI value.
- If the RSI change is greater than or equal to the predefined threshold (rsiChangeThreshold), execute a buy order.
- If the RSI change is less than or equal to the negative value of the predefined threshold, or if the price reversal magnitude is less than or equal to the predefined price reversal threshold (priceReverseThreshold), execute a sell order.
- If the absolute value of the RSI change is greater than or equal to the predefined exit threshold (rsiExitThreshold), execute a close order.
By following these steps, the strategy can promptly execute trading operations when significant changes in the RSI indicator occur, thereby capturing opportunities arising from shifts in market trends.
Strategy Advantages
- Simplicity: The strategy is based on the RSI indicator, which is simple and easy to understand, making it suitable for novice traders.
- Trend tracking: By monitoring changes in the RSI indicator, the strategy can promptly capture shifts in market trends, enabling trend-following trading.
- Risk control: The strategy incorporates multiple threshold parameters that can be adjusted according to market conditions and personal risk preferences, facilitating risk control.
- Wide applicability: Although primarily designed for commodity futures trading, the strategy can also be applied to other financial markets, such as stocks and forex.
Strategy Risks
- Parameter optimization risk: The strategy involves multiple threshold parameters, and if these parameters are not set properly, the strategy’s performance may be suboptimal. Therefore, parameter optimization based on market conditions and historical data is necessary.
- Market risk: The strategy primarily relies on the RSI indicator, and if the market experiences abnormal fluctuations or the RSI indicator becomes ineffective, the strategy may incur significant losses. Therefore, it is essential to combine other technical indicators and fundamental analysis to assess market trends.
- Overfitting risk: If the strategy parameters are over-optimized, the strategy may perform well in-sample but poorly out-of-sample. Therefore, out-of-sample testing and backtesting are necessary to verify the stability and reliability of the strategy.
Strategy Optimization Directions
- Incorporate additional technical indicators: Consider incorporating other technical indicators, such as MACD and Bollinger Bands, to improve the accuracy and reliability of the strategy.
- Optimize parameters: Use methods such as genetic algorithms and grid search to optimize the strategy parameters and find the optimal parameter combination.
- Add risk management modules: Consider adding risk management modules, such as stop-loss, take-profit, and position sizing, to control the strategy’s risk exposure.
- Adapt to different markets: Consider setting different parameters and trading rules for different markets and trading instruments to improve the strategy’s adaptability.
Summary
The RSI Direction Change Strategy is a simple, easy-to-understand, and widely applicable trading strategy. By monitoring changes in the RSI indicator, the strategy can capture opportunities arising from shifts in market trends and enable trend-following trading. However, the strategy also involves certain risks, such as parameter optimization risk, market risk, and overfitting risk. To further improve the strategy’s performance, consider incorporating additional technical indicators, optimizing parameters, adding risk management modules, and adapting to different markets. Overall, the RSI Direction Change Strategy is a trading strategy worth trying and optimizing.
/*backtest
start: 2023-04-24 00:00:00
end: 2024-04-29 00:00:00
period: 1d
basePeriod: 1h
exchanges: [{"eid":"Futures_Binance","currency":"BTC_USDT"}]
*/

//@version=5
strategy("RSI Direction Change Strategy", shorttitle="RSI Direction Change", overlay=true)

// Input variables
rsiLength = input(14, title="RSI Length")
rsiChangeThreshold = input(10, title="RSI Change Threshold")
rsiExitThreshold = input(5, title="RSI Exit Threshold")
priceReverseThreshold = input(1, title="Price Reverse Threshold (%)")

// Calculate RSI
rsi = ta.rsi(close, rsiLength)

// Calculate RSI change
rsiChange = rsi - rsi[1]

// Buy condition: RSI change is greater than the threshold
buyCondition = rsiChange >= rsiChangeThreshold

// Sell condition: RSI change is less than the negative threshold or price reverses by 1 percent
sellCondition = rsiChange <= -rsiChangeThreshold or ((close - close[1]) / close[1] * 100) <= -priceReverseThreshold

// Exit condition: RSI change reverses direction by the exit threshold
exitCondition = (rsiChange >= 0 ? rsiChange : -rsiChange) >= rsiExitThreshold

// Execute buy order
strategy.entry("Buy", strategy.long, when=buyCondition)
// Execute sell order
strategy.entry("Sell", strategy.short, when=sellCondition)
// Execute exit order
strategy.close("Buy", when=exitCondition or sellCondition)
strategy.close("Sell", when=exitCondition or buyCondition)