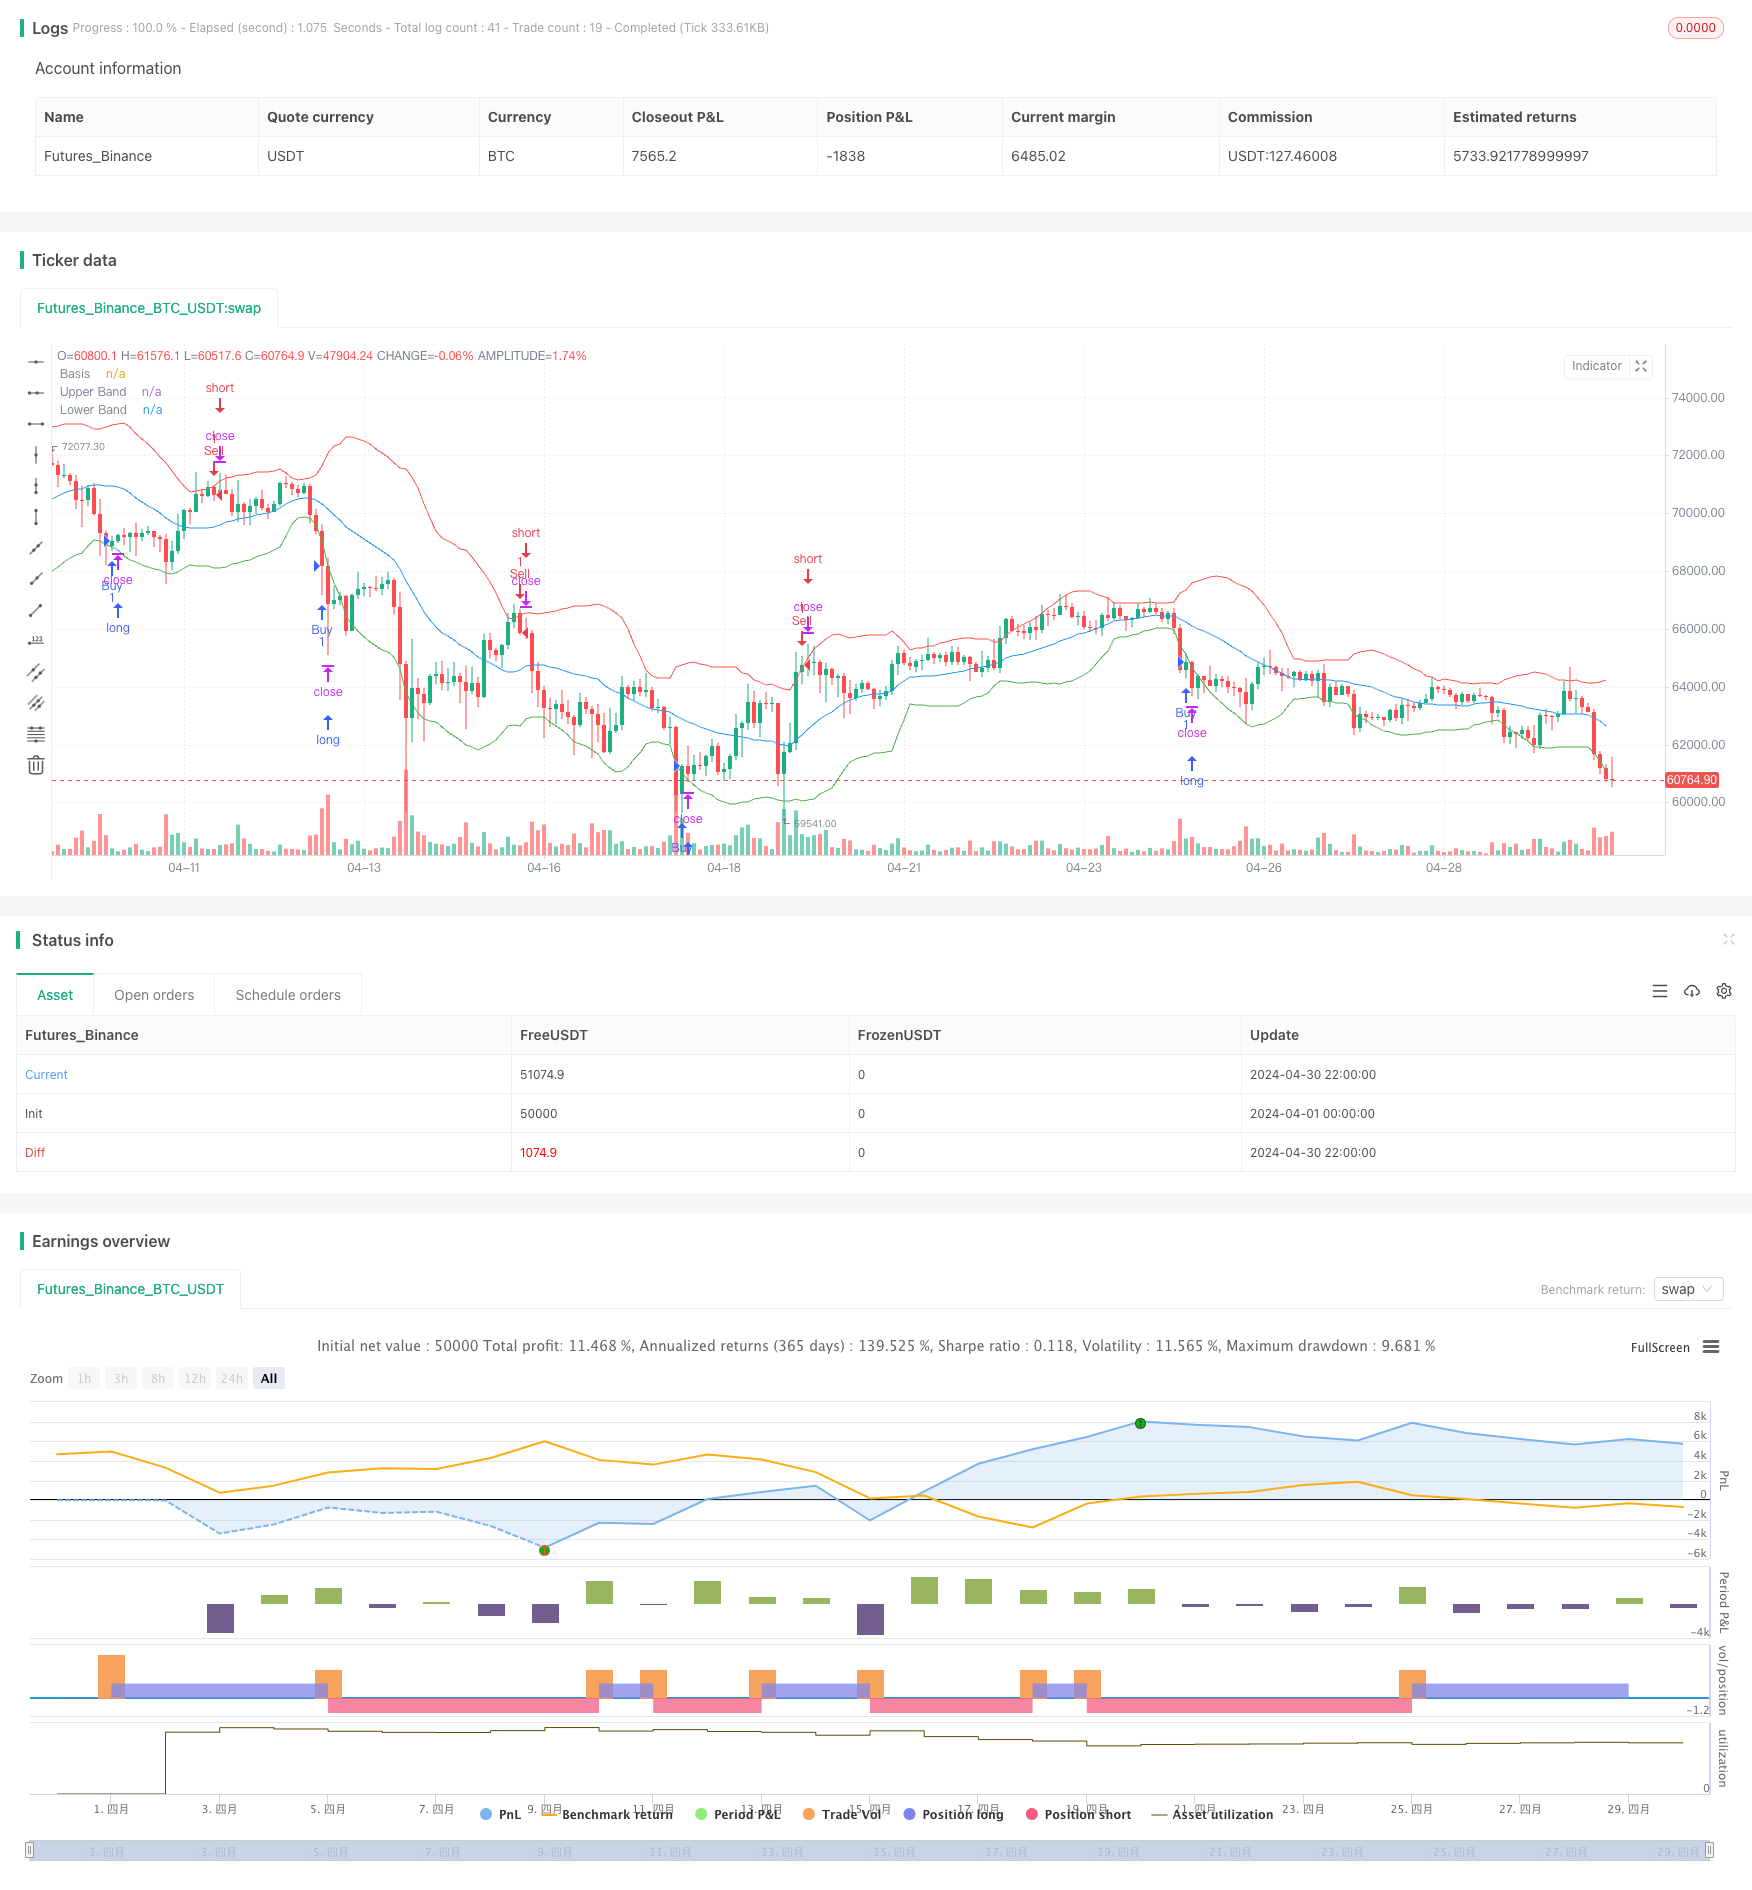
Reverse Volatility Breakout Strategy
Author: ChaoZhang, Date: 2024-05-17 15:18:53Tags: ATRBBRSIMACD

Overview
The Reverse Volatility Breakout Strategy is a reversal trading strategy that utilizes multiple technical indicators such as ATR, Bollinger Bands, RSI, and MACD to identify extreme market conditions and execute trades when reversal signals appear. Unlike traditional breakout strategies, this strategy sells when bullish signals occur and buys when bearish signals occur, attempting to capture market reversal opportunities.
Strategy Principle
The strategy uses the following indicators to determine trading signals: 1. ATR (Average True Range): Measures market volatility. 2. Bollinger Bands: Consists of a middle band, upper band, and lower band, reflecting price volatility range. 3. RSI (Relative Strength Index): Measures the momentum of price movements. 4. MACD (Moving Average Convergence Divergence): Consists of MACD line and signal line, used to determine trends.
The core logic of the strategy is as follows: - When the closing price breaks above the upper Bollinger Band, RSI is above 50, and the MACD line is above the signal line, a sell signal is generated. - When the closing price breaks below the lower Bollinger Band, RSI is below 50, and the MACD line is below the signal line, a buy signal is generated.
Strategy Advantages
- Combines multiple technical indicators to improve the reliability of trading signals.
- The reverse trading approach can profit when the market reverses.
- Suitable for highly volatile market conditions.
Strategy Risks
- Reverse trading may face higher risks as it goes against the mainstream trend.
- If the market continues in a unilateral trend, the strategy may generate consecutive losses.
- Improper parameter settings may lead to invalid trading signals.
Strategy Optimization Directions
- Optimize indicator parameters to find the most suitable combination for the current market.
- Introduce stop-loss and take-profit mechanisms to control single-trade risk.
- Incorporate other indicators or market sentiment data to improve the accuracy of trading signals.
- Filter trading signals to avoid frequent trades and false signals.
Summary
The Reverse Volatility Breakout Strategy is an interesting attempt that utilizes multiple technical indicators to capture extreme market conditions and execute reverse trades when reversal signals appear. However, this strategy also carries certain risks and needs to be applied cautiously. By optimizing indicator parameters, introducing risk control measures, and combining other analysis methods, the robustness and profitability of this strategy can be further improved.
/*backtest
start: 2024-04-01 00:00:00
end: 2024-04-30 23:59:59
period: 2h
basePeriod: 15m
exchanges: [{"eid":"Futures_Binance","currency":"BTC_USDT"}]
*/

//@version=5
strategy("Volatility Breakout Strategy (Reversed)", overlay=true)

// Indicator Inputs
atrLength = input(14, "ATR Length")
bbLength = input(20, "Bollinger Bands Length")
bbMultiplier = input(2, "Bollinger Bands Multiplier")
rsiLength = input(14, "RSI Length")
macdShortLength = input(12, "MACD Short Length")
macdLongLength = input(26, "MACD Long Length")
macdSignalSmoothing = input(9, "MACD Signal Smoothing")

// Calculate Indicators
atrValue = ta.atr(atrLength)
basis = ta.sma(close, bbLength)
deviation = bbMultiplier * ta.stdev(close, bbLength)
upperBand = basis + deviation
lowerBand = basis - deviation
rsiValue = ta.rsi(close, rsiLength)
[macdLine, signalLine, _] = ta.macd(close, macdShortLength, macdLongLength, macdSignalSmoothing)

// Strategy Conditions (Reversed)
longCondition = ta.crossover(close[1], upperBand[1]) and rsiValue > 50 and macdLine > signalLine
shortCondition = ta.crossunder(close[1], lowerBand[1]) and rsiValue < 50 and macdLine < signalLine

// Strategy Entry (Reversed)
if (longCondition)
    strategy.entry("Sell", strategy.short)  // Reversed: Buy signal triggers a sell
if (shortCondition)
    strategy.entry("Buy", strategy.long)  // Reversed: Sell signal triggers a buy

// Plotting
plot(basis, color=color.blue, title="Basis")
plot(upperBand, color=color.red, title="Upper Band")
plot(lowerBand, color=color.green, title="Lower Band")
- Multi-Technical Indicator Dynamic Adaptive Trading Strategy (MTDAT)
- Multi-Trend Momentum Crossover Strategy with Volatility Optimization System
- No Upper Wick Bullish Candle Breakout Strategy
- Multi-Indicator Dynamic Stop-Loss Momentum Trend Trading Strategy
- Multi-Indicator Trend Momentum Trading Strategy: An Optimized Quantitative Trading System Based on Bollinger Bands, Fibonacci and ATR
- RSI-Bollinger Bands Integration Strategy: A Dynamic Self-Adaptive Multi-Indicator Trading System
- Super Triple Indicator RSI-MACD-BB Momentum Reversal Strategy
- Multi-Indicator Intelligent Pyramiding Strategy
- Adaptive Oscillation Trend Trading Strategy with Bollinger Bands and RSI Integration
- Mean Reversion Strategy with Bollinger Bands, RSI and ATR-Based Dynamic Stop-Loss System
- Dynamic Trend Momentum Trading Strategy
- EMA Crossover with Short-term Signals Strategy
- Ichimoku Cloud and ATR Strategy
- BONK Multi-Factor Trading Strategy
- Dual Moving Average Crossover Strategy
- HalfTrend Bullish and Bearish Trend Following Stop-Limit Buy Strategy
- Alligator Long-Term Trend Following Trading Strategy
- Multi-timeframe Trend Tracking Strategy Based on Impulse MACD and Dual Moving Average Crossover
- EMA5 and EMA13 Crossover Strategy
- EMA SAR Medium-to-Long-Term Trend Following Strategy
- Nifty 50 3-Minute Opening Range Breakout Strategy
- Dynamic Stop Loss and Take Profit Bollinger Bands Strategy
- Improved Swing High/Low Breakout Strategy with Bullish and Bearish Engulfing Patterns
- Laguerre RSI with ADX Filtered Trading Signals Strategy
- Price and Volume Breakout Buy Strategy
- K Consecutive Candles Bull Bear Strategy
- Super Moving Average and Upperband Crossover Strategy
- Multi-factor Trend Following Quantitative Trading Strategy Based on RSI, ADX, and Ichimoku Cloud
- RSI and MACD Combined Long-Short Strategy
- Ichimoku Cloud and Moving Average Strategy