Overview
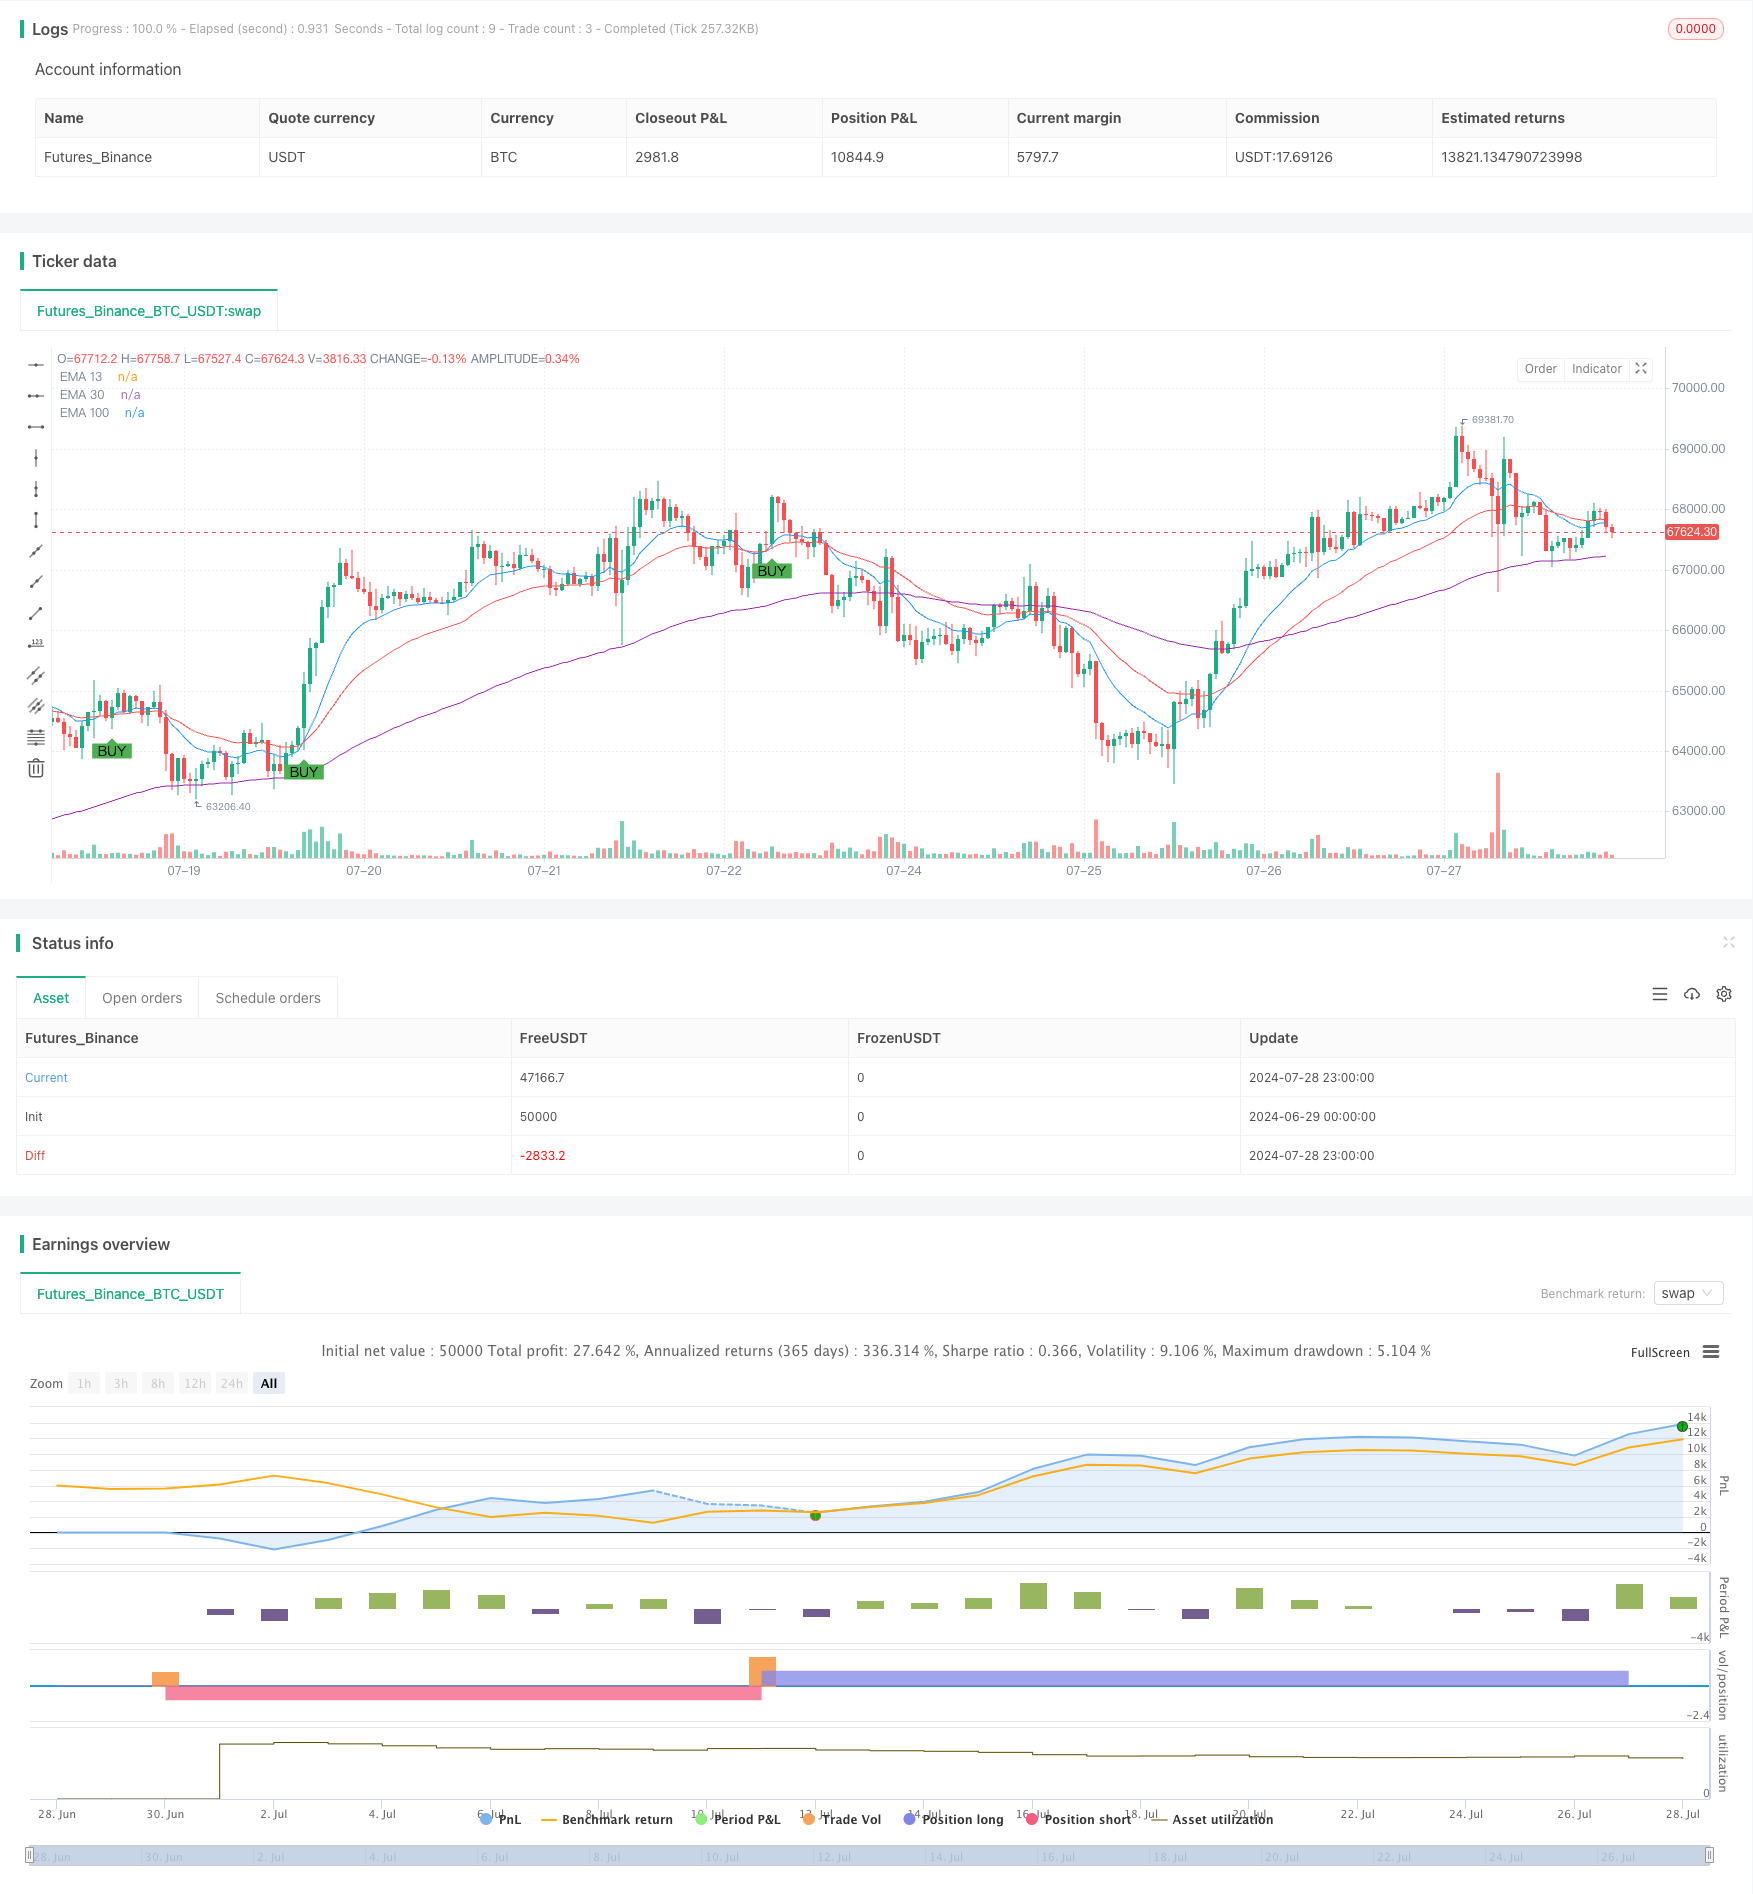
This article introduces the “Multi-EMA Crossover Momentum Strategy,” a quantitative trading strategy based on technical analysis. The strategy utilizes the crossover relationships between 13-period, 30-period, and 100-period Exponential Moving Averages (EMAs) to generate buy and sell signals. This strategy aims to capture market trend changes while reducing the risk of false breakouts by combining multiple timeframes.
Strategy Principle
The core principle of this strategy is to use the crossover relationships between EMAs of different periods to determine changes in market trends. Specifically:
- Buy Condition: A buy signal is triggered when the 13-period EMA crosses above the 30-period EMA, and both are above the 100-period EMA.
- Sell Condition: A sell signal is triggered when the 13-period EMA crosses below the 30-period EMA, and both are below the 100-period EMA.
This design utilizes a combination of short-term, medium-term, and long-term moving averages to confirm strong trend changes. The 13-period EMA represents the short-term trend, the 30-period EMA represents the medium-term trend, and the 100-period EMA represents the long-term trend. When all three moving averages confirm a trend simultaneously, the strategy considers that a significant change in market direction has occurred.
Strategy Advantages
Multi-timeframe confirmation: By combining short-term, medium-term, and long-term EMAs, the strategy can more accurately identify genuine trend changes and reduce false signals.
Trend following: The strategy design aligns with the trading philosophy of “the trend is your friend,” helping to capture profits from major trends.
Objectivity: The strategy is entirely based on mathematical calculations and clear rules, eliminating biases from subjective judgment.
Adaptability: EMAs are more sensitive to recent price changes, allowing the strategy to adapt quickly to market changes.
Risk management: By requiring confirmation from multiple timeframes, the strategy has built-in risk control mechanisms.
Visualization: The strategy displays buy and sell signals intuitively on the chart, allowing traders to quickly understand market conditions.
Strategy Risks
Lag: As lagging indicators, EMAs may give signals after a trend has already begun, potentially missing out on some profits.
Poor performance in ranging markets: In sideways, choppy markets, the strategy may frequently generate false signals, leading to excessive trading and losses.
False breakout risk: Although a multi-confirmation mechanism is used, false breakout signals may still occur under certain market conditions.
Over-reliance on technical indicators: The strategy completely ignores fundamental factors and may perform poorly when significant news or events impact the market.
Parameter sensitivity: The choice of EMA periods can significantly affect strategy performance, requiring careful parameter optimization.
Strategy Optimization Directions
Incorporate momentum indicators: Consider combining RSI or MACD to further confirm trend strength and reduce false signals.
Implement stop-loss mechanisms: Add trailing stops or fixed stop-loss points to limit maximum losses per trade.
Optimize parameter selection: Conduct historical data backtesting to find the optimal EMA period combination for improved performance across different market environments.
Add volume analysis: Consider using volume as a supplementary indicator to help confirm trend authenticity and sustainability.
Implement adaptive parameters: Develop a mechanism to dynamically adjust EMA periods, allowing the strategy to automatically optimize parameters based on market volatility.
Introduce market regime recognition: Add market state (trend/range) identification to apply different trading logic in various market conditions.
Multi-timeframe analysis: Extend the strategy to consider more timeframes, such as combining daily and weekly charts, for a more comprehensive market perspective.
Summary
The “Multi-EMA Crossover Momentum Strategy” is a quantitative trading method that combines short-term, medium-term, and long-term market trends. By utilizing the crossover relationships of 13, 30, and 100-period EMAs, the strategy aims to capture significant trend changes. Its strength lies in the multi-timeframe confirmation mechanism, which helps reduce false signals and capture major trends. However, the strategy also faces risks such as lag and poor performance in ranging markets.
To further enhance the strategy’s effectiveness, consider incorporating momentum indicators, optimizing parameter selection, and adding stop-loss mechanisms. Additionally, integrating volume analysis and market state recognition could significantly improve the strategy’s robustness and adaptability.
Overall, this is a relatively simple but potentially powerful strategy framework. With careful optimization and personalization, it has the potential to become a reliable trading tool. However, traders should still exercise caution when using this strategy and combine it with other analysis methods and risk management techniques to ensure long-term trading success.
/*backtest
start: 2024-06-29 00:00:00
end: 2024-07-29 00:00:00
period: 1h
basePeriod: 15m
exchanges: [{"eid":"Futures_Binance","currency":"BTC_USDT"}]
*/

//@version=5
strategy("13, 30, 100 EMA Strategy with Rules", overlay=true)

// Define the EMA lengths
ema13_length = 13
ema30_length = 30
ema100_length = 100

// Calculate the EMAs
ema13 = ta.ema(close, ema13_length)
ema30 = ta.ema(close, ema30_length)
ema100 = ta.ema(close, ema100_length)

// Plot the EMAs
plot(ema13, color=color.blue, title="EMA 13")
plot(ema30, color=color.red, title="EMA 30")
plot(ema100, color=color.purple, title="EMA 100")

// Define buy and sell conditions
buyCondition = ta.crossover(ema13, ema30) and ema13 > ema100 and ema30 > ema100
sellCondition = ta.crossunder(ema13, ema30) and ema13 < ema100 and ema30 < ema100

// Generate buy and sell signals
if (buyCondition)
    strategy.entry("Buy", strategy.long)

if (sellCondition)
    strategy.close("Buy")
    strategy.entry("Sell", strategy.short)

// Plot buy and sell signals on the chart
plotshape(series=buyCondition, location=location.belowbar, color=color.green, style=shape.labelup, text="BUY")
plotshape(series=sellCondition, location=location.abovebar, color=color.red, style=shape.labeldown, text="SELL")