Elliott Wave and Tom DeMark Trend-Following Trading Strategy
Author: ChaoZhang, Date: 2024-07-31 11:38:39Tags: EMATDEWRSI
Overview
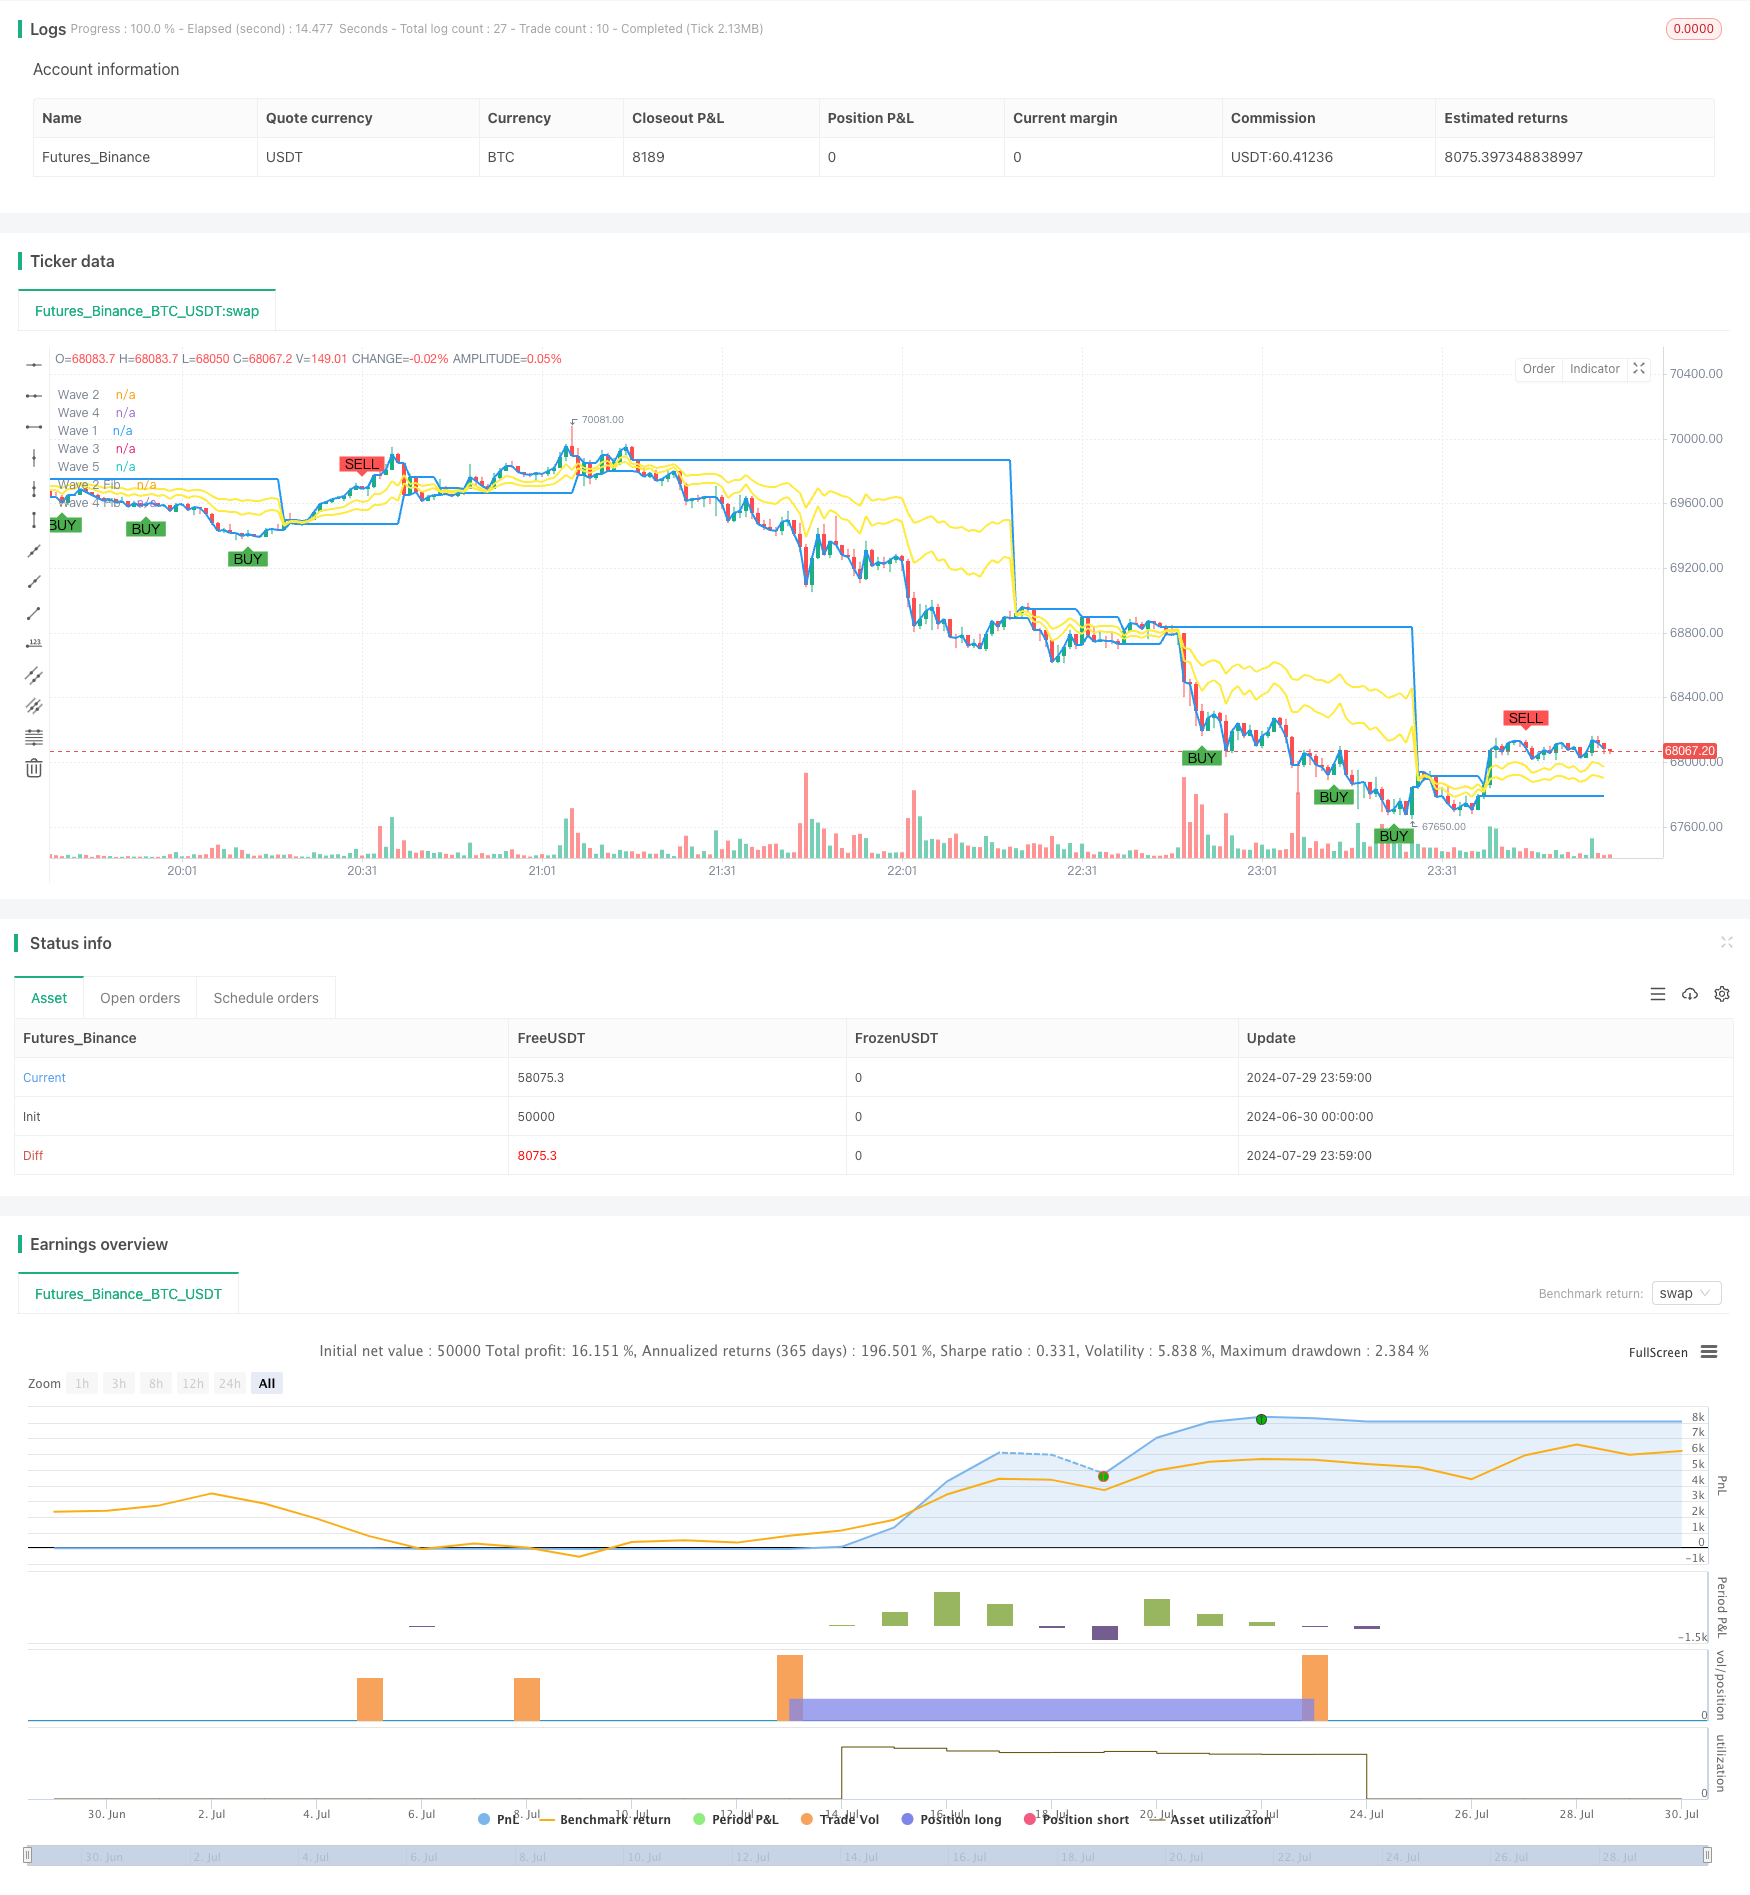
This strategy combines Elliott Wave Theory and Tom DeMark Sequential indicator to capture market trends and execute trades at opportune moments. It utilizes Exponential Moving Average (EMA) to identify waves and employs Fibonacci retracement levels to determine key support and resistance levels. Simultaneously, it uses the TD Sequential indicator to confirm trading signals, especially when three consecutive buy or sell signals occur. This approach attempts to enhance trading accuracy and profitability by integrating multiple indicators based on technical analysis.
Strategy Principles
Elliott Wave Identification:
- Uses a 21-period EMA as a baseline for wave identification.
- Marks the beginning of a new wave when price crosses the EMA.
- Records five main wave points: Wave 1, Wave 2, Wave 3, Wave 4, and Wave 5.
Fibonacci Retracement:
- Calculates 61.8% retracement level for Wave 2 and 38.2% retracement level for Wave 4.
- These levels are used to identify potential support and resistance areas.
TD Sequential Signals:
- Uses a default setting of 9 periods for TD Sequential.
- Forms a sell signal when price closes higher than the close 4 periods ago for 9 consecutive periods.
- Forms a buy signal when price closes lower than the close 4 periods ago for 9 consecutive periods.
Trade Signal Generation:
- Triggers a long signal when TD Sequential gives 3 consecutive buy signals and Wave 5 has formed.
- Triggers a short signal when TD Sequential gives 3 consecutive sell signals and Wave 5 has formed.
Stop Loss and Take Profit:
- Sets stop loss at Wave 1 and take profit at Wave 3 for long trades.
- Sets stop loss at Wave 4 and take profit at Wave 2 for short trades.
Strategy Advantages
Multi-indicator Integration: Combines Elliott Wave Theory and TD Sequential indicator, increasing signal reliability.
Trend Following: Effectively tracks market trends through wave identification and EMA use.
Risk Management: Provides a clear risk management framework using key wave points as stop loss and profit targets.
Signal Confirmation: Requires three consecutive identical signals from TD Sequential, reducing the impact of false signals.
Adaptability: Can be adapted to different market environments and trading instruments through parameter settings.
Objectivity: Based on clear technical indicators and rules, reducing bias from subjective judgment.
Strategy Risks
Over-reliance on Technical Indicators: May overlook fundamental factors in certain market conditions.
Lagging Nature: Both EMA and TD Sequential are lagging indicators, potentially leading to slow reactions to trend reversals.
False Breakouts: May generate multiple false breakout signals in range-bound markets, increasing trading costs.
Parameter Sensitivity: Strategy performance may be highly sensitive to the choice of EMA length and TD Sequential period.
Complexity: Combining multiple indicators may make the strategy complex, increasing the risk of overfitting.
Market Condition Dependency: May perform better in strong trend markets but potentially underperform in choppy markets.
Strategy Optimization Directions
Dynamic Parameter Adjustment:
- Implementation: Automatically adjust EMA length and TD Sequential period based on market volatility.
- Reason: Improve strategy adaptability to different market conditions.
Incorporate Volume Analysis:
- Implementation: Consider volume indicators in the signal generation process.
- Reason: Enhance trend confirmation reliability and reduce false breakouts.
Introduce Volatility Filter:
- Implementation: Reduce or pause trading during low volatility periods.
- Reason: Avoid frequent trading in range-bound markets, lowering costs.
Optimize Stop Loss Strategy:
- Implementation: Use dynamic stop losses, such as ATR (Average True Range) or volatility percentage stops.
- Reason: Better adapt to market volatility and protect profits.
Add Time Filtering:
- Implementation: Consider market time factors, avoiding high volatility periods.
- Reason: Reduce risks associated with trading during unfavorable time periods.
Multi-timeframe Analysis:
- Implementation: Confirm trend direction in higher timeframes before entering trades.
- Reason: Improve trade signal quality and reduce counter-trend trades.
Conclusion
The Elliott Wave and Tom DeMark Trend-Following Trading Strategy is a comprehensive technical analysis method that cleverly combines wave theory, trend following, and momentum indicators. By identifying waves through EMA, determining key price levels using Fibonacci retracements, and confirming trade signals with TD Sequential, this strategy aims to capture strong market trends.
The strategy’s main advantages lie in its multi-layered signal confirmation mechanism and clear risk management framework. However, it also faces challenges such as over-reliance on technical indicators and potential lag in signal generation. To optimize strategy performance, considerations can be given to introducing dynamic parameter adjustments, integrating volume analysis, and using volatility filters.
Overall, this strategy provides traders with a structured approach to analyzing and trading financial markets. However, like all trading strategies, it requires rigorous backtesting and continuous optimization in practical applications. Traders should adjust strategy parameters according to their risk tolerance and trading objectives, and always remain vigilant to market changes.
/*backtest
start: 2024-06-30 00:00:00
end: 2024-07-30 00:00:00
period: 1m
basePeriod: 1m
exchanges: [{"eid":"Futures_Binance","currency":"BTC_USDT"}]
*/

//@version=5
strategy("Elliott Wave and Tom DeMark Strategy", overlay=true)

// Tom DeMark Sequential Settings
td_length = input(9, title="TD Sequential Length")

// Tom DeMark Sequential
var int tdUpCount = 0
var int tdDownCount = 0

if close > close[4]
    tdUpCount := na(tdUpCount) ? 1 : tdUpCount + 1
    tdDownCount := 0
else if close < close[4]
    tdDownCount := na(tdDownCount) ? 1 : tdDownCount + 1
    tdUpCount := 0
else
    tdUpCount := 0
    tdDownCount := 0

tdBuySetup = (tdDownCount == td_length)
tdSellSetup = (tdUpCount == td_length)

plotshape(series=tdBuySetup, title="TD Buy Signal", location=location.belowbar, color=color.green, style=shape.labelup, text="BUY")
plotshape(series=tdSellSetup, title="TD Sell Signal", location=location.abovebar, color=color.red, style=shape.labeldown, text="SELL")

// Elliott Wave Settings
wave_length = input(21, title="EMA Length for Wave Identification")
ema = ta.ema(close, wave_length)
var int wave_trend = na

wave_trend := ta.crossover(close, ema) ? 1 : ta.crossunder(close, ema) ? -1 : nz(wave_trend[1])

var float wave1 = na
var float wave2 = na
var float wave3 = na
var float wave4 = na
var float wave5 = na

wave1 := ta.valuewhen(wave_trend == 1, close, 0)
wave2 := ta.valuewhen(wave_trend == -1, close, 0)
wave3 := ta.valuewhen(wave_trend == 1, close, 0)
wave4 := ta.valuewhen(wave_trend == -1, close, 0)
wave5 := ta.valuewhen(wave_trend == 1, close, 0)

fibonacciRetracement(level, waveStart, waveEnd) =>
    waveStart + (waveEnd - waveStart) * level

wave2Fib = fibonacciRetracement(0.618, wave1, wave2)
wave4Fib = fibonacciRetracement(0.382, wave3, wave4)

plot(wave1, title="Wave 1", color=color.blue, linewidth=2)
plot(wave2, title="Wave 2", color=color.blue, linewidth=2)
plot(wave3, title="Wave 3", color=color.blue, linewidth=2)
plot(wave4, title="Wave 4", color=color.blue, linewidth=2)
plot(wave5, title="Wave 5", color=color.blue, linewidth=2)

plot(wave2Fib, title="Wave 2 Fib", color=color.yellow, linewidth=2)
plot(wave4Fib, title="Wave 4 Fib", color=color.yellow, linewidth=2)

// Strategy Conditions
if (tdUpCount == td_length * 3 and not na(wave5))
    strategy.entry("Buy", strategy.long)

if (tdDownCount == td_length * 3 and not na(wave5))
    strategy.entry("Sell", strategy.short)

// Stop Loss and Take Profit
strategy.exit("Take Profit/Stop Loss", from_entry="Buy", limit=wave3, stop=wave1)
strategy.exit("Take Profit/Stop Loss", from_entry="Sell", limit=wave2, stop=wave4)
- Low finder
- Dual EMA RSI Momentum Trend Reversal Trading System - A Momentum Breakthrough Strategy Based on EMA and RSI Crossover
- EMA Bullish Crossover Strategy
- Dual EMA-RSI Divergence Strategy: A Trend Capture System Based on Exponential Moving Average and Relative Strength
- Dynamic Multi-Period Quantitative Trading Strategy Combining RSI and EMA
- Dual Exponential Moving Average and Relative Strength Index Crossover Strategy
- Dynamic Moving Average Trend Following with RSI Confirmation Trading Strategy
- crypto futures hourly scalping with ma & rsi - ogcheckers
- EMA, RSI, Volume-Price Trend, Engulfing Pattern
- Multi-Period RSI Momentum and Triple EMA Trend Following Composite Strategy
- Advanced Markov Model Technical Indicator Fusion Trading Strategy
- Multi-Layer Volatility Band Trading Strategy
- Multi-Period Moving Average Crossover Strategy with Dynamic Volatility Filter
- Multi-Indicator Comprehensive Momentum Trading Strategy
- Triple EMA with Dynamic Support/Resistance Trading Strategy
- Dual RSI Strategy: Advanced Trend Capture System Combining Divergence and Crossover
- Lorenzian Classification Multi-Timeframe Target Strategy
- Dual Moving Average Trend Capture Strategy with Dynamic Stop-Loss and Filter
- Multi-Indicator Trend Following with Volume Confirmation Strategy
- Adaptive Quantitative Trading Strategy with Dual Moving Average Crossover and Take Profit/Stop Loss
- Multi-Timeframe Unified Strategy Based on Quantitative Momentum and Convergence-Divergence
- RSI Oversold Periodic Investment Strategy with Cooldown Optimization
- Optimized Multi-Timeframe HMA Quantitative Trading Strategy with Dynamic Stop-Loss
- Bollinger Band Crossover with Slippage and Price Impact Combined Strategy
- Trend Structure Break with Order Block and Fair Value Gap Strategy
- Adaptive Dynamic Stop-Loss and Take-Profit Strategy with SMA Crossover and Volume Filter
- Dual MACD Trend Confirmation Trading System
- High/Low Breakout Strategy with Alpha Trend and Moving Average Filter
- Multi-Candlestick Pattern Recognition and Trading Strategy
- Multi-EMA Crossover Strategy with Trend Confirmation