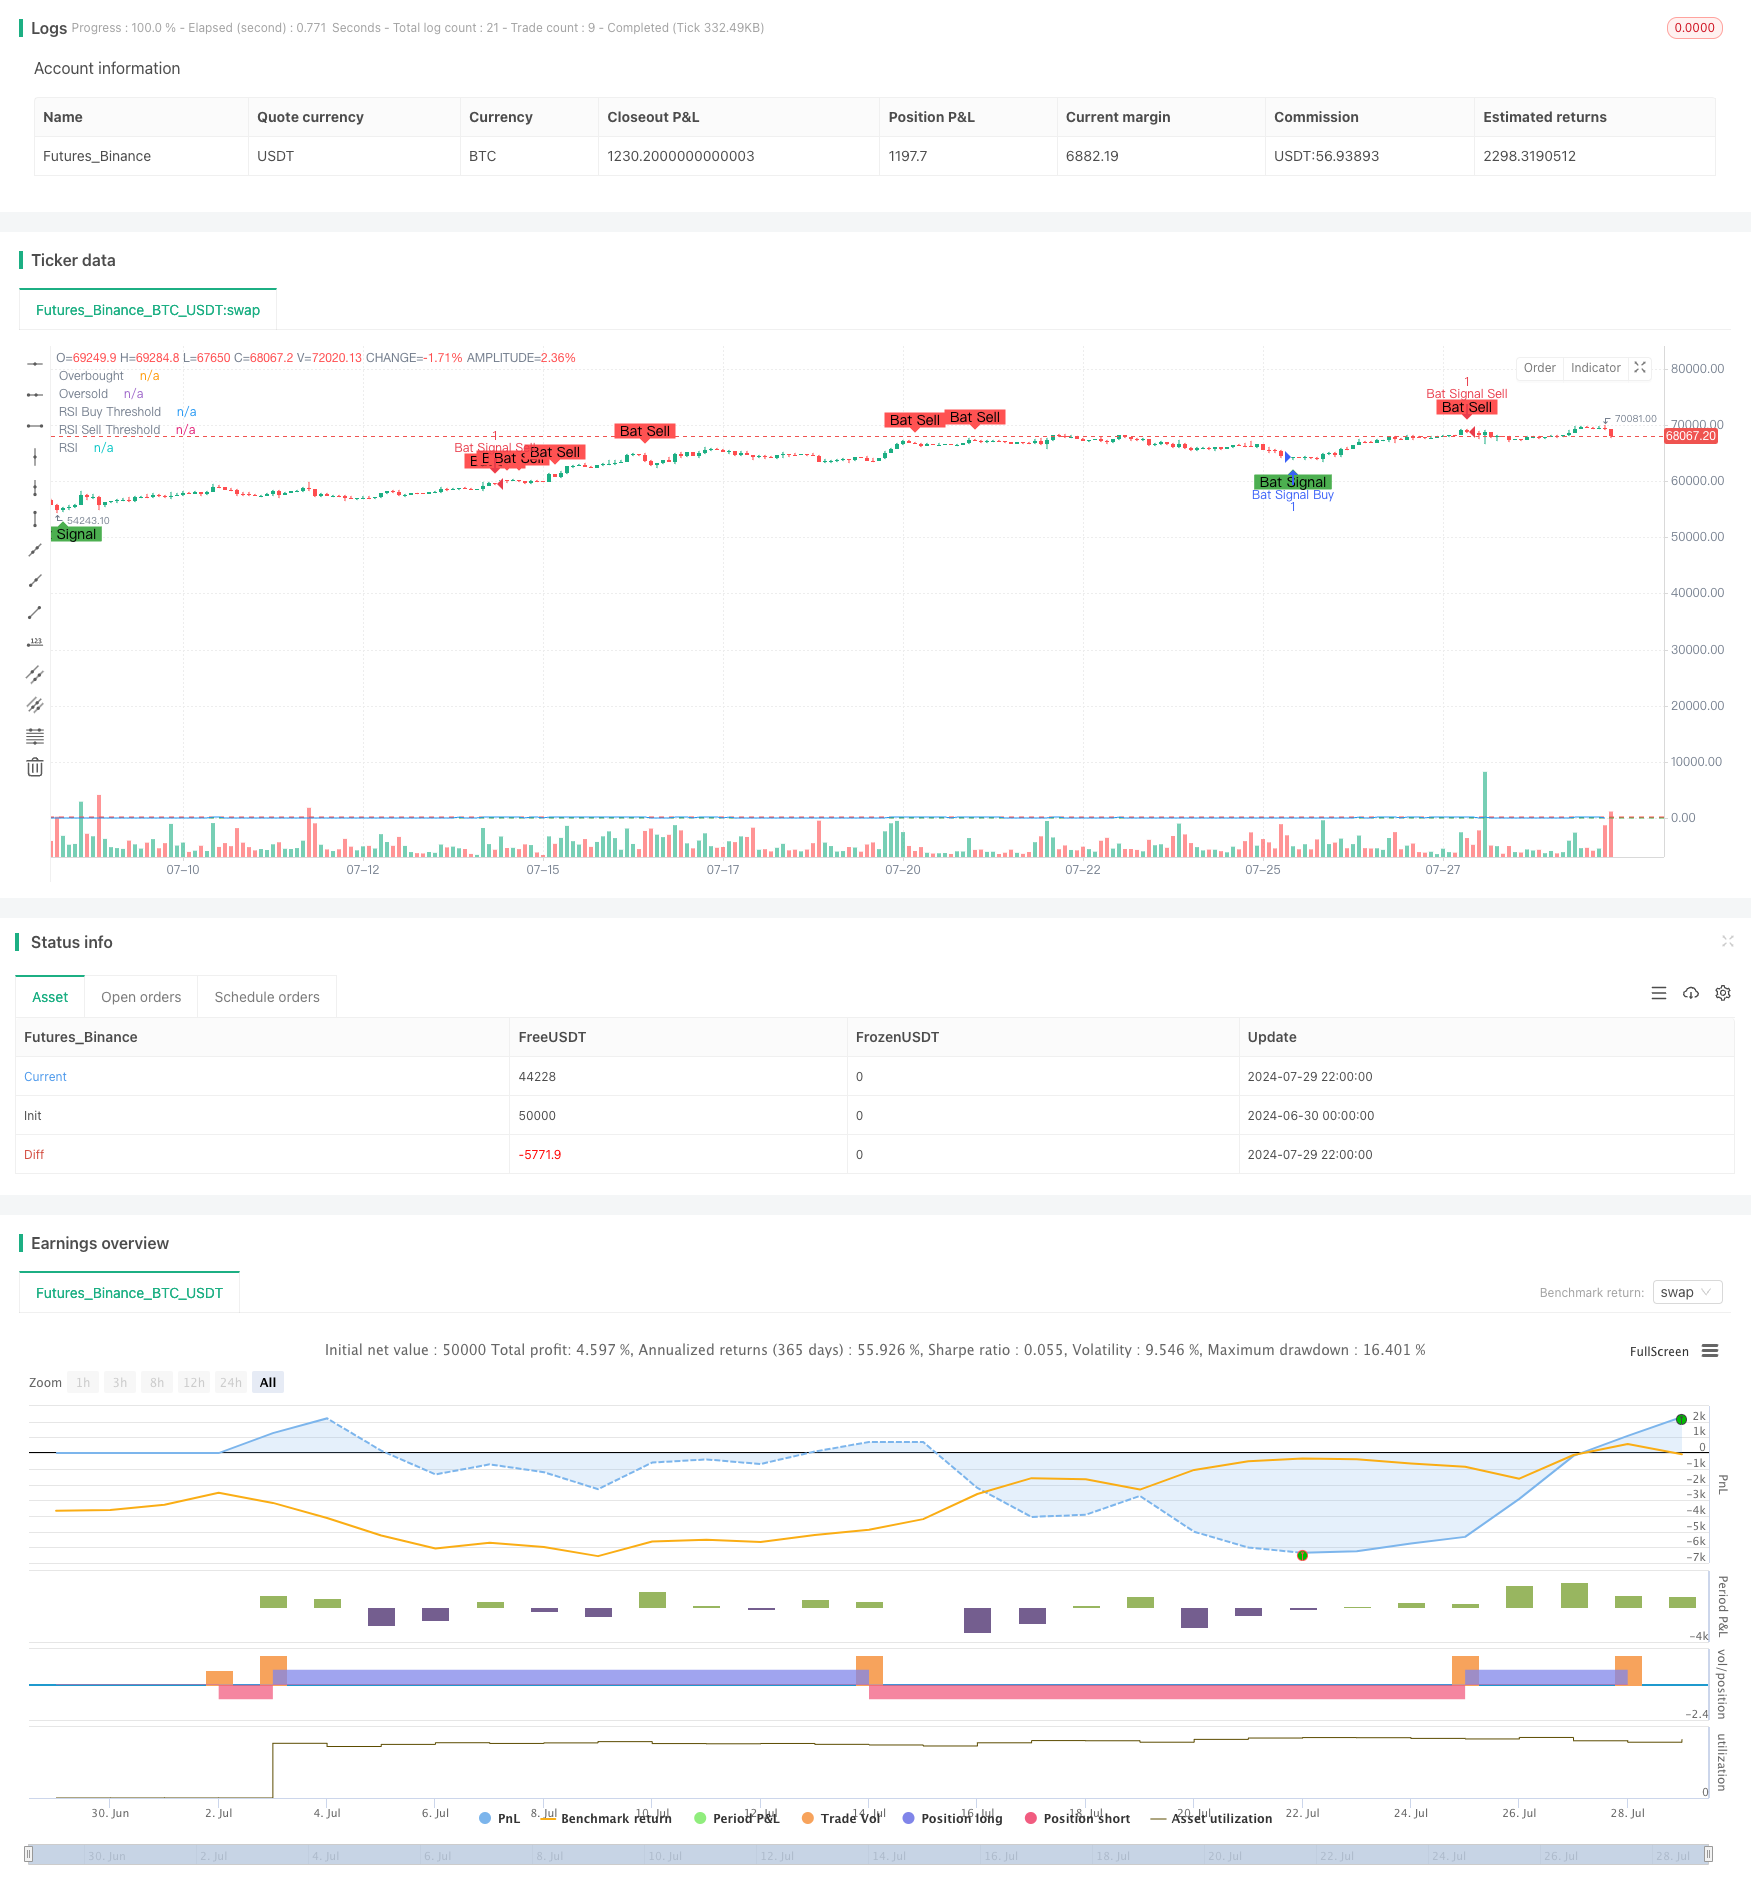
双重RSI策略:结合背离与交叉的高级趋势捕捉系统
Author: ChaoZhang, Date: 2024-07-31 11:55:12Tags: RSI

概述
双重RSI策略是一种结合了RSI背离和RSI交叉两种经典交易方法的高级量化交易策略。该策略通过同时监测RSI指标的背离和交叉信号,旨在捕捉市场中更可靠的买卖点。策略的核心思想是,只有当RSI背离和RSI交叉同时出现时,才会触发交易信号,这种双重确认机制有助于提高交易的准确性和可靠性。
策略原理
RSI背离:
- 看涨背离:当价格创新低,但RSI未创新低时形成。
- 看跌背离:当价格创新高,但RSI未创新高时形成。
RSI交叉:
- 买入信号:RSI从超卖区(30以下)向上突破。
- 卖出信号:RSI从超买区(70以上)向下突破。
信号生成:
- 买入条件:同时满足RSI看涨背离和RSI向上突破超卖线。
- 卖出条件:同时满足RSI看跌背离和RSI向下突破超买线。
参数设置:
- RSI周期:14(可调)
- 超买线:70(可调)
- 超卖线:30(可调)
- 背离查找周期:90个K线(可调)
策略优势
高可靠性:通过结合RSI背离和交叉两种信号,大大提高了交易信号的可靠性,降低了假信号的风险。
趋势把握:能够有效捕捉市场趋势的转折点,适合中长期交易。
灵活性强:策略的关键参数均可调整,适应不同市场环境和交易品种。
风险控制:通过严格的双重确认机制,有效控制了交易风险。
可视化支持:策略提供了清晰的图表标记,便于交易者直观理解市场状况。
策略风险
滞后性:由于需要双重确认,可能会错过一些快速行情的早期阶段。
过度依赖RSI:在某些市场条件下,单一指标可能无法全面反映市场状况。
参数敏感性:不同的参数设置可能导致截然不同的交易结果,需要仔细优化。
假信号风险:尽管双重确认机制降低了假信号风险,但在剧烈波动的市场中仍可能出现。
缺乏止损机制:策略本身没有内置止损机制,需要交易者额外设置。
策略优化方向
多指标结合:引入其他技术指标(如MACD、布林带)进行交叉验证,进一步提高信号可靠性。
自适应参数:根据市场波动率动态调整RSI周期和阈值,以适应不同市场环境。
加入止损机制:设计基于ATR或固定百分比的止损策略,控制单笔交易风险。
时间过滤:加入交易时间窗口限制,避免在不利时段进行交易。
波动率过滤:在低波动率环境下抑制交易信号,降低假突破风险。
量价结合:引入成交量分析,提高信号的可信度。
机器学习优化:使用机器学习算法优化参数选择,提高策略的适应性。
总结
双重RSI策略通过巧妙结合RSI背离和交叉信号,创造了一个强大而灵活的交易系统。它不仅能够有效捕捉市场趋势的重要转折点,还通过双重确认机制显著提高了交易信号的可靠性。虽然策略存在一定的滞后性和参数敏感性等风险,但通过合理的优化和风险管理,这些问题都可以得到有效缓解。未来,通过引入多指标交叉验证、自适应参数和机器学习等先进技术,该策略还有很大的提升空间。对于寻求稳健、可靠交易系统的量化交易者来说,双重RSI策略无疑是一个值得深入研究和实践的选择。
/*backtest
start: 2024-06-30 00:00:00
end: 2024-07-30 00:00:00
period: 2h
basePeriod: 15m
exchanges: [{"eid":"Futures_Binance","currency":"BTC_USDT"}]
*/

//@version=4
strategy("Combined RSI Strategies", overlay=true)

// Input parameters for the first strategy (RSI Divergences)
len = input(14, minval=1, title="RSI Length")
ob = input(defval=70, title="Overbought", type=input.integer, minval=0, maxval=100)
os = input(defval=30, title="Oversold", type=input.integer, minval=0, maxval=100)
xbars = input(defval=90, title="Div lookback period (bars)?", type=input.integer, minval=1)

// Input parameters for the second strategy (RSI Crossover)
rsiBuyThreshold = input(30, title="RSI Buy Threshold")
rsiSellThreshold = input(70, title="RSI Sell Threshold")

// RSI calculation
rsi = rsi(close, len)

// Calculate highest and lowest bars for divergences
hb = abs(highestbars(rsi, xbars))
lb = abs(lowestbars(rsi, xbars))

// Initialize variables for divergences
var float max = na
var float max_rsi = na
var float min = na
var float min_rsi = na
var bool pivoth = na
var bool pivotl = na
var bool divbear = na
var bool divbull = na

// Update max and min values for divergences
max := hb == 0 ? close : na(max[1]) ? close : max[1]
max_rsi := hb == 0 ? rsi : na(max_rsi[1]) ? rsi : max_rsi[1]
min := lb == 0 ? close : na(min[1]) ? close : min[1]
min_rsi := lb == 0 ? rsi : na(min_rsi[1]) ? rsi : min_rsi[1]

// Compare current bar's high/low with max/min values for divergences
if close > max
    max := close
if rsi > max_rsi
    max_rsi := rsi
if close < min
    min := close
if rsi < min_rsi
    min_rsi := rsi

// Detect pivot points for divergences
pivoth := (max_rsi == max_rsi[2]) and (max_rsi[2] != max_rsi[3]) ? true : na
pivotl := (min_rsi == min_rsi[2]) and (min_rsi[2] != min_rsi[3]) ? true : na

// Detect divergences
if (max[1] > max[2]) and (rsi[1] < max_rsi) and (rsi <= rsi[1])
    divbear := true
if (min[1] < min[2]) and (rsi[1] > min_rsi) and (rsi >= rsi[1])
    divbull := true

// Conditions for RSI crossovers
isRSICrossAboveThreshold = crossover(rsi, rsiBuyThreshold)
isRSICrossBelowThreshold = crossunder(rsi, rsiSellThreshold)

// Combined buy and sell conditions
buyCondition = divbull and isRSICrossAboveThreshold
sellCondition = divbear and isRSICrossBelowThreshold

// Generate buy/sell signals
if buyCondition
    strategy.entry("Bat Signal Buy", strategy.long)
if sellCondition
    strategy.entry("Bat Signal Sell", strategy.short)

// Plot RSI
plot(rsi, "RSI", color=color.blue)
hline(ob, title="Overbought", color=color.red)
hline(os, title="Oversold", color=color.green)
hline(rsiBuyThreshold, title="RSI Buy Threshold", color=color.green)
hline(rsiSellThreshold, title="RSI Sell Threshold", color=color.red)

// Plot signals
plotshape(series=buyCondition, title="Bat Signal", location=location.belowbar, color=color.green, style=shape.labelup, text="Bat Signal")
plotshape(series=sellCondition, title="Bat Sell", location=location.abovebar, color=color.red, style=shape.labeldown, text="Bat Sell")
- 双指标动量趋势量化策略系统
- 双均线-RSI多重信号趋势交易策略
- 动态均线系统结合RSI动量指标的日内交易优化策略
- 多重技术指标交叉动量趋势跟踪策略
- 动态调整止损的大象柱形态趋势跟踪策略
- 双周期RSI趋势动量强度策略结合金字塔式仓位管理系统
- 多均线交叉辅助RSI动态参数量化交易策略
- 动态趋势判定RSI指标交叉策略
- 多维度K近邻算法与烛台形态的量价分析交易策略
- 自适应多策略动态切换系统:融合趋势跟踪与区间震荡的量化交易策略
- 多指标多维度趋势交叉高级量化策略
- 动态趋势追踪与精准止盈止损策略
- 一目均衡图趋势跟踪与支撑阻力策略
- 布林带均值回归交易策略与动态支撑
- 早晨蜡烛突破与反转策略
- 基于斐波那契回撤的自适应趋势跟踪策略
- 高级马尔可夫模型技术指标融合交易策略
- 多层波动带交易策略
- 多周期均线交叉与波动率过滤动态策略
- 多重指标综合动量交易策略
- 三重指数移动平均线与支撑阻力动态交易策略
- 基于洛伦兹分类法的多时间框架交易策略
- 双均线趋势捕捉策略结合动态止损和过滤器
- 多指标趋势跟踪与成交量确认策略
- 双均线交叉带止盈止损的自适应量化交易策略
- 基于艾略特波浪与汤姆·德马克顺势交易策略
- 基于量化动量和收敛发散的多时间框架统一策略
- RSI超卖定期投资策略与冷却期优化
- HMA优化多周期量化交易策略与动态止损结合
- 布林带交叉与滑点价格影响组合策略
- 趋势结构突破与订单块公平价值缺口策略