Overview
The Advanced Multi-Timeframe Ichimoku Cloud Trading Strategy with Dynamic Multidimensional Analysis is a complex and comprehensive technical analysis tool designed to capture long-term trends and significant turning points in the market. Based on the traditional Ichimoku Kinko Hyo indicator, this strategy achieves adaptive analysis across different market cycles by dynamically adjusting key parameters and introducing risk management mechanisms. The core of the strategy lies in utilizing the crossovers and relative positions of multiple indicator lines such as Tenkan-sen (Conversion Line), Kijun-sen (Base Line), Senkou Span A and B (Leading Span A and B), and Chikou Span (Lagging Span), combined with the price position relative to the Kumo (Cloud), to generate buy and sell signals.
Strategy Principles
Signal Generation Mechanism:
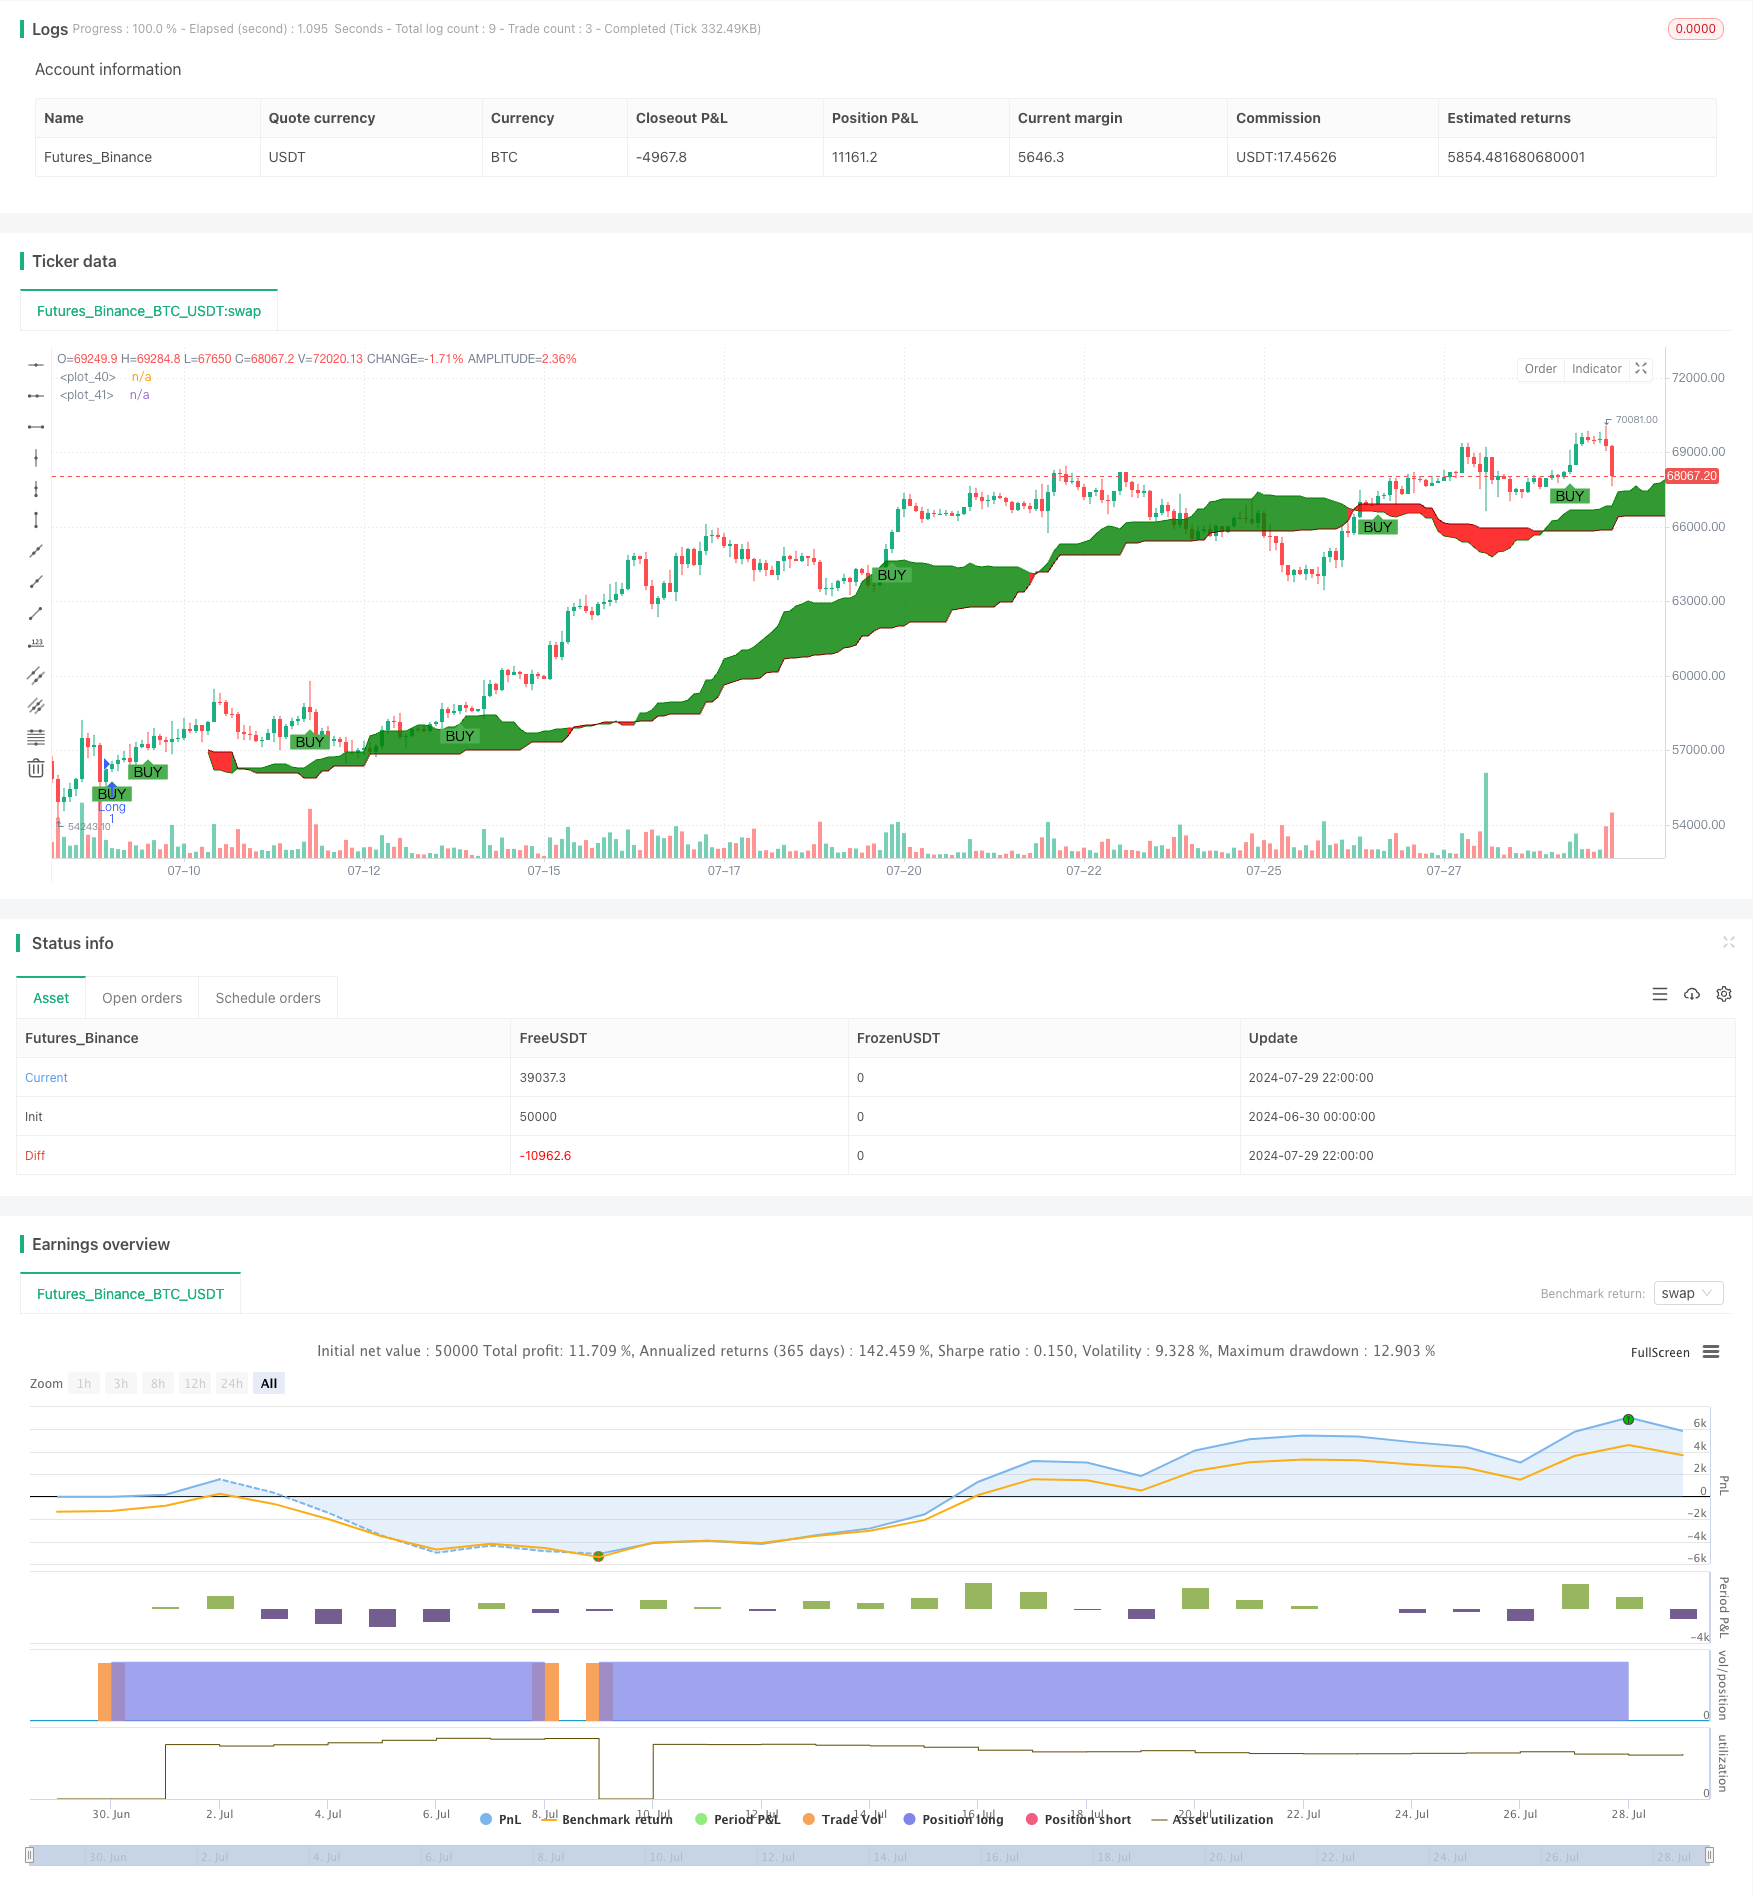
- Buy Signal: Triggered when Tenkan-sen crosses above Kijun-sen and the price is above the cloud.
- Sell Signal: Triggered when Tenkan-sen crosses below Kijun-sen and the price is below the cloud.
Dynamic Parameter Adjustment:
- Tenkan-sen Period: 9 periods
- Kijun-sen Period: 26 periods
- Senkou Span B Period: 52 periods
- Displacement: 26 periods
Risk Management:
- Incorporates adjustable stop-loss percentage (default 5%) and take-profit percentage (default 10%)
- Suitable for long-term trading, especially on weekly or monthly charts
Visualization:
- Uses custom color schemes to enhance the visibility of the cloud and various indicator lines
- Adjusts cloud transparency (90%) to improve readability
Multidimensional Analysis:
- Combines price, multiple moving averages, and cloud positions for multi-angle market analysis
- Utilizes Chikou Span to reflect historical price performance, adding decision-making reference
Strategy Advantages
Comprehensiveness: Integrates multiple technical indicators, providing a comprehensive analysis of market trends, momentum, and potential support/resistance levels.
Adaptability: Through adjustable parameters, the strategy can adapt to different market environments and trading cycles.
Risk Management: Built-in stop-loss and take-profit mechanisms help control risk and protect profits.
Visual Intuitiveness: Custom color schemes and transparency settings make market conditions easily discernible.
Long-term Stability: Particularly suitable for long-term traders, helping to capture major trends and reduce noise interference.
Multidimensional Analysis: By considering multiple indicators comprehensively, it reduces the risk of false signals.
Automation: The strategy can be easily integrated into automated trading systems, reducing manual intervention.
Strategy Risks
Lag: Ichimoku indicators are inherently lagging, which may result in delayed reactions in rapidly changing markets.
Over-reliance: Excessive dependence on a single strategy may overlook other important market factors.
Parameter Sensitivity: Different market environments may require different parameter settings, necessitating regular optimization.
False Breakouts: May generate more false signals in range-bound markets, increasing trading costs.
Complexity: The comprehensive analysis of multiple indicators may complicate the decision-making process, especially for novice traders.
Backtesting Bias: Good performance in historical data backtests does not guarantee future performance; beware of overfitting.
Market Adaptability: The strategy performs well in trending markets but may be less effective in sideways or highly volatile markets.
Strategy Optimization Directions
Dynamic Parameter Adjustment: Introduce adaptive mechanisms to automatically adjust parameters based on market volatility.
Multi-Timeframe Analysis: Integrate signals from different time periods to improve decision reliability.
Quantitative Indicator Fusion: Combine with other technical indicators such as volume and volatility to enhance signal credibility.
Machine Learning Optimization: Utilize machine learning algorithms to optimize parameter selection and signal generation processes.
Sentiment Analysis Integration: Incorporate market sentiment indicators, such as VIX or social media sentiment analysis, to enrich decision-making bases.
Advanced Risk Management: Implement dynamic stop-loss and take-profit targets that automatically adjust based on market conditions.
Enhanced Backtesting Framework: Develop a more comprehensive backtesting system that includes practical factors such as slippage and trading costs.
Summary
The Advanced Multi-Timeframe Ichimoku Cloud Trading Strategy with Dynamic Multidimensional Analysis is a powerful and flexible technical analysis tool, particularly suitable for long-term trend trading. By integrating multiple Ichimoku indicator lines and cloud analysis, combined with intelligent risk management mechanisms, this strategy can provide comprehensive market insights and trading signals. While there are some inherent risks and limitations, through continuous optimization and appropriate use, it has the potential to become a powerful weapon in a trader’s toolkit. Future optimization directions should focus on improving the strategy’s adaptability, precision, and robustness to cope with ever-changing market environments. Overall, this is an advanced trading strategy worth in-depth study and practice, especially suitable for investors and traders seeking long-term stable returns.
/*backtest
start: 2024-06-30 00:00:00
end: 2024-07-30 00:00:00
period: 2h
basePeriod: 15m
exchanges: [{"eid":"Futures_Binance","currency":"BTC_USDT"}]
*/

//@version=5
strategy("Ichimoku",overlay = true)
//indicator("Flexible Ichimoku Cloud for Long-Term Trading", overlay=true, shorttitle="Ichimoku")

// Inputs for the Ichimoku Cloud
tenkan_period = input.int(9, title="Tenkan-sen Period")
kijun_period = input.int(26, title="Kijun-sen Period")
senkou_b_period = input.int(52, title="Senkou Span B Period")
displacement = input.int(26, title="Displacement")

// Inputs for Risk Management
stop_loss_percentage = input.float(5.0, title="Stop-Loss Percentage", minval=0.1, step=0.1) / 100 // Default to 5% for long-term
take_profit_percentage = input.float(10.0, title="Take-Profit Percentage", minval=0.1, step=0.1) / 100 // Default to 10% for long-term

// Colors and Styling
tenkan_color = input.color(color.blue, title="Tenkan-sen Color")
kijun_color = input.color(color.red, title="Kijun-sen Color")
senkou_a_color = input.color(color.green, title="Senkou Span A Color")
senkou_b_color = input.color(color.maroon, title="Senkou Span B Color")
chikou_color = input.color(color.purple, title="Chikou Span Color")
cloud_bull_color = input.color(color.green, title="Bullish Cloud Color", inline="cloud")
cloud_bear_color = input.color(color.red, title="Bearish Cloud Color", inline="cloud")
cloud_transparency = input.int(90, title="Cloud Transparency", minval=0, maxval=100)

// Calculating the Ichimoku components
tenkan_sen = (ta.highest(high, tenkan_period) + ta.lowest(low, tenkan_period)) / 2
kijun_sen = (ta.highest(high, kijun_period) + ta.lowest(low, kijun_period)) / 2
senkou_span_a = ta.sma(tenkan_sen + kijun_sen, 1) / 2
senkou_span_b = (ta.highest(high, senkou_b_period) + ta.lowest(low, senkou_b_period)) / 2
chikou_span = close[displacement]

// Plotting the Ichimoku components
//plot(tenkan_sen, color=tenkan_color, title="Tenkan-sen", linewidth=2)
//plot(kijun_sen, color=kijun_color, title="Kijun-sen", linewidth=2)
//plot(senkou_span_a, color=senkou_a_color, title="Senkou Span A", offset=displacement, linewidth=1)
//plot(senkou_span_b, color=senkou_b_color, title="Senkou Span B", offset=displacement, linewidth=1)
//plot(chikou_span, color=chikou_color, title="Chikou Span", offset=-displacement, linewidth=1)

// Plotting the Kumo (Cloud)
p1 = plot(senkou_span_a, offset=displacement, color=senkou_a_color)
p2 = plot(senkou_span_b, offset=displacement, color=senkou_b_color)
fill(p1, p2, color=senkou_span_a > senkou_span_b ? color.new(cloud_bull_color, cloud_transparency) : color.new(cloud_bear_color, cloud_transparency), title="Kumo")

// Long and Short Conditions
longCondition = ta.crossover(tenkan_sen, kijun_sen) and close > senkou_span_a and close > senkou_span_b
shortCondition = ta.crossunder(tenkan_sen, kijun_sen) and close < senkou_span_a and close < senkou_span_b

// Plotting Buy and Sell Signals
plotshape(series=longCondition, location=location.belowbar, color=color.green, style=shape.labelup, text="BUY", title="Buy Signal", size=size.small)
plotshape(series=shortCondition, location=location.abovebar, color=color.red, style=shape.labeldown, text="SELL", title="Sell Signal", size=size.small)

var float entry_price = na
var float stop_loss = na
var float take_profit = na

if (longCondition)
    entry_price := close
    stop_loss := close * (1 - stop_loss_percentage)
    take_profit := close * (1 + take_profit_percentage)

if (shortCondition)
    entry_price := close
    stop_loss := close * (1 + stop_loss_percentage)
    take_profit := close * (1 - take_profit_percentage)

// Plotting Stop-Loss and Take-Profit Levels
//plot(entry_price, color=color.yellow, title="Entry Price", linewidth=1, offset=-displacement)
//plot(stop_loss, color=color.red, title="Stop-Loss Level", linewidth=1, offset=-displacement)
//plot(take_profit, color=color.green, title="Take-Profit Level", linewidth=1, offset=-displacement)

// Plotting Stop-Loss and Take-Profit Labels
//label.new(bar_index, stop_loss, text="SL", color=color.red, style=label.style_label_down, textcolor=color.white, size=size.small)
//label.new(bar_index, take_profit, text="Take-Profit", color=color.green, style=label.style_label_up, textcolor=color.white, size=size.small)

// Alerts for Buy and Sell Signals
alertcondition(longCondition, title="Buy Alert", message="Ichimoku Buy Signal")
alertcondition(shortCondition, title="Sell Alert", message="Ichimoku Sell Signal")

strategy.entry("Long",strategy.long, when=longCondition)
strategy.close("Long",when=shortCondition)