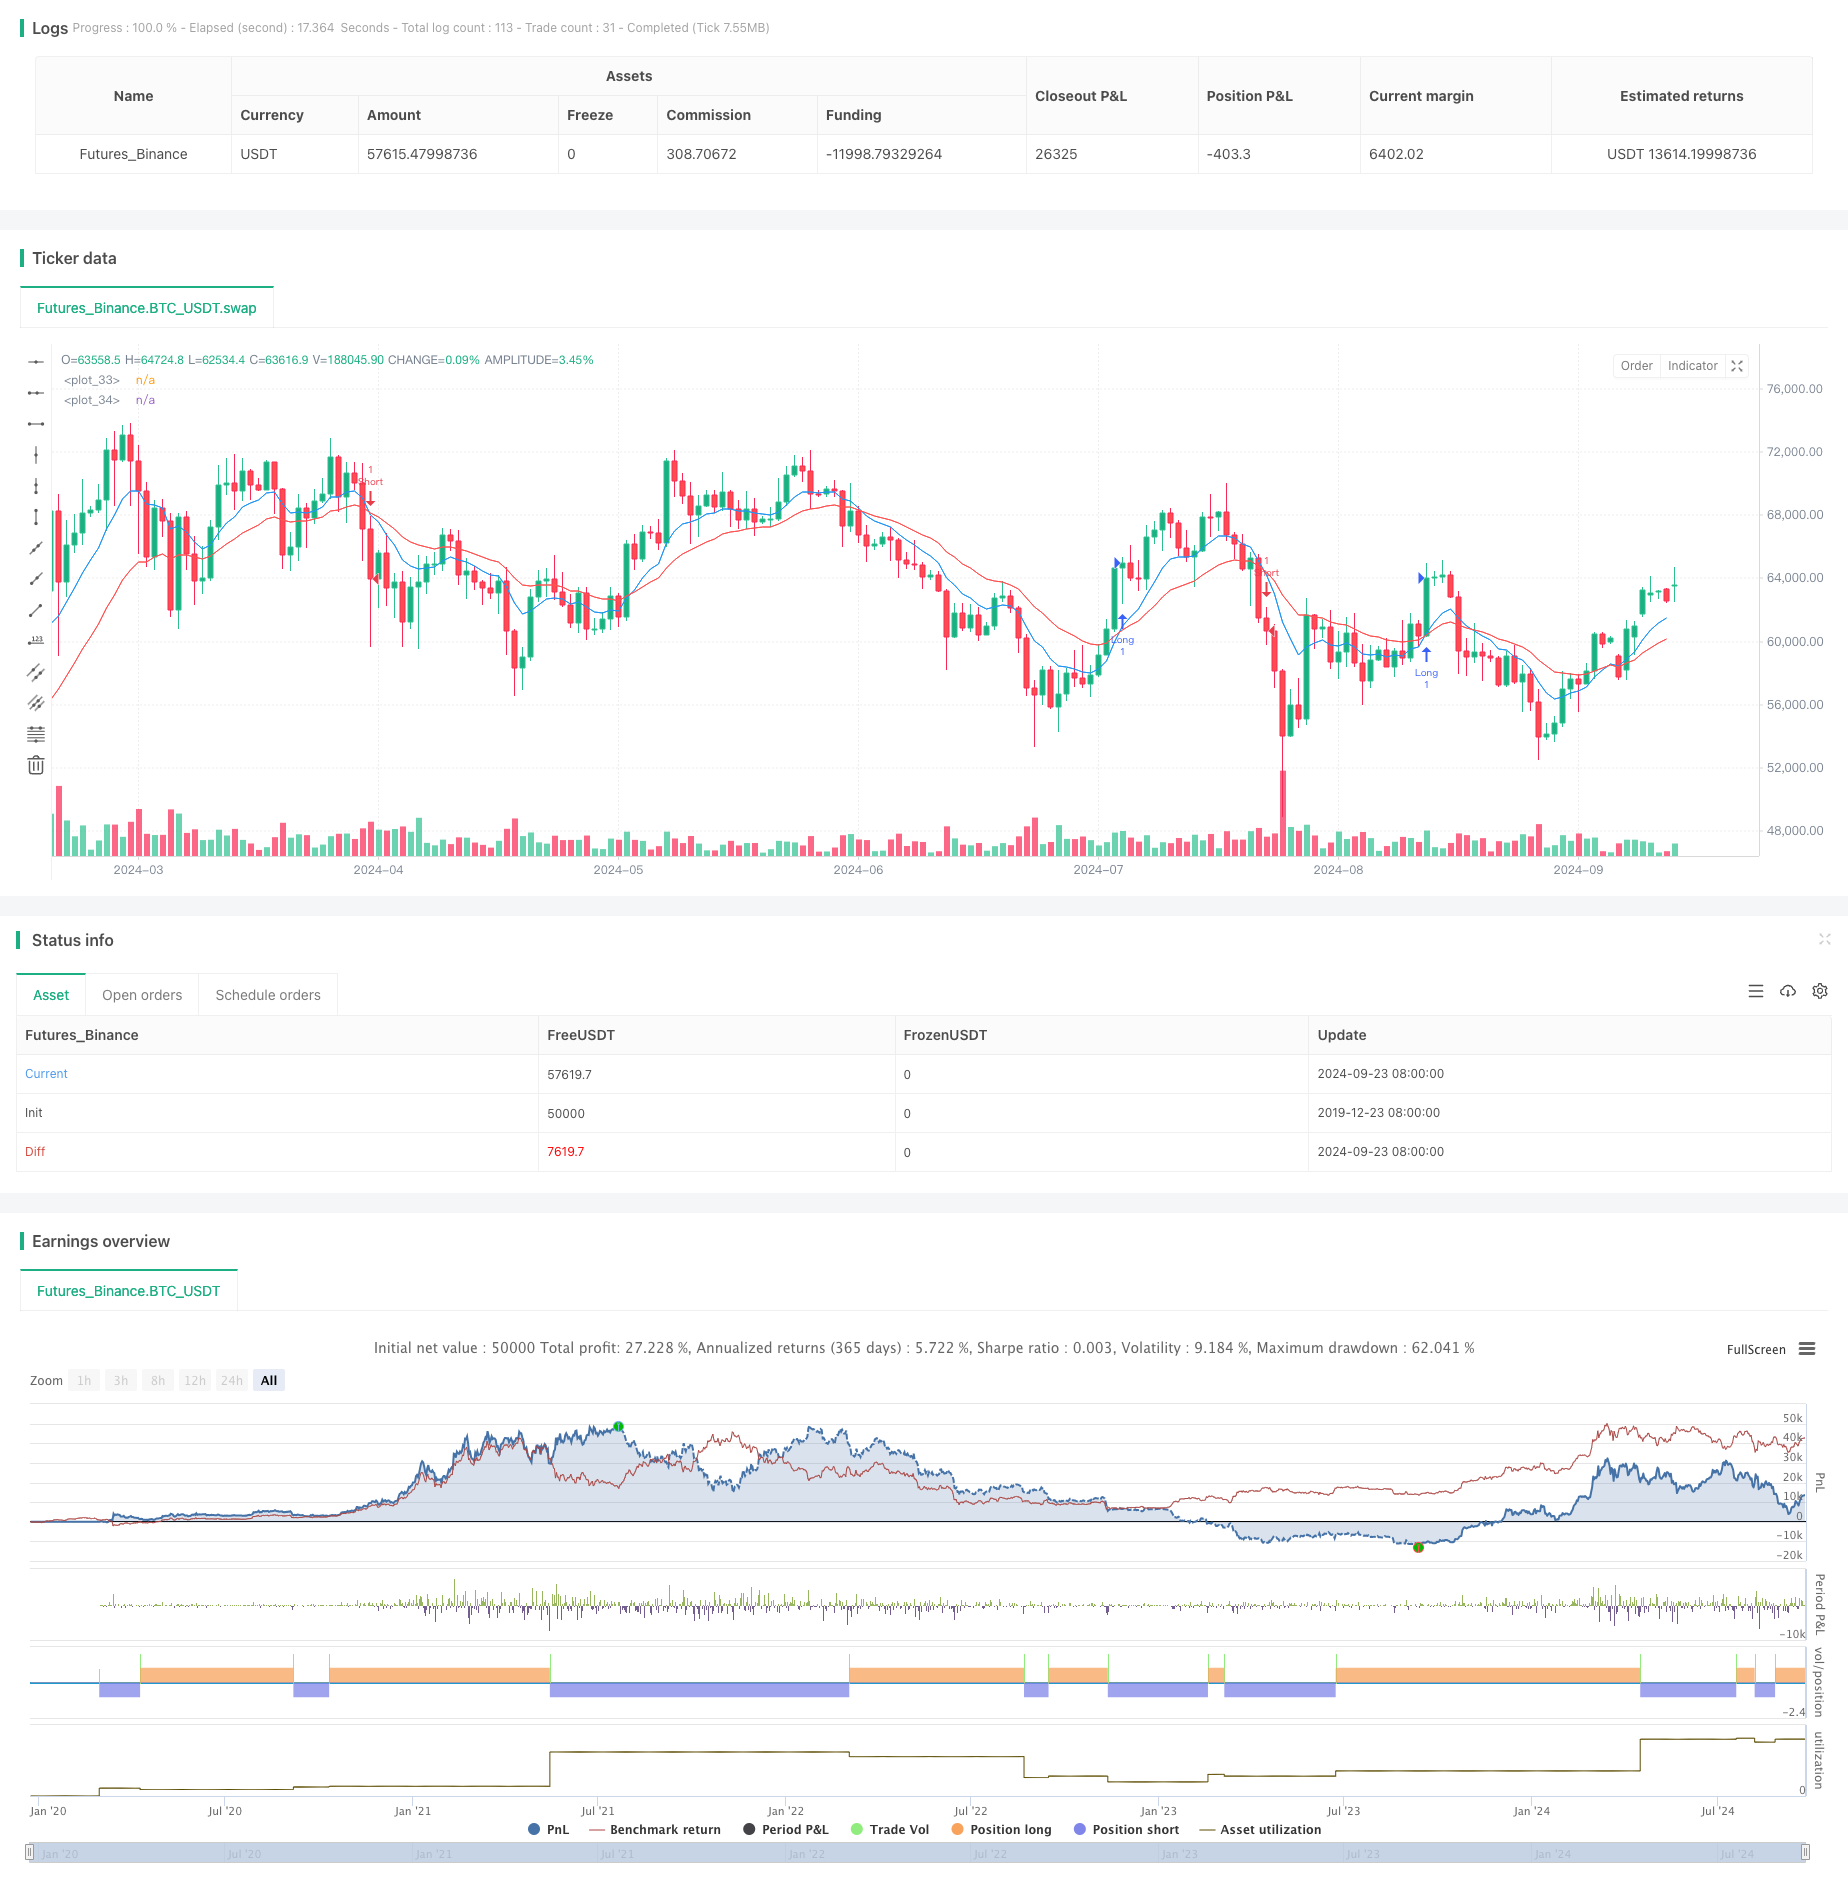
Intelligent Institutional Trading Structure Momentum Strategy
Author: ChaoZhang, Date: 2024-09-26 15:35:59Tags: EMAVWAPICTSMC

Overview
The Intelligent Institutional Trading Structure Momentum Strategy is an advanced trading approach that combines market structure analysis, institutional trading theory, and momentum analysis. This strategy utilizes Exponential Moving Averages (EMAs) to determine market structure and trend direction, while identifying high liquidity zones and institutional trading candles to find potential entry and exit opportunities. The approach aims to capture large-scale capital flows in the market, thereby increasing the success rate and profitability of trades.
Strategy Principles
Market Structure Analysis: Uses crossovers of 9-period and 21-period EMAs to determine market trends. A bullish signal is generated when the fast EMA crosses above the slow EMA, and vice versa for bearish signals.
Liquidity Zone Identification: Calculates the highest high and lowest low over 50 periods to identify high liquidity zones, which are often targets for institutional traders.
Institutional Trading Candles: Defined as candles with volume higher than the 50-period average and closing price above (bullish) or below (bearish) the opening price.
Entry Signals: A long signal is generated when the market structure is bullish and an institutional buying candle appears; a short signal is generated when the market structure is bearish and an institutional selling candle appears.
Risk Management: Uses corresponding liquidity zones as stop-loss points to limit potential losses.
Strategy Advantages
Multi-dimensional Analysis: Combines technical indicators, price action, and volume analysis to provide comprehensive market insights.
Following Big Money: Improves the ability to follow market-driving forces by identifying institutional trading activity.
Risk Control: Uses key liquidity levels as stop-loss points, helping to effectively manage risk.
High Adaptability: Can be applied to different markets and timeframes, offering good flexibility.
Trend Capture: Utilizes EMA crossovers to identify trends, helping to capture trading opportunities within major trends.
Strategy Risks
False Breakouts: In ranging markets, frequent false breakout signals may lead to consecutive losses.
Lagging Nature: EMAs, being lagging indicators, may miss opportunities or generate false signals at the beginning of trend reversals.
Over-reliance on Volume: In certain market conditions, volume may not accurately reflect true market sentiment.
Parameter Sensitivity: Strategy performance may be sensitive to parameter settings such as EMA periods and volume thresholds.
Market Noise: In high-volatility environments, it may be difficult to accurately identify genuine institutional trading activity.
Strategy Optimization Directions
Introduce Additional Filters: Consider adding auxiliary indicators such as Relative Strength Index (RSI) or Stochastic Oscillator to reduce false signals.
Dynamic Parameter Adjustment: Implement mechanisms to automatically adjust EMA periods and volume thresholds based on market volatility to adapt to different market conditions.
Multi-timeframe Analysis: Integrate market structure analysis from higher timeframes to improve trading decision accuracy.
Price Action Confirmation: Add additional price action confirmation before entry, such as key level breakouts or specific candlestick patterns.
Machine Learning Integration: Utilize machine learning algorithms to optimize parameter selection and signal generation processes, improving strategy adaptability and performance.
Summary
The Intelligent Institutional Trading Structure Momentum Strategy is a sophisticated method that combines multiple advanced trading concepts. By integrating EMAs, volume analysis, and institutional trading theory, the strategy aims to identify and follow large capital flows while managing risk. While this approach has the potential to capture significant market moves, it still requires careful parameter optimization and ongoing market adaptation. Through further improvements and optimizations, particularly in signal filtering and dynamic parameter adjustment, the strategy has the potential to become a powerful trading tool. However, traders should always keep in mind the unpredictability of markets and deploy this trading approach in conjunction with a comprehensive risk management strategy.
/*backtest
start: 2019-12-23 08:00:00
end: 2024-09-24 08:00:00
period: 1d
basePeriod: 1d
exchanges: [{"eid":"Futures_Binance","currency":"BTC_USDT"}]
*/

//@version=5
strategy("SMC + ICT Scalping Strategy", overlay=true)

// إعداد المتوسطات المتحركة
ema_fast = ta.ema(close, 9)
ema_slow = ta.ema(close, 21)

// تحديد الهيكل السوقي (الاتجاه)
bullish_structure = ta.crossover(ema_fast, ema_slow)
bearish_structure = ta.crossunder(ema_fast, ema_slow)

// تحديد مناطق السيولة (Liquidity Zones)
liquidity_high = ta.highest(high, 50)
liquidity_low = ta.lowest(low, 50)

// تحديد الشموع المؤسسية (Institutional Candles)
is_institutional_bullish = close > open and volume > ta.sma(volume, 50)
is_institutional_bearish = close < open and volume > ta.sma(volume, 50)

// إشارة الدخول
long_entry = bullish_structure and is_institutional_bullish
short_entry = bearish_structure and is_institutional_bearish

// تنفيذ صفقات الشراء
if (long_entry)
    strategy.entry("Long", strategy.long, stop=liquidity_low, comment="BUY")

// تنفيذ صفقات البيع
if (short_entry)
    strategy.entry("Short", strategy.short, stop=liquidity_high, comment="SELL")

// رسم المتوسطات المتحركة
plot(ema_fast, color=color.blue, linewidth=1)
plot(ema_slow, color=color.red, linewidth=1)
- SMC & EMA Strategy with P&L Projections
- Multi-Period EMA Crossover with VWAP High Win-Rate Intraday Trading Strategy
- VWAP Trading Strategy
- Dynamic ATR Trend Following Strategy Based on Support Breakout
- Buy and Sell Volume Heatmap with Real-Time Price Strategy
- Adaptive FVG Detection and MA Trend Trading Strategy with Dynamic Resistance
- Multi-Period Moving Average Trend Following with VWAP Cross Strategy
- Dynamic Trend Momentum Trading Strategy
- Technical Trading Strategy for BTC 15-minute Chart
- High-Frequency Dynamic Multi-Indicator Moving Average Crossover Strategy
- Dual Indicator Trading Strategy Combining Trend Following and Momentum
- Adaptive Price-Crossing Moving Average Trading Strategy
- Multi-Indicator Dynamic Stop-Loss Trend Following Strategy
- Dual Coral Trend Crossover Strategy
- EMA, SMA, CCI, ATR, Perfect Order Moving Average Strategy with Trend Magic Indicator Auto-Trading System
- 52-Week High-Low/Average Volume/Volume Breakout Strategy
- Multi-EMA and CCI Crossover Trend Following Strategy
- Dynamic Trend-Following EMA Crossover Strategy
- Multi-Factor Dynamic Adaptive Trend Following Strategy
- Multi-Timeframe RSI Oversold Reversal Strategy
- Gaussian Cross EMA Trend Retracement Strategy
- EMA MACD Momentum Tracking Strategy
- Dynamic Position Management RSI Overbought Reversal Strategy
- Multi-Zone RSI Trading Strategy
- Dynamic Trend Following Strategy with Machine Learning Enhanced Risk Management
- Crossover Moving Average with Smoothed Candlestick Momentum Strategy
- Dual Moving Average Crossover Strategy with Daily Profit Target
- Dynamic Stop-Loss Moving Average Crossover Strategy
- MACD-ATR-EMA Multi-Indicator Dynamic Trend Following Strategy
- RSI Momentum Divergence Breakout Strategy