Overview
This strategy combines trend following and momentum analysis methods, utilizing Simple Moving Average (SMA) and Moving Average Convergence Divergence (MACD) indicators to identify potential trading opportunities. The strategy uses the Trendilo indicator (a trend indicator based on SMA) to determine the overall market trend, while employing MACD zero line crossovers to capture short-term momentum changes. Additionally, the strategy incorporates Average True Range (ATR) to dynamically set stop-loss and take-profit levels, adapting to changes in market volatility.
Strategy Principles
The core logic of the strategy is based on the following key elements:
- Trendilo Indicator: Uses a 50-period simple moving average to determine medium to long-term trend direction.
- MACD Zero Line Crossover: Used to capture changes in short-term momentum as entry signals.
- ATR Stop-Loss/Take-Profit Setting: Utilizes a 14-period ATR to dynamically adjust risk management parameters.
Specifically, a long signal is triggered when the MACD line crosses above zero and the closing price is above the Trendilo line. Conversely, a short signal is triggered when the MACD line crosses below zero and the closing price is below the Trendilo line. After entry, the strategy uses ATR-based stop-loss and take-profit levels to manage risk and lock in profits.
Strategy Advantages
- Trend Confirmation: By combining Trendilo and MACD, the strategy can capture short-term momentum changes while confirming the overall trend, effectively reducing false signals.
- Dynamic Risk Management: Using ATR to set stop-loss and take-profit levels allows the strategy to automatically adjust to market volatility, enhancing its adaptability.
- Multi-timeframe Analysis: Combines medium to long-term (Trendilo) and short-term (MACD) indicators, providing a more comprehensive market perspective.
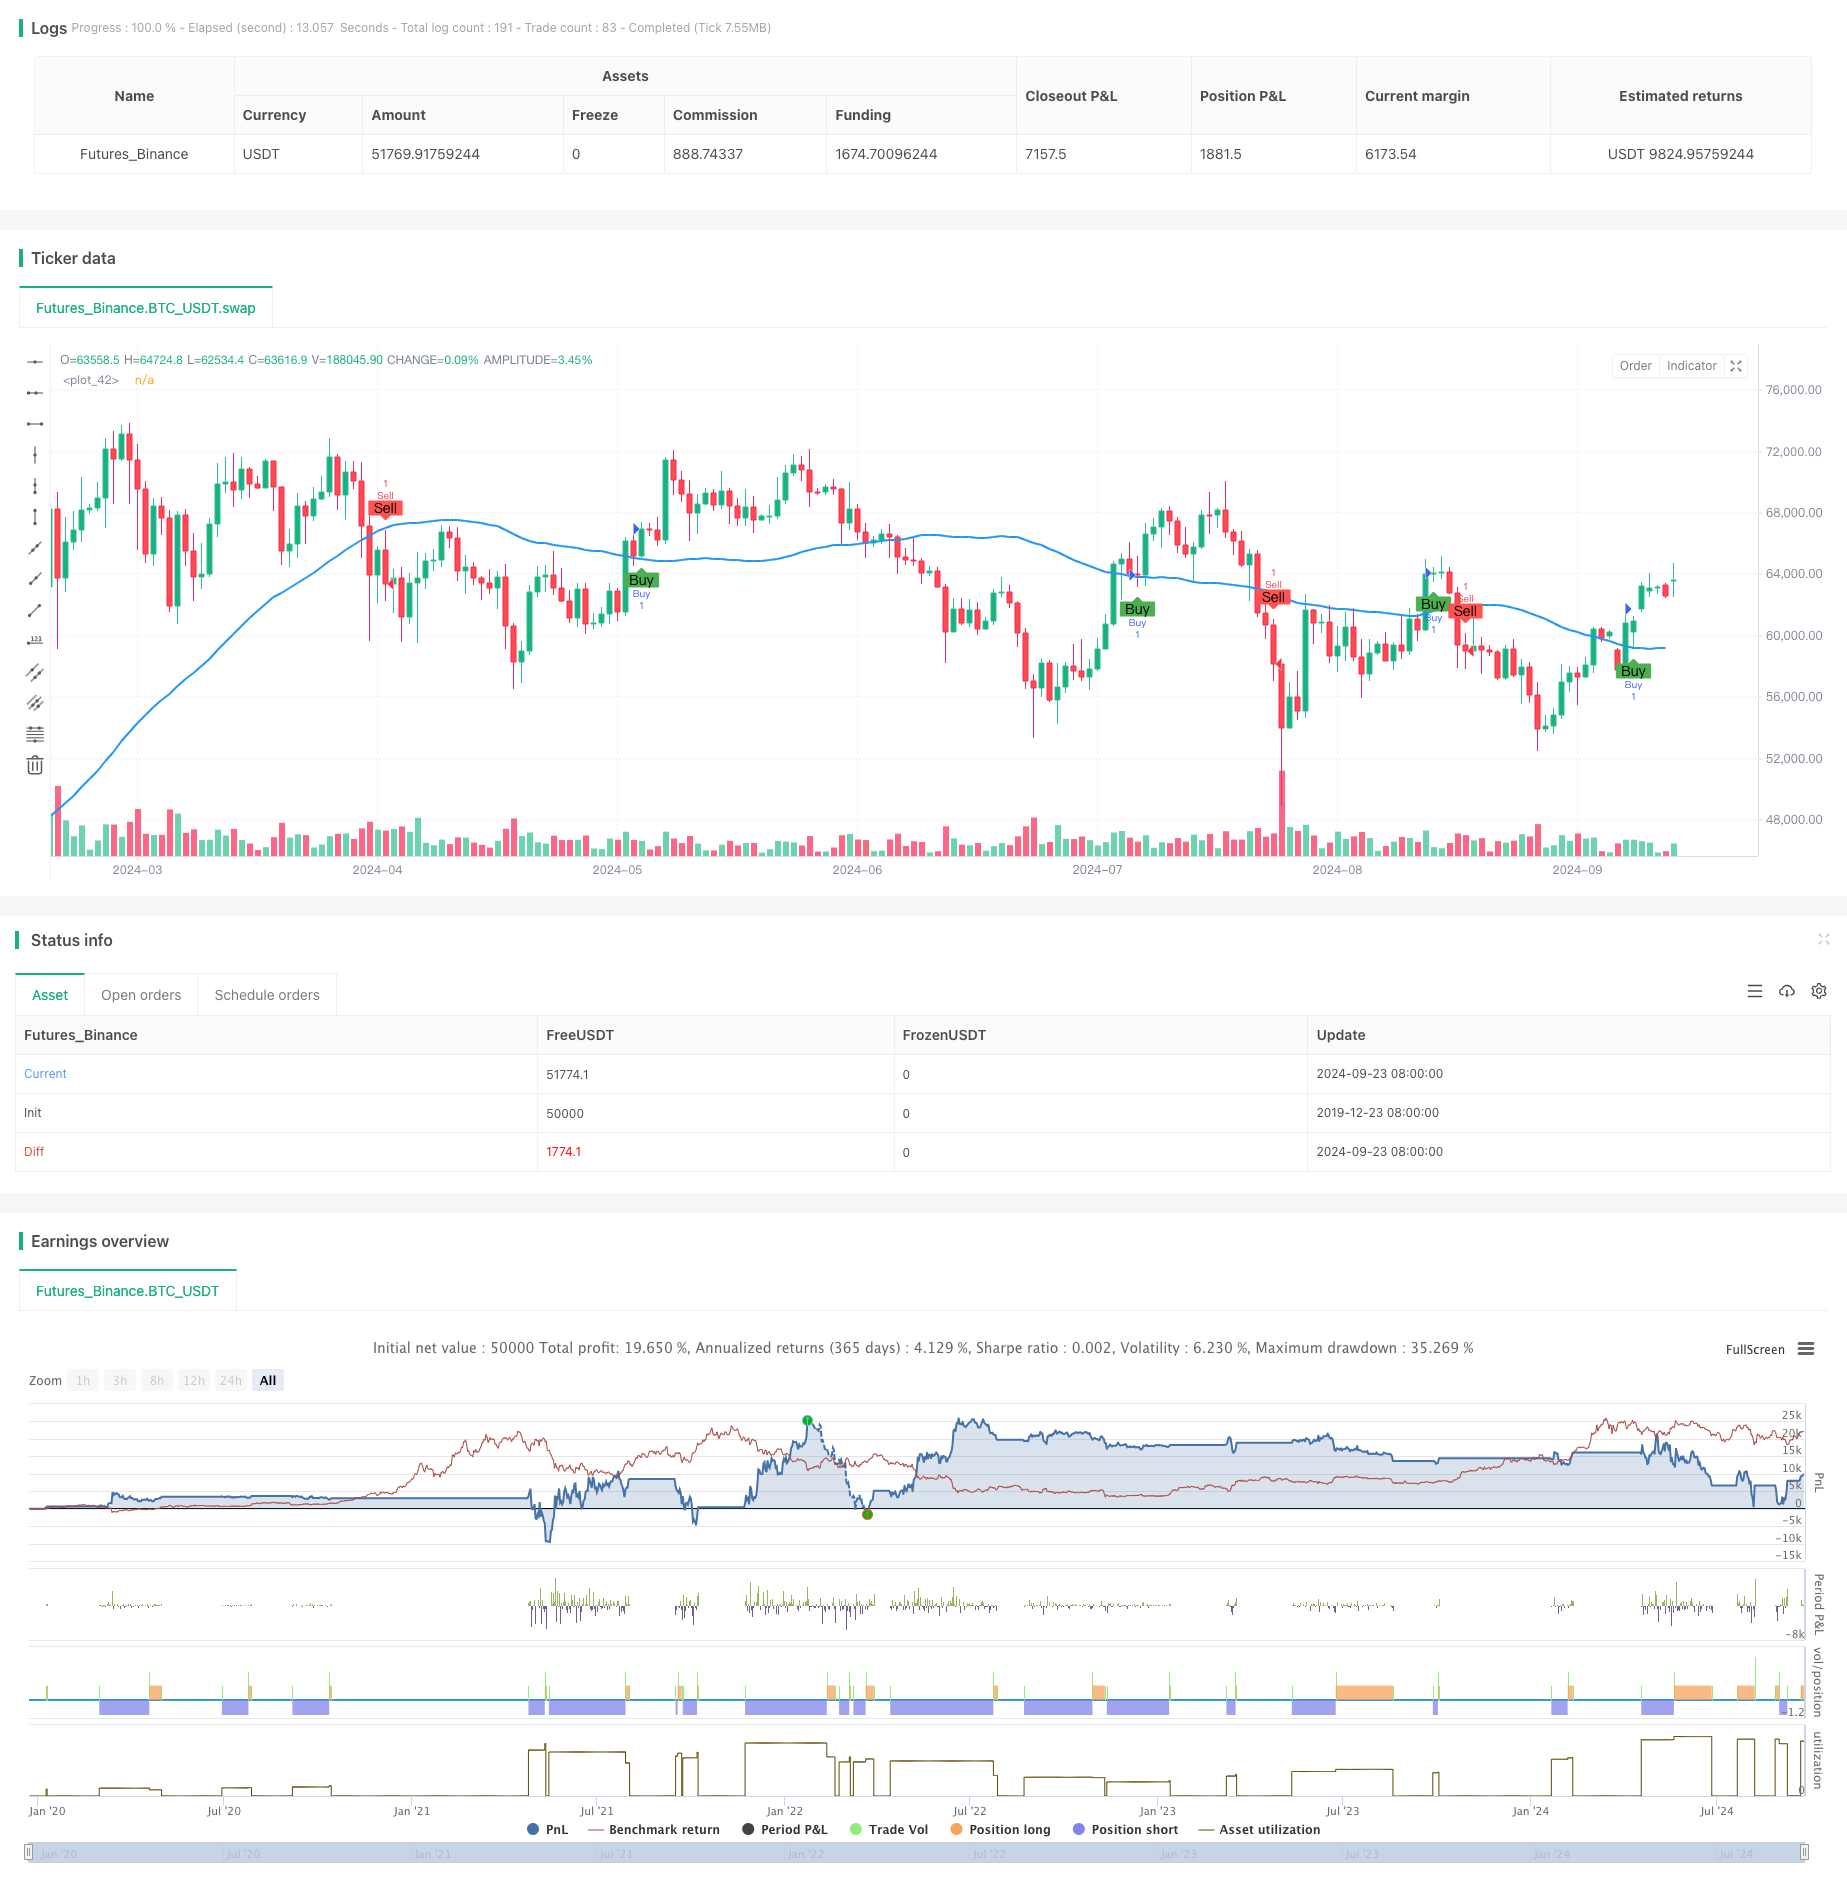
- Visual Support: The strategy marks buy and sell signals and trend lines on the chart, facilitating intuitive understanding of market conditions for traders.
Strategy Risks
- Trend Reversal Risk: Performs well in strong trending markets but may generate losses in ranging or rapidly reversing markets.
- Parameter Sensitivity: Strategy performance may be highly sensitive to the choice of input parameters (such as Trendilo period, ATR multipliers, etc.).
- Overtrading: In highly volatile markets, frequent trading signals may be generated, increasing transaction costs.
- Lagging Nature: Due to the use of moving averages, the strategy may miss some opportunities at the beginning of trends.
Strategy Optimization Directions
- Introduce Filters: Additional technical indicators or market sentiment indicators can be added to filter out low-quality trading signals.
- Optimize Parameter Selection: Through historical data backtesting, find the optimal combination of Trendilo period and ATR multipliers.
- Incorporate Volatility Adjustment: Dynamically adjust strategy parameters based on current market volatility to improve strategy adaptability.
- Implement Partial Position Management: Consider adjusting the size of each trade based on signal strength or market conditions.
- Add Time Filtering: Implement trading time window restrictions to avoid periods of high volatility or poor liquidity.
Conclusion
This strategy cleverly combines trend following and momentum analysis, providing traders with a relatively comprehensive market analysis framework through the synergy of Trendilo and MACD. The dynamic risk management approach enhances the strategy’s adaptability, allowing it to maintain stability in different market environments. However, traders should still exercise caution when using this strategy, especially in terms of parameter optimization and risk control. Through continuous monitoring and optimization, this strategy has the potential to become a reliable trading tool, particularly suitable for investors looking to capture opportunities in trending markets.
/*backtest
start: 2019-12-23 08:00:00
end: 2024-09-24 08:00:00
period: 1d
basePeriod: 1d
exchanges: [{"eid":"Futures_Binance","currency":"BTC_USDT"}]
*/

//@version=5
strategy("NNFX Trendilo + Zero MACD Strategy", overlay=true)

// --- Inputs ---
atrPeriod = input.int(14, title="ATR Period")
stopLossMultiplier = input.float(1.5, minval=0.0, maxval = 20.0, step = 0.1 ,title="Stop Loss Multiplier")
takeProfitMultiplier = input.float(2.0, minval=0.0 , maxval = 20.0, step = 0.1,title="Take Profit Multiplier")

// --- Trendilo ---
trendiloPeriod = input.int(50, title="Trendilo Period")
trendilo = ta.sma(close, trendiloPeriod)

// --- MACD ---
[macdLine, signalLine, _] = ta.macd(close, 12, 26, 9)
macdZeroCrossUp = ta.crossover(macdLine, 0)
macdZeroCrossDown = ta.crossunder(macdLine, 0)

// --- ATR for Stop Loss and Take Profit ---
atr = ta.atr(atrPeriod)
stopLoss = atr * stopLossMultiplier
takeProfit = atr * takeProfitMultiplier

// --- Trading Logic ---
longCondition = macdZeroCrossUp and close > trendilo
shortCondition = macdZeroCrossDown and close < trendilo

// --- Execute Long Trades ---
if (longCondition)
    strategy.entry("Buy", strategy.long)
    strategy.exit("Take Profit/Stop Loss", "Buy", limit=close + takeProfit, stop=close - stopLoss)

// --- Execute Short Trades ---
if (shortCondition)
    strategy.entry("Sell", strategy.short)
    strategy.exit("Take Profit/Stop Loss", "Sell", limit=close - takeProfit, stop=close + stopLoss)

// --- Plot Signals ---
plotshape(series=longCondition, location=location.belowbar, color=color.green, style=shape.labelup, text="Buy")
plotshape(series=shortCondition, location=location.abovebar, color=color.red, style=shape.labeldown, text="Sell")

// --- Plot Trendilo ---
plot(trendilo, color=color.blue, linewidth=2)