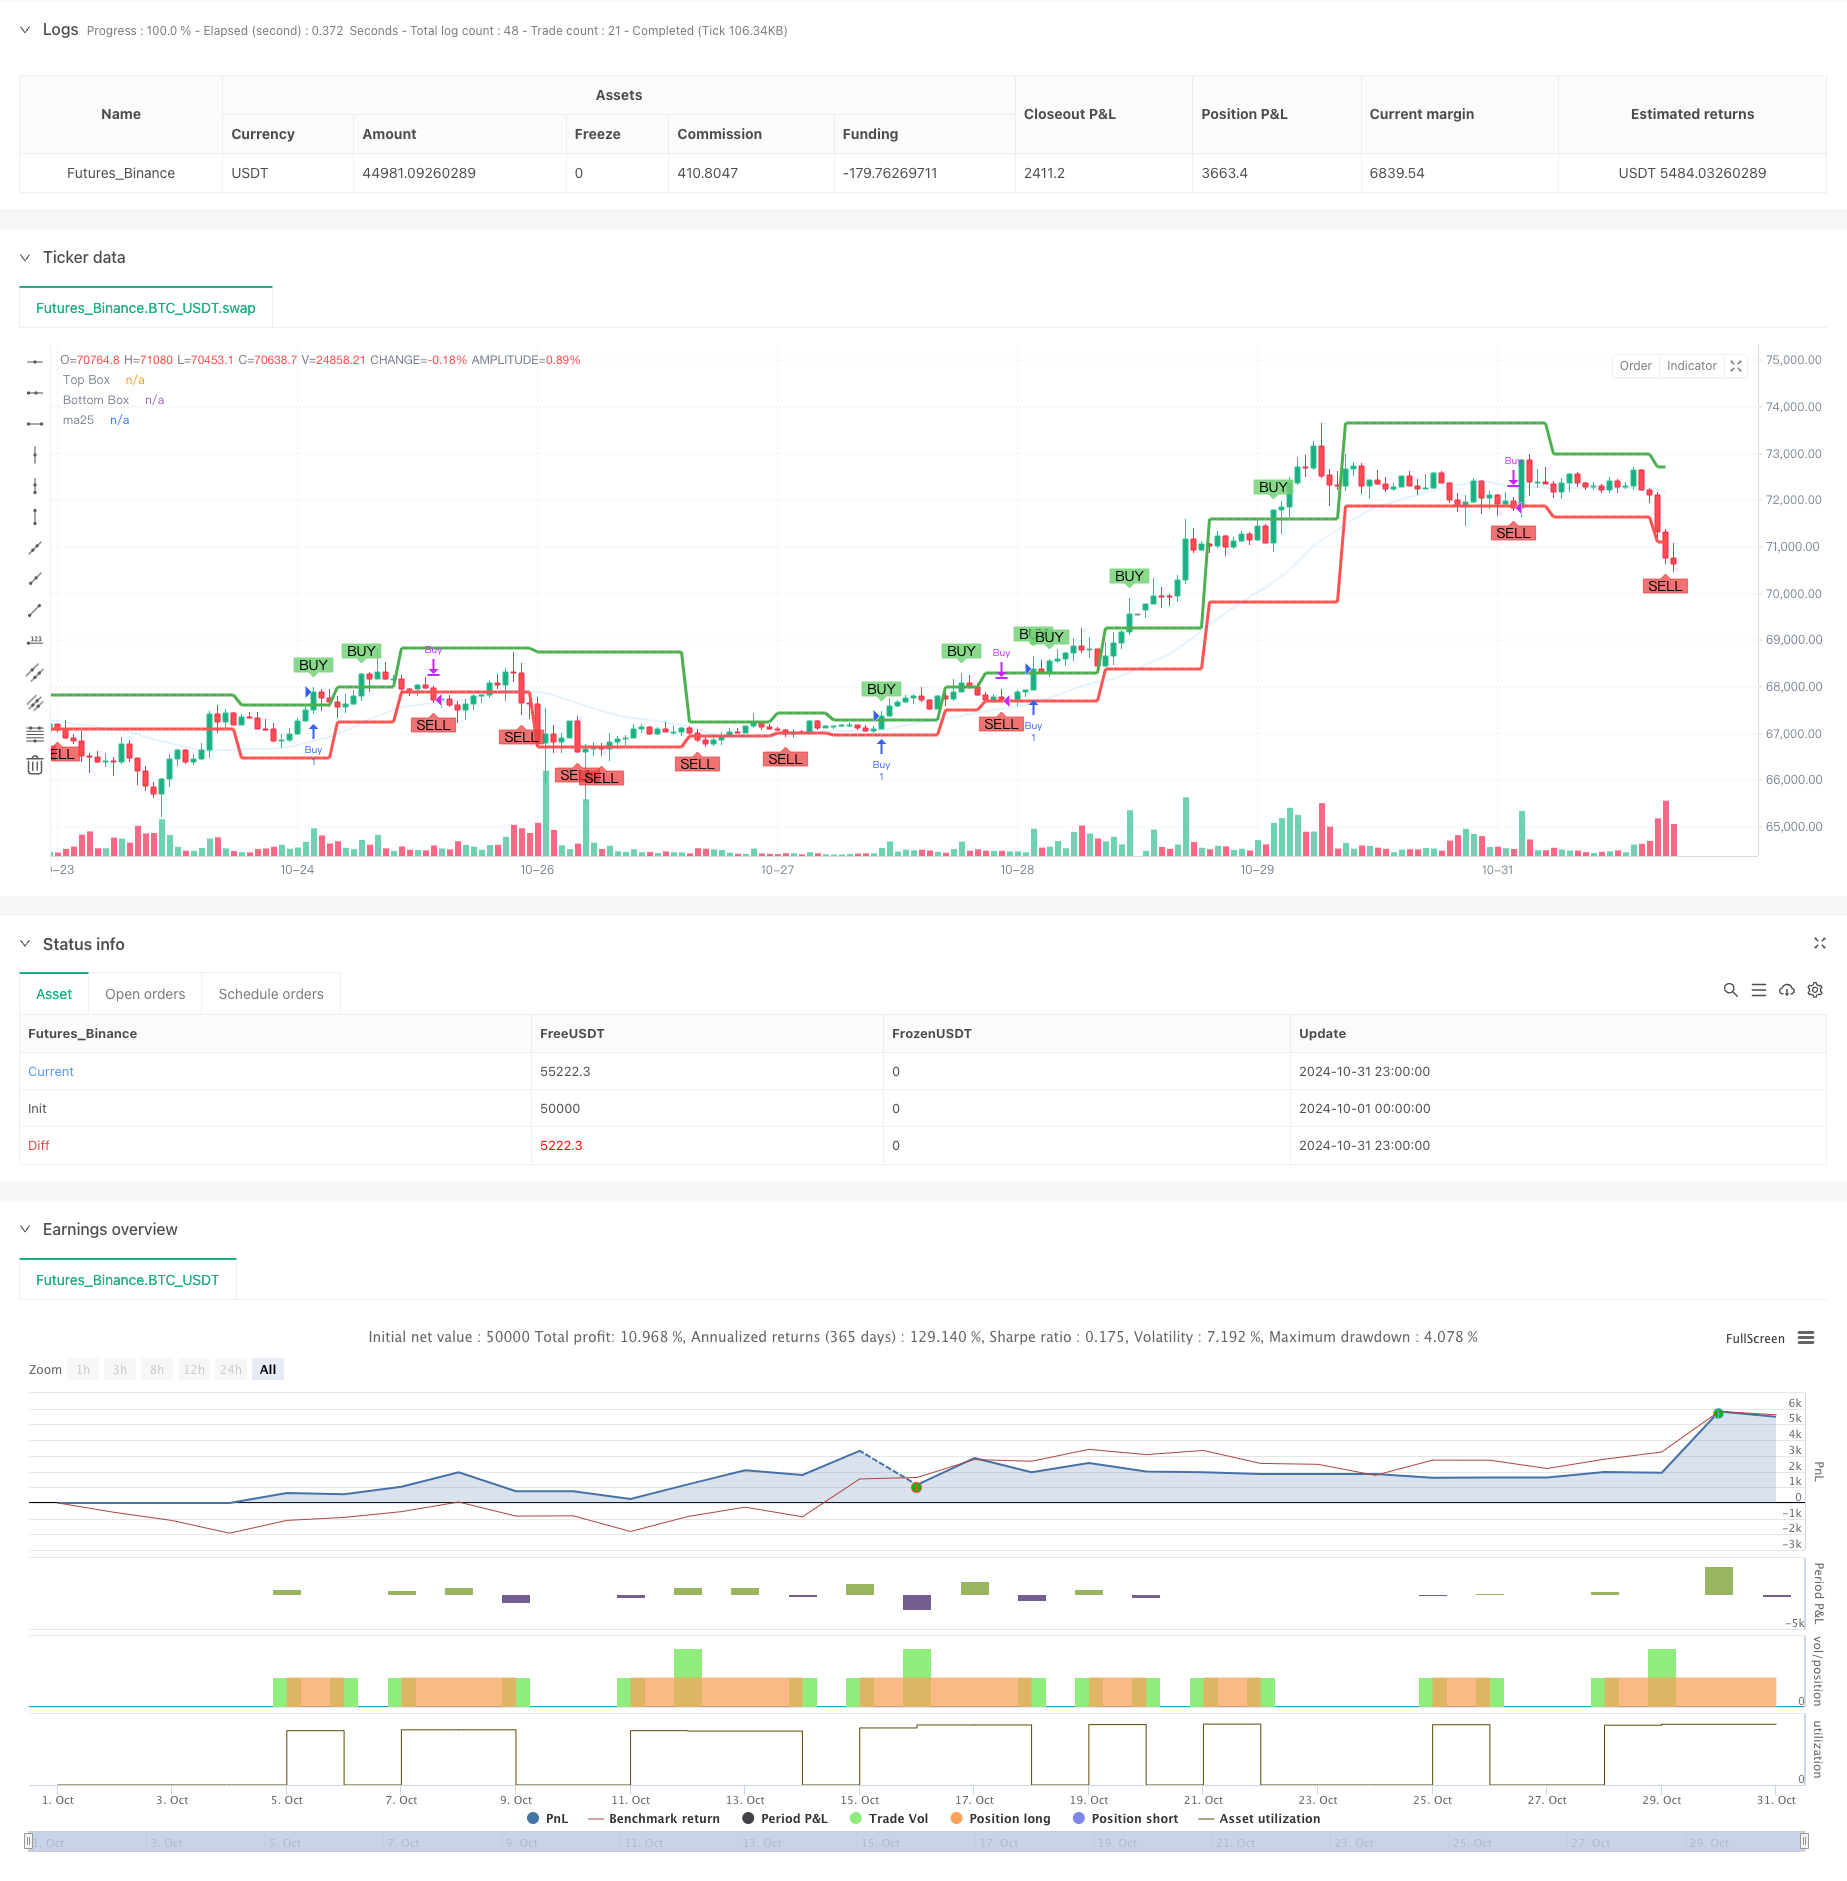
Dynamic Darvas Box Breakout with Moving Average Trend Confirmation Trading System
Author: ChaoZhang, Date: 2024-11-18 16:00:53Tags: MA25SMA

Overview
This article introduces a trend following trading system that combines Darvas Box and 25-period Moving Average (MA25). The strategy identifies price consolidation zones through box formation and confirms trends with moving averages to capture strong market movements during breakouts. The system design thoroughly considers trend continuation and false breakout filtering, providing traders with a complete framework for market entry and exit.
Strategy Principles
The strategy consists of three core components: 1. Darvas Box Construction: The system determines box boundaries by calculating the highest and lowest prices over 5 periods. The box top is determined by new highs, while the bottom is set by the lowest point within the corresponding range. 2. Moving Average Trend Confirmation: A 25-period simple moving average is introduced as a trend filter, only considering positions when price is above MA25. 3. Trade Signal Generation: - Buy Signal: Price breaks above box top and is above MA25 - Sell Signal: Price breaks below box bottom
Strategy Advantages
- Strong Trend Following Capability:
- Captures trend initiation through box breakouts
- MA25 filtering ensures trading in primary trend direction
- Signal Quality Optimization:
- Dual confirmation mechanism reduces false breakout risk
- Clear entry and exit conditions avoid subjective judgment
- Comprehensive Risk Control:
- Box bottom naturally forms stop-loss level
- MA25 provides additional trend protection
Strategy Risks
- Choppy Market Risk:
- Frequent breakouts may lead to consecutive stops
- Recommended for use in strong trend markets
- Lag Risk:
- Box formation requires time, may miss initial moves
- MA25 as medium-term average has inherent lag
- Money Management Risk:
- Requires proper allocation of capital per trade
- Suggested to dynamically adjust position size with volatility
Strategy Optimization Directions
- Parameter Optimization:
- Box period adjustable based on market characteristics
- MA period can be adjusted to market cycle features
- Signal Enhancement:
- Can add volume confirmation mechanism
- Consider implementing dynamic stop-loss
- Risk Control Enhancement:
- Add volatility filter
- Implement dynamic position sizing
Summary
The strategy builds a robust trading system by combining classic Darvas Box theory with moving average trend following. Its main advantage lies in effectively capturing trending markets while controlling risk through multiple filtering mechanisms. Although there is some inherent lag, the strategy can achieve stable performance in trending markets through proper parameter optimization and risk management. Traders are advised to focus on market environment selection and dynamically adjust parameters based on actual conditions when implementing the strategy.
/*backtest
start: 2024-10-01 00:00:00
end: 2024-10-31 23:59:59
period: 1h
basePeriod: 1h
exchanges: [{"eid":"Futures_Binance","currency":"BTC_USDT"}]
*/

//@version=5
strategy("DARVAS BOX with MA25 Buy Condition", overlay=true, shorttitle="AEG DARVAS")

// Input for box length
boxp = input.int(5, "BOX LENGTH")

// Calculate 25-period moving average
ma25 = ta.sma(close, 25)

// Lowest low and highest high within the box period
LL = ta.lowest(low, boxp)
k1 = ta.highest(high, boxp)
k2 = ta.highest(high, boxp - 1)
k3 = ta.highest(high, boxp - 2)

// New high detection
NH = ta.valuewhen(high > k1[1], high, 0)

// Logic to detect top and bottom of Darvas Box
box1 = k3 < k2
TopBox = ta.valuewhen(ta.barssince(high > k1[1]) == boxp - 2 and box1, NH, 0)
BottomBox = ta.valuewhen(ta.barssince(high > k1[1]) == boxp - 2 and box1, LL, 0)

// Plot the top and bottom Darvas Box lines
plot(TopBox, linewidth=3, color=color.green, title="Top Box")
plot(BottomBox, linewidth=3, color=color.red, title="Bottom Box")
plot(ma25, color=#2195f31e, linewidth=2, title="ma25")

// --- Buy and Sell conditions ---

// Buy when price breaks above the Darvas Box AND MA15
buyCondition = ta.crossover(close, TopBox) and close > ma25

// Sell when price drops below the Darvas Box
sellCondition = ta.crossunder(close, BottomBox)

// --- Buy and Sell Signals ---

// Plot BUY+ and SELL labels
plotshape(series=buyCondition, title="Buy+ Signal", location=location.abovebar, color=#72d174d3, style=shape.labeldown, text="BUY")
plotshape(series=sellCondition, title="Sell Signal", location=location.belowbar, color=color.rgb(234, 62, 62, 28), style=shape.labelup, text="SELL")

// --- Strategy execution ---

if (buyCondition)
    strategy.entry("Buy", strategy.long)

if (sellCondition)
    strategy.close("Buy")
- Dual Timeframe Momentum Strategy
- Dynamic Market Regime Identification Strategy Based on Linear Regression Slope
- MAHL Band
- Z Score with Signals
- Advanced Mean Reversion Trading Strategy: Dynamic Range Breakout System Based on Standard Deviation
- Dynamic Donchian Channel and Simple Moving Average Combination Quantitative Strategy
- SMA Crossover Long-Short Strategy with Peak Drawdown Control and Auto-Termination
- SMA Trend
- Multi-SMA Zone Breakout with Dynamic Profit Lock Quantitative Trading Strategy
- Adaptive Dynamic Stop-Loss and Take-Profit Strategy with SMA Crossover and Volume Filter
- Dual Moving Average Crossover Trend Following Strategy with Dynamic Stop-Loss and Take-Profit System
- Multi-Timeframe Trend Following Trading System with ATR and MACD Integration
- Dual Timeframe Supertrend RSI Intelligent Trading Strategy
- Dual MACD Price Action Breakout Trailing Strategy
- Multi-EMA Trend Momentum Recognition and Stop-Loss Trading System
- Dual EMA Volume Trend Confirmation Strategy for Quantitative Trading
- Dual EMA-RSI Crossover Strategy with Dynamic Take-Profit/Stop-Loss
- Enhanced Multi-Period Dynamic Adaptive Trend Following Trading System
- Large Volatility Breakout Dual-Direction Trading Strategy: Point-Based Threshold Entry System
- Enhanced Bollinger Mean Reversion Quantitative Strategy
- Dynamic Take-Profit Stop-Loss EMA Crossover Quantitative Trading Strategy
- Multi-EMA Crossover Trend Following Strategy with Dynamic Stop-Loss and Take-Profit Optimization
- Dual Moving Average Crossover Strategy with Dynamic Risk Management
- The two platforms hedge balancing strategy
- Dual Moving Average Crossover with Dynamic Risk Management Strategy
- Multi-MA Trend Strength Capture with Momentum Profit-Taking Strategy
- Multi-Strategy Adaptive Trend Following and Breakout Trading System
- Multi-Level Moving Average with Candlestick Pattern Recognition Trading System
- Multi-Timeframe EMA Trend Momentum Trading Strategy
- Intelligent Time-Based Long-Short Rotation Balanced Trading Strategy