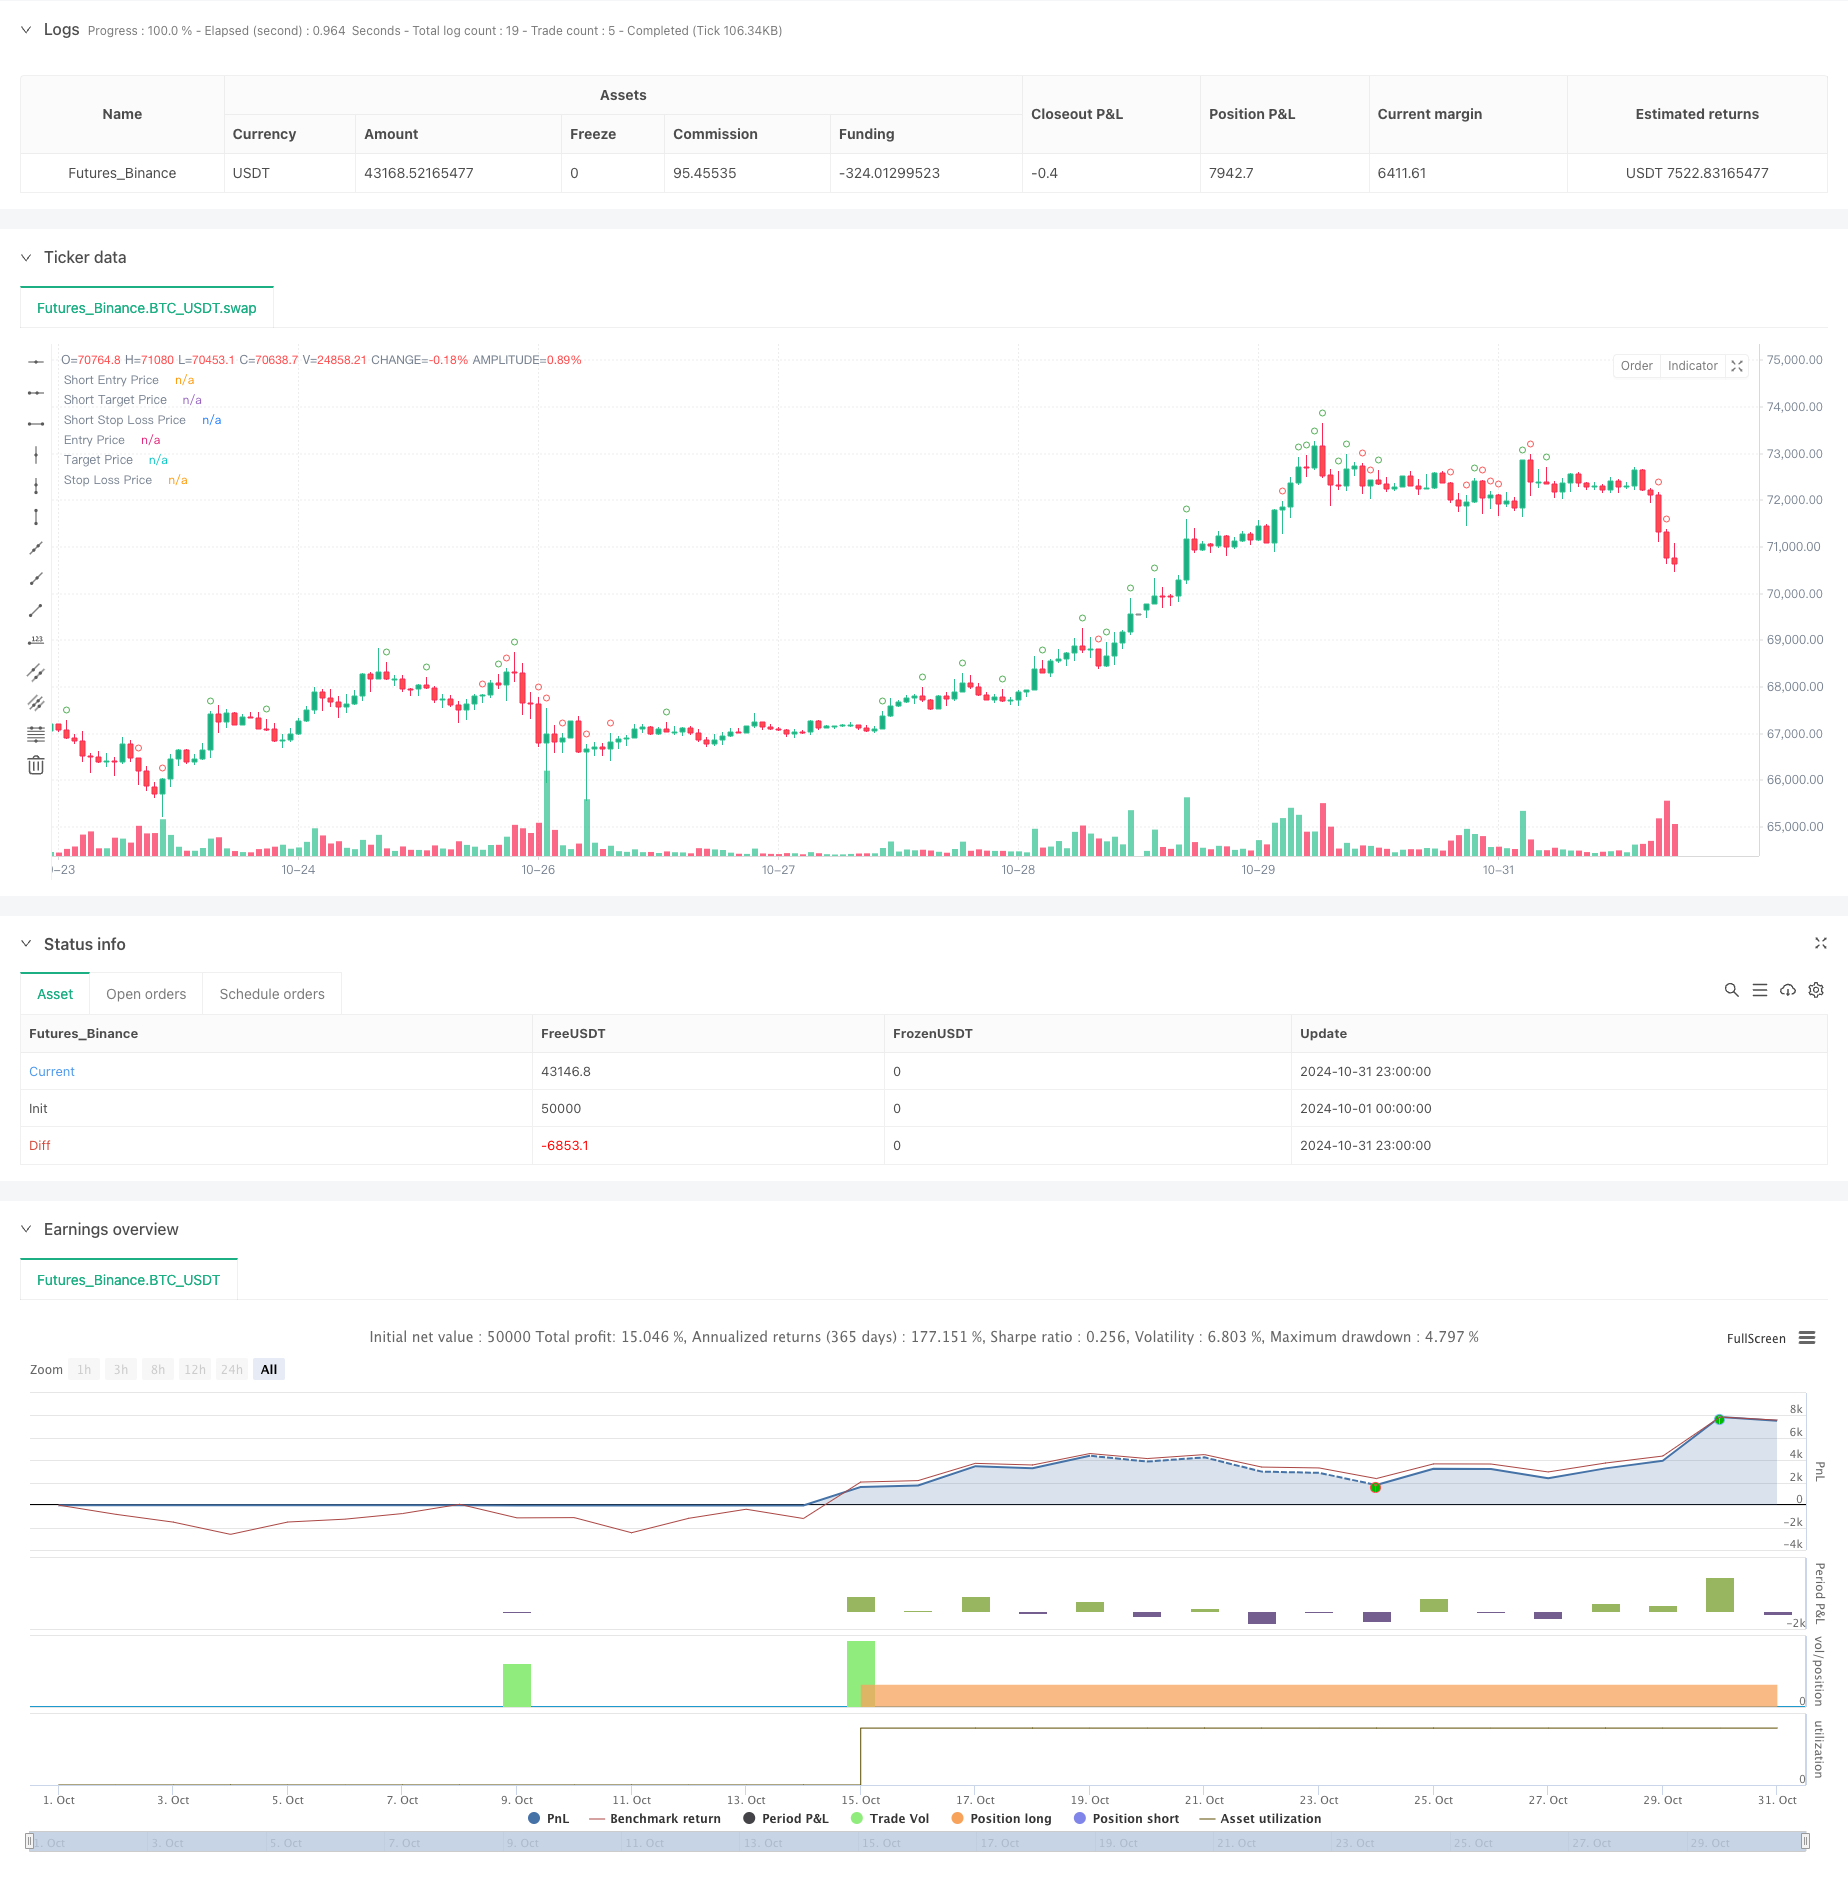
概述
该策略是一个基于30分钟K线的双向交易系统,通过监测价格波动幅度来寻找交易机会。策略核心是通过设定点位阈值来识别大幅波动,并在突破确认后进行相应方向的交易。策略包含了严格的时间管理、止盈止损和交易管理机制,以实现风险可控的自动化交易。
策略原理
策略采用多重过滤机制来识别有效的交易信号。首先,策略在每个30分钟K线收盘时计算实体的波动范围,当波动幅度超过预设阈值时,将被标记为潜在的交易机会。为确保交易的有效性,策略设置了额外的缓冲点位,只有当价格突破这个缓冲区域才会触发实际的交易信号。策略同时实现了多空双向交易,在上涨突破时做多,下跌突破时做空,并为每个交易设置相应的止盈止损位。
策略优势
- 完善的时间管理:限定交易时间窗口,避免非活跃时段的虚假信号
- 双向交易机制:可以捕捉市场双向机会,提高资金利用效率
- 风险控制完善:采用固定点位的止盈止损,便于风险评估和管理
- 自动化程度高:从信号识别到交易执行全程自动化,减少人为干预
- 灵活的参数设置:关键参数均可调整,便于适应不同市场环境
策略风险
- 假突破风险:大幅波动后可能出现假突破,导致止损出场
- 参数敏感性:阈值设置不当可能导致错过机会或过度交易
- 市场环境依赖:在震荡市场中可能频繁触发止损
- 滑点影响:在高波动期间,实际成交价可能与信号价格有较大偏差
- 资金管理风险:没有仓位管理机制可能导致风险敞口过大
策略优化方向
- 增加趋势过滤:结合更长周期的趋势指标,提高信号质量
- 动态参数优化:根据市场波动率自动调整阈值和止损参数
- 引入成交量确认:增加成交量过滤条件,提高突破可靠性
- 优化止盈止损:实现动态止盈止损,适应不同市场环境
- 加入仓位管理:根据信号强度和市场波动率动态调整仓位
总结
这是一个设计完整、逻辑清晰的自动化交易策略。通过严格的条件过滤和风险控制,策略具有较好的实用性。但仍需要在实盘中进行充分测试和优化,特别是在参数设置和风险控制方面需要根据实际市场情况进行调整。策略的成功运行需要稳定的市场环境和适当的参数配置,建议在实盘使用前进行充分的回测验证。
策略源码
/*backtest
start: 2024-10-01 00:00:00
end: 2024-10-31 23:59:59
period: 1h
basePeriod: 1h
exchanges: [{"eid":"Futures_Binance","currency":"BTC_USDT"}]
*/

//@version=5
strategy("Big Candle Breakout Strategy Both Side", overlay=true)

// Input for the point move threshold
point_move_in = input.int(100, title="Point Move Threshold")
point_target = input.int(100, title="Point Target")
point_stoploss = input.int(100, title="Point Stop Loss")
point_buffer = input.int(5, title="Point Buffer")

point_move = point_buffer + point_move_in

// Define the start and end times for trading
start_hour = 9
start_minute = 15
end_hour = 14
end_minute = 30

// Function to check if the current time is within the allowed trading window
in_time_range = (hour(time('30')) > start_hour or (hour(time('30')) == start_hour and minute(time('30')) >= start_minute)) and (hour(time('30')) < end_hour or (hour(time('30')) == end_hour and minute(time('30')) <= end_minute))

// Retrieve the open, high, low, and close prices of 30-minute candles
open_30m = request.security(syminfo.tickerid, "30", open)
high_30m = request.security(syminfo.tickerid, "30", high)
low_30m = request.security(syminfo.tickerid, "30", low)
close_30m = request.security(syminfo.tickerid, "30", close)

// Calculate the range of the candle
candle_range_long = (close_30m - open_30m)
candle_range_short = (open_30m - close_30m)

// Determine if the candle meets the criteria to be marked
big_candle_long = candle_range_long >= point_move_in
big_candle_short = candle_range_short >= point_move_in

// Variables to store the state of the trade
var float long_entry_price = na
var float long_target_price = na
var float long_stop_loss_price = na

var float short_entry_price = na
var float short_target_price = na
var float short_stop_loss_price = na

// Check if there are no active trades
no_active_trades = (strategy.opentrades == 0)

// Long entry condition
if (big_candle_long and na(long_entry_price) and in_time_range and no_active_trades)
    long_entry_price := high_30m+point_buffer
    long_target_price := long_entry_price + point_target
    long_stop_loss_price := long_entry_price - point_stoploss
    strategy.entry("Buy", strategy.long, stop=long_entry_price, limit=long_target_price)

plot(long_entry_price, style=plot.style_linebr, color=color.blue, linewidth=2, title="Entry Price")
plot(long_target_price, style=plot.style_linebr, color=color.green, linewidth=2, title="Target Price")
plot(long_stop_loss_price, style=plot.style_linebr, color=color.red, linewidth=2, title="Stop Loss Price")

// Short entry condition
if (big_candle_short and na(short_entry_price) and in_time_range and no_active_trades)
    short_entry_price := low_30m - point_buffer
    short_target_price := short_entry_price - point_target
    short_stop_loss_price := short_entry_price + point_stoploss
    strategy.entry("Sell", strategy.short, stop=short_entry_price, limit=short_target_price)

plot(short_entry_price, style=plot.style_linebr, color=color.blue, linewidth=2, title="Short Entry Price")
plot(short_target_price, style=plot.style_linebr, color=color.green, linewidth=2, title="Short Target Price")
plot(short_stop_loss_price, style=plot.style_linebr, color=color.red, linewidth=2, title="Short Stop Loss Price")

// Long exit conditions
if (not na(long_entry_price))
    strategy.exit("Long Exit", from_entry="Buy", limit=long_target_price, stop=long_stop_loss_price)

// Short exit conditions
if (not na(short_entry_price))
    strategy.exit("Short Exit", from_entry="Sell", limit=short_target_price, stop=short_stop_loss_price)

// Reset trade status
if (strategy.position_size == 0)
    long_entry_price := na
    long_target_price := na
    long_stop_loss_price := na

    short_entry_price := na
    short_target_price := na
    short_stop_loss_price := na

// Plot the big candle and entry/exit levels
plotshape(series=big_candle_long, location=location.abovebar, style=shape.circle, color=color.green)
plotshape(series=big_candle_short, location=location.abovebar, style=shape.circle, color=color.red)

//plot(long_entry_price, style=plot.style_stepline, color=color.blue, linewidth=2, title="Entry Price")
//plot(long_target_price, style=plot.style_stepline, color=color.green, linewidth=2, title="Target Price")
//plot(long_stop_loss_price, style=plot.style_stepline, color=color.red, linewidth=2, title="Stop Loss Price")
相关推荐