AI-Optimized Adaptive Stop-Loss Trading System with Multiple Technical Indicator Integration
Author: ChaoZhang, Date: 2024-11-27 15:10:57Tags: RSIBBATRSTMA

Overview
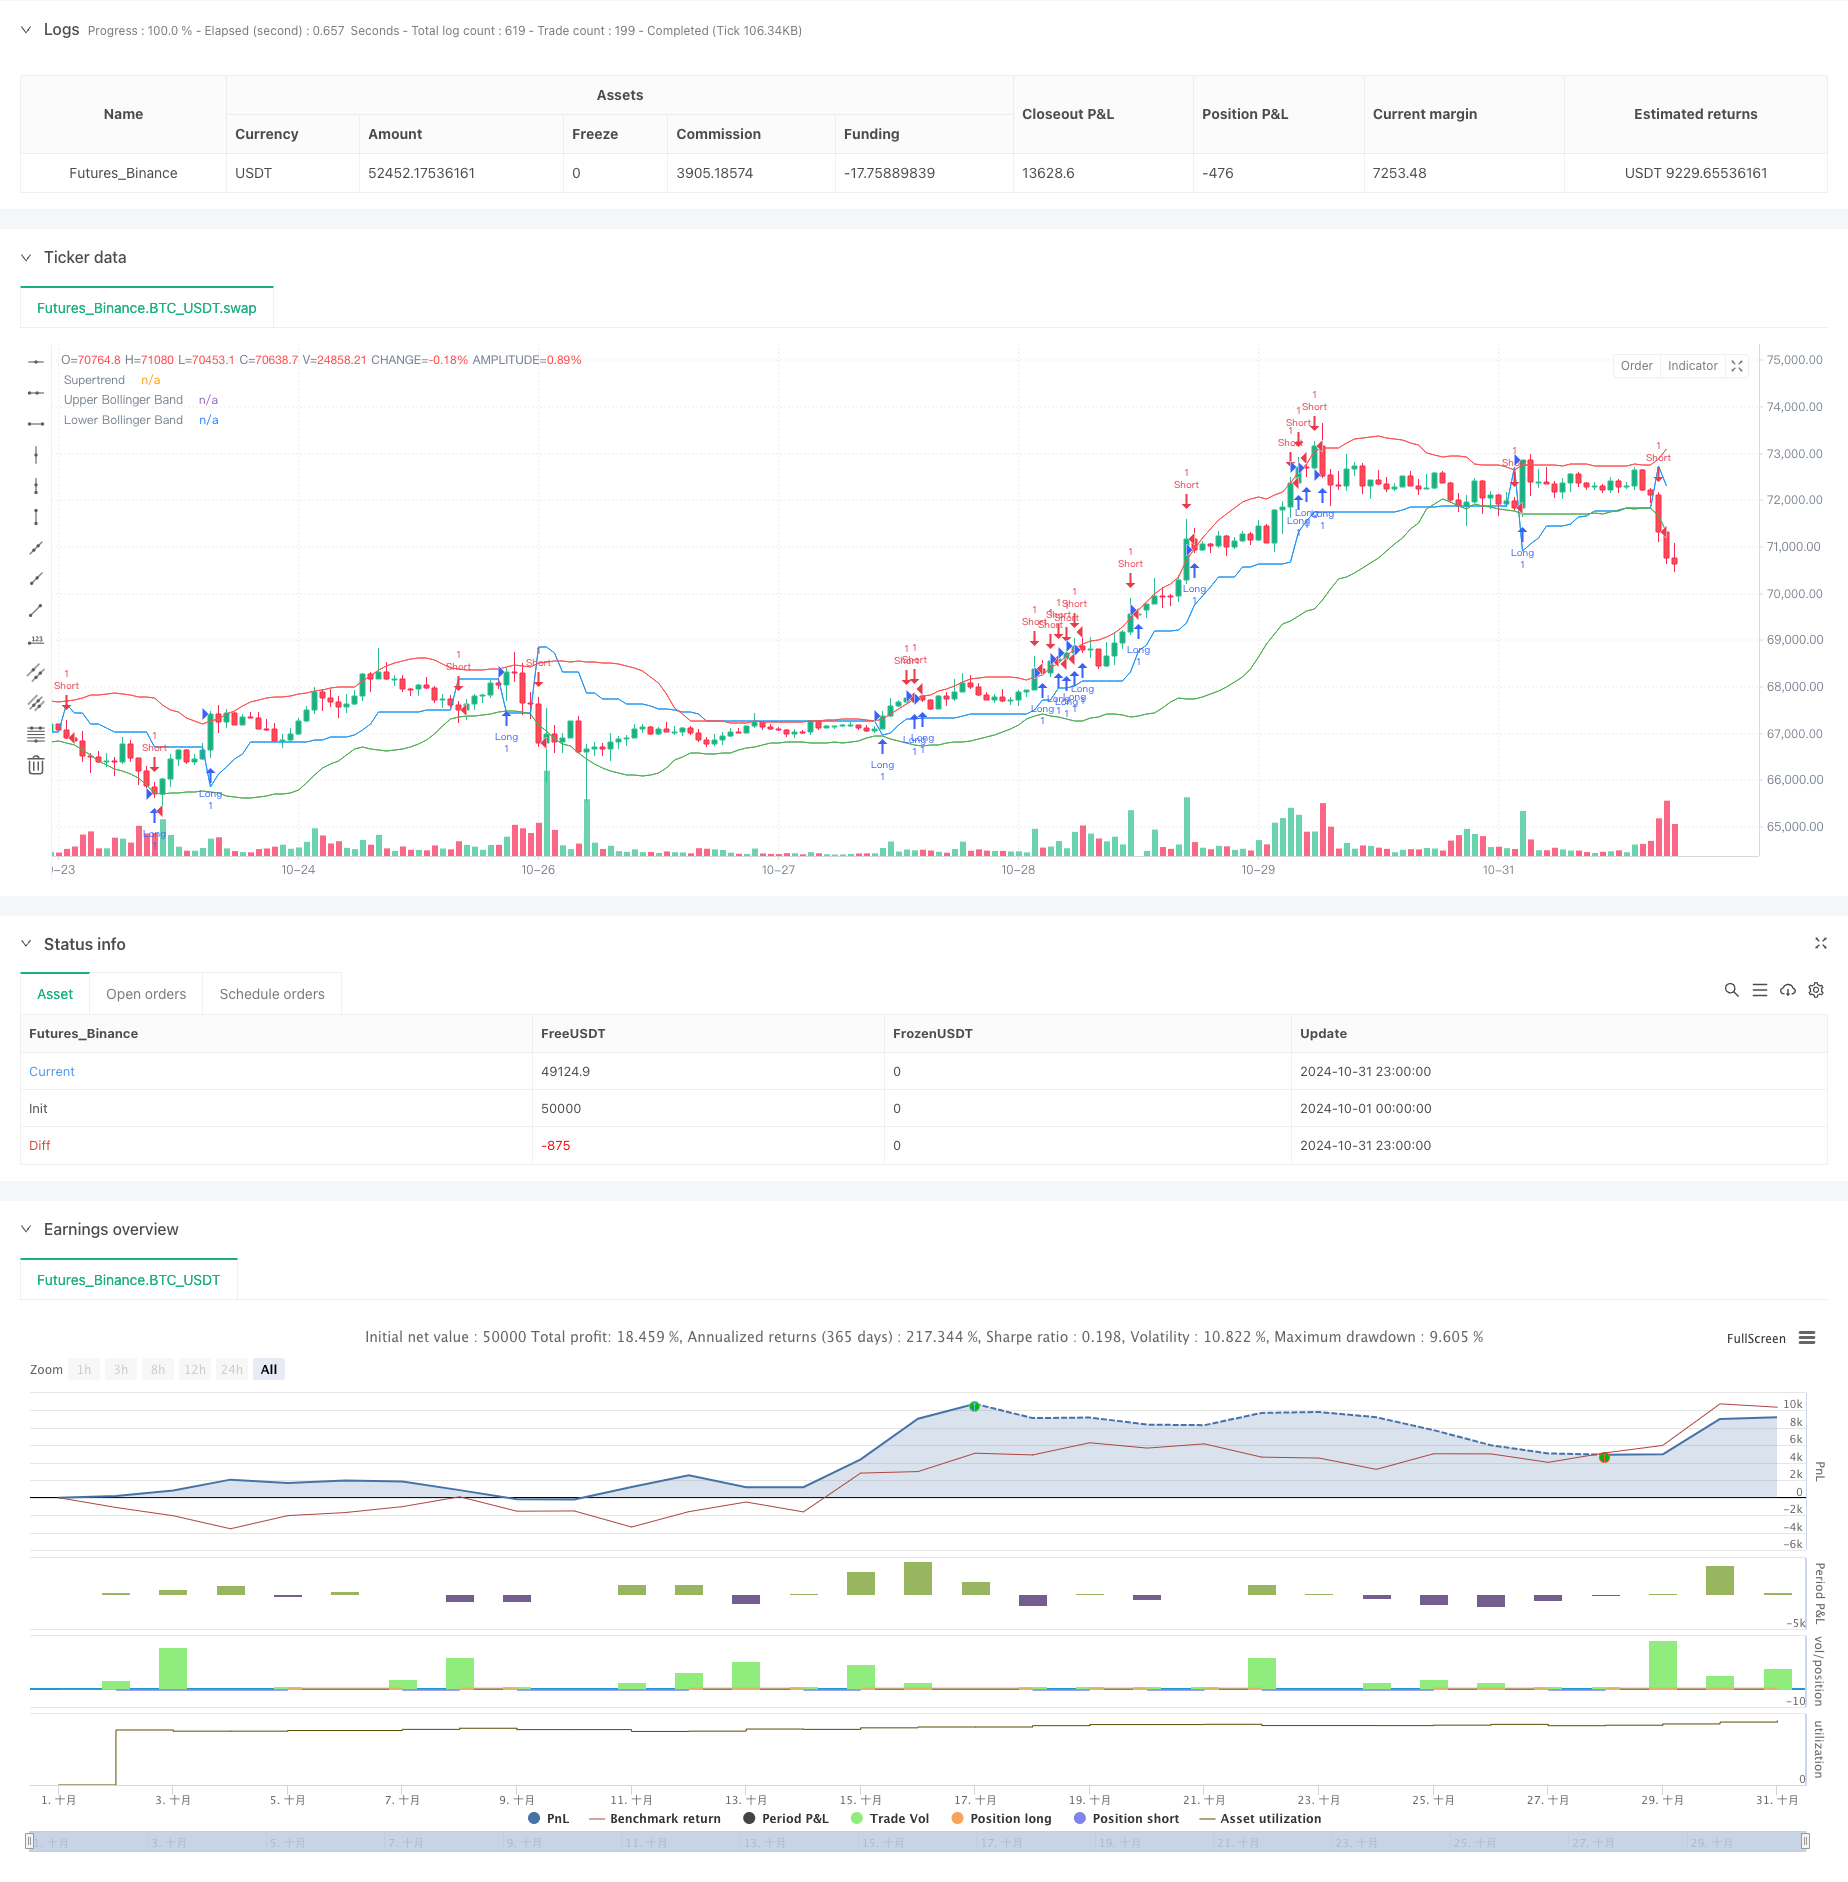
This strategy is an adaptive trading system that combines AI optimization with multiple technical indicators. It primarily uses Bollinger Bands, Relative Strength Index (RSI), and Supertrend indicators to generate trading signals, with AI optimization for parameter adjustment. The system includes an ATR-based adaptive stop-loss mechanism, allowing the strategy to automatically adjust risk management parameters based on market volatility.
Strategy Principles
The strategy employs a multi-layer filtering mechanism to determine trading signals. First, Bollinger Bands are used to identify market volatility ranges, generating long signals when price breaks below the lower band and RSI is in oversold territory. Conversely, short signals are considered when price breaks above the upper band and RSI is in overbought territory. The Supertrend indicator serves as a trend confirmation tool, executing trades only when the price-to-Supertrend relationship aligns with the trading direction. The AI module optimizes various parameters to enhance strategy adaptability. Both stop-loss and profit targets are dynamically calculated based on ATR, ensuring risk management measures adapt to changes in market volatility.
Strategy Advantages
- Multiple technical indicators reduce the impact of false signals
- AI optimization module enhances strategy adaptability and stability
- ATR-based dynamic stop-loss mechanism effectively controls risk
- Strategy parameters can be flexibly adjusted based on actual needs
- Comprehensive risk management system including stop-loss and take-profit settings
- Good visualization effects for monitoring and analysis
Strategy Risks
- Over-optimization of parameters may lead to overfitting
- Multiple indicators may generate conflicting signals during extreme volatility
- AI module requires sufficient historical data for training
- High-frequency trading may incur significant transaction costs
- Stop-losses may experience slippage during rapid market changes
- High system complexity requires regular maintenance and adjustment
Optimization Directions
- Introduce more market sentiment indicators to improve signal accuracy
- Optimize AI module training methods and parameter selection
- Add volume analysis to support decision-making
- Implement additional risk control measures
- Develop adaptive parameter adjustment mechanisms
- Optimize computational efficiency to reduce resource consumption
Summary
This is a comprehensive trading strategy that combines traditional technical analysis with modern artificial intelligence technology. Through the coordinated use of multiple technical indicators, the strategy can effectively identify market opportunities, while the AI optimization module provides strong adaptability. The dynamic stop-loss mechanism provides excellent risk control capabilities. Although there are still aspects that need optimization, the overall design approach is rational, offering good practical value and development potential.
/*backtest
start: 2024-10-01 00:00:00
end: 2024-10-31 23:59:59
period: 1h
basePeriod: 1h
exchanges: [{"eid":"Futures_Binance","currency":"BTC_USDT"}]
*/

//@version=5
strategy("AI-Optimized Crypto Trading with Trailing Stop", overlay=true, precision=4)

// Input settings for AI optimization
risk_per_trade = input.float(1.0, title="Risk per Trade (%)", minval=0.1, maxval=100) / 100
atr_period = input.int(14, title="ATR Period")  // ATR период должен быть целым числом
atr_multiplier = input.float(2.0, title="ATR Multiplier for Stop Loss")
take_profit_multiplier = input.float(2.0, title="Take Profit Multiplier")
ai_optimization = input.bool(true, title="Enable AI Optimization")

// Indicators: Bollinger Bands, RSI, Supertrend
rsi_period = input.int(14, title="RSI Period")
upper_rsi = input.float(70, title="RSI Overbought Level")
lower_rsi = input.float(30, title="RSI Oversold Level")
bb_length = input.int(20, title="Bollinger Bands Length")
bb_mult = input.float(2.0, title="Bollinger Bands Multiplier")
supertrend_factor = input.int(3, title="Supertrend Factor")  // Изменено на целое число

// Bollinger Bands
basis = ta.sma(close, bb_length)
dev = bb_mult * ta.stdev(close, bb_length)
upper_band = basis + dev
lower_band = basis - dev

// RSI
rsi = ta.rsi(close, rsi_period)

// Supertrend calculation
atr = ta.atr(atr_period)
[supertrend, _] = ta.supertrend(atr_multiplier, supertrend_factor)

// AI-based entry/exit signals (dynamic optimization)
long_signal = (rsi < lower_rsi and close < lower_band) or (supertrend[1] < close and ai_optimization)
short_signal = (rsi > upper_rsi and close > upper_band) or (supertrend[1] > close and ai_optimization)

// Trade execution with trailing stop-loss
if (long_signal)
    strategy.entry("Long", strategy.long, stop=close - atr * atr_multiplier, limit=close + atr * take_profit_multiplier)

if (short_signal)
    strategy.entry("Short", strategy.short, stop=close + atr * atr_multiplier, limit=close - atr * take_profit_multiplier)

// Plotting the MAs and Ichimoku Cloud for visualization
plot(upper_band, color=color.red, title="Upper Bollinger Band")
plot(lower_band, color=color.green, title="Lower Bollinger Band")
plot(supertrend, color=color.blue, title="Supertrend")
- Intelligent Time-Based Long-Short Rotation Balanced Trading Strategy
- Big Red Candle Breakout Buy Strategy
- Triple Supertrend and Bollinger Bands Multi-Indicator Trend Following Strategy
- Daily Range Breakout Single-Direction Trading Strategy
- No Upper Wick Bullish Candle Breakout Strategy
- Multi-Indicator Composite Trend Following Strategy
- Short-Term Trading Strategy Based on Bollinger Bands, Moving Average, and RSI
- RSI-Bollinger Bands Integration Strategy: A Dynamic Self-Adaptive Multi-Indicator Trading System
- Multi-Level Dynamic Trend Following System
- RSI-ATR Momentum Volatility Combined Trading Strategy
- Advanced Dual Moving Average Momentum Trend Following Trading System
- Dynamic Take-Profit Smart Trailing Strategy
- Multi-Timeframe Trend Following Strategy with ATR Volatility Management
- Dynamic Cost Averaging Strategy System Based on Bollinger Bands and RSI
- Multi-SMA Support Level False Breakout Strategy with ATR Stop-Loss System
- EMA Crossover Strategy with Stop Loss and Take Profit Optimization System
- VWAP-MACD-RSI Multi-Factor Quantitative Trading Strategy
- Triple Moving Average Trend Following and Momentum Integration Quantitative Trading Strategy
- Z-Score and Supertrend Based Dynamic Trading Strategy: Long-Short Switching System
- Adaptive Bollinger Breakout with Moving Average Quantitative Strategy System
- Multi-Period Moving Average Crossover with Volume Analysis System
- Dual Moving Average Momentum Tracking Quantitative Strategy
- Dual Moving Average Crossover Strategy with Adaptive Stop-Loss and Take-Profit
- Adaptive Trend Following Strategy Based on Momentum Oscillator
- PVT-EMA Trend Crossover Volume-Price Strategy
- MACD-EMA Multi-Period Dynamic Crossover Quantitative Trading System
- MACD Dynamic Oscillation Cross-Prediction Strategy
- VWAP-ATR Dynamic Price Action Trading System
- Dynamic Trend Quantitative Strategy Based on Bollinger Bands and RSI Cross
- Mean Reversion Strategy with Bollinger Bands, RSI and ATR-Based Dynamic Stop-Loss System