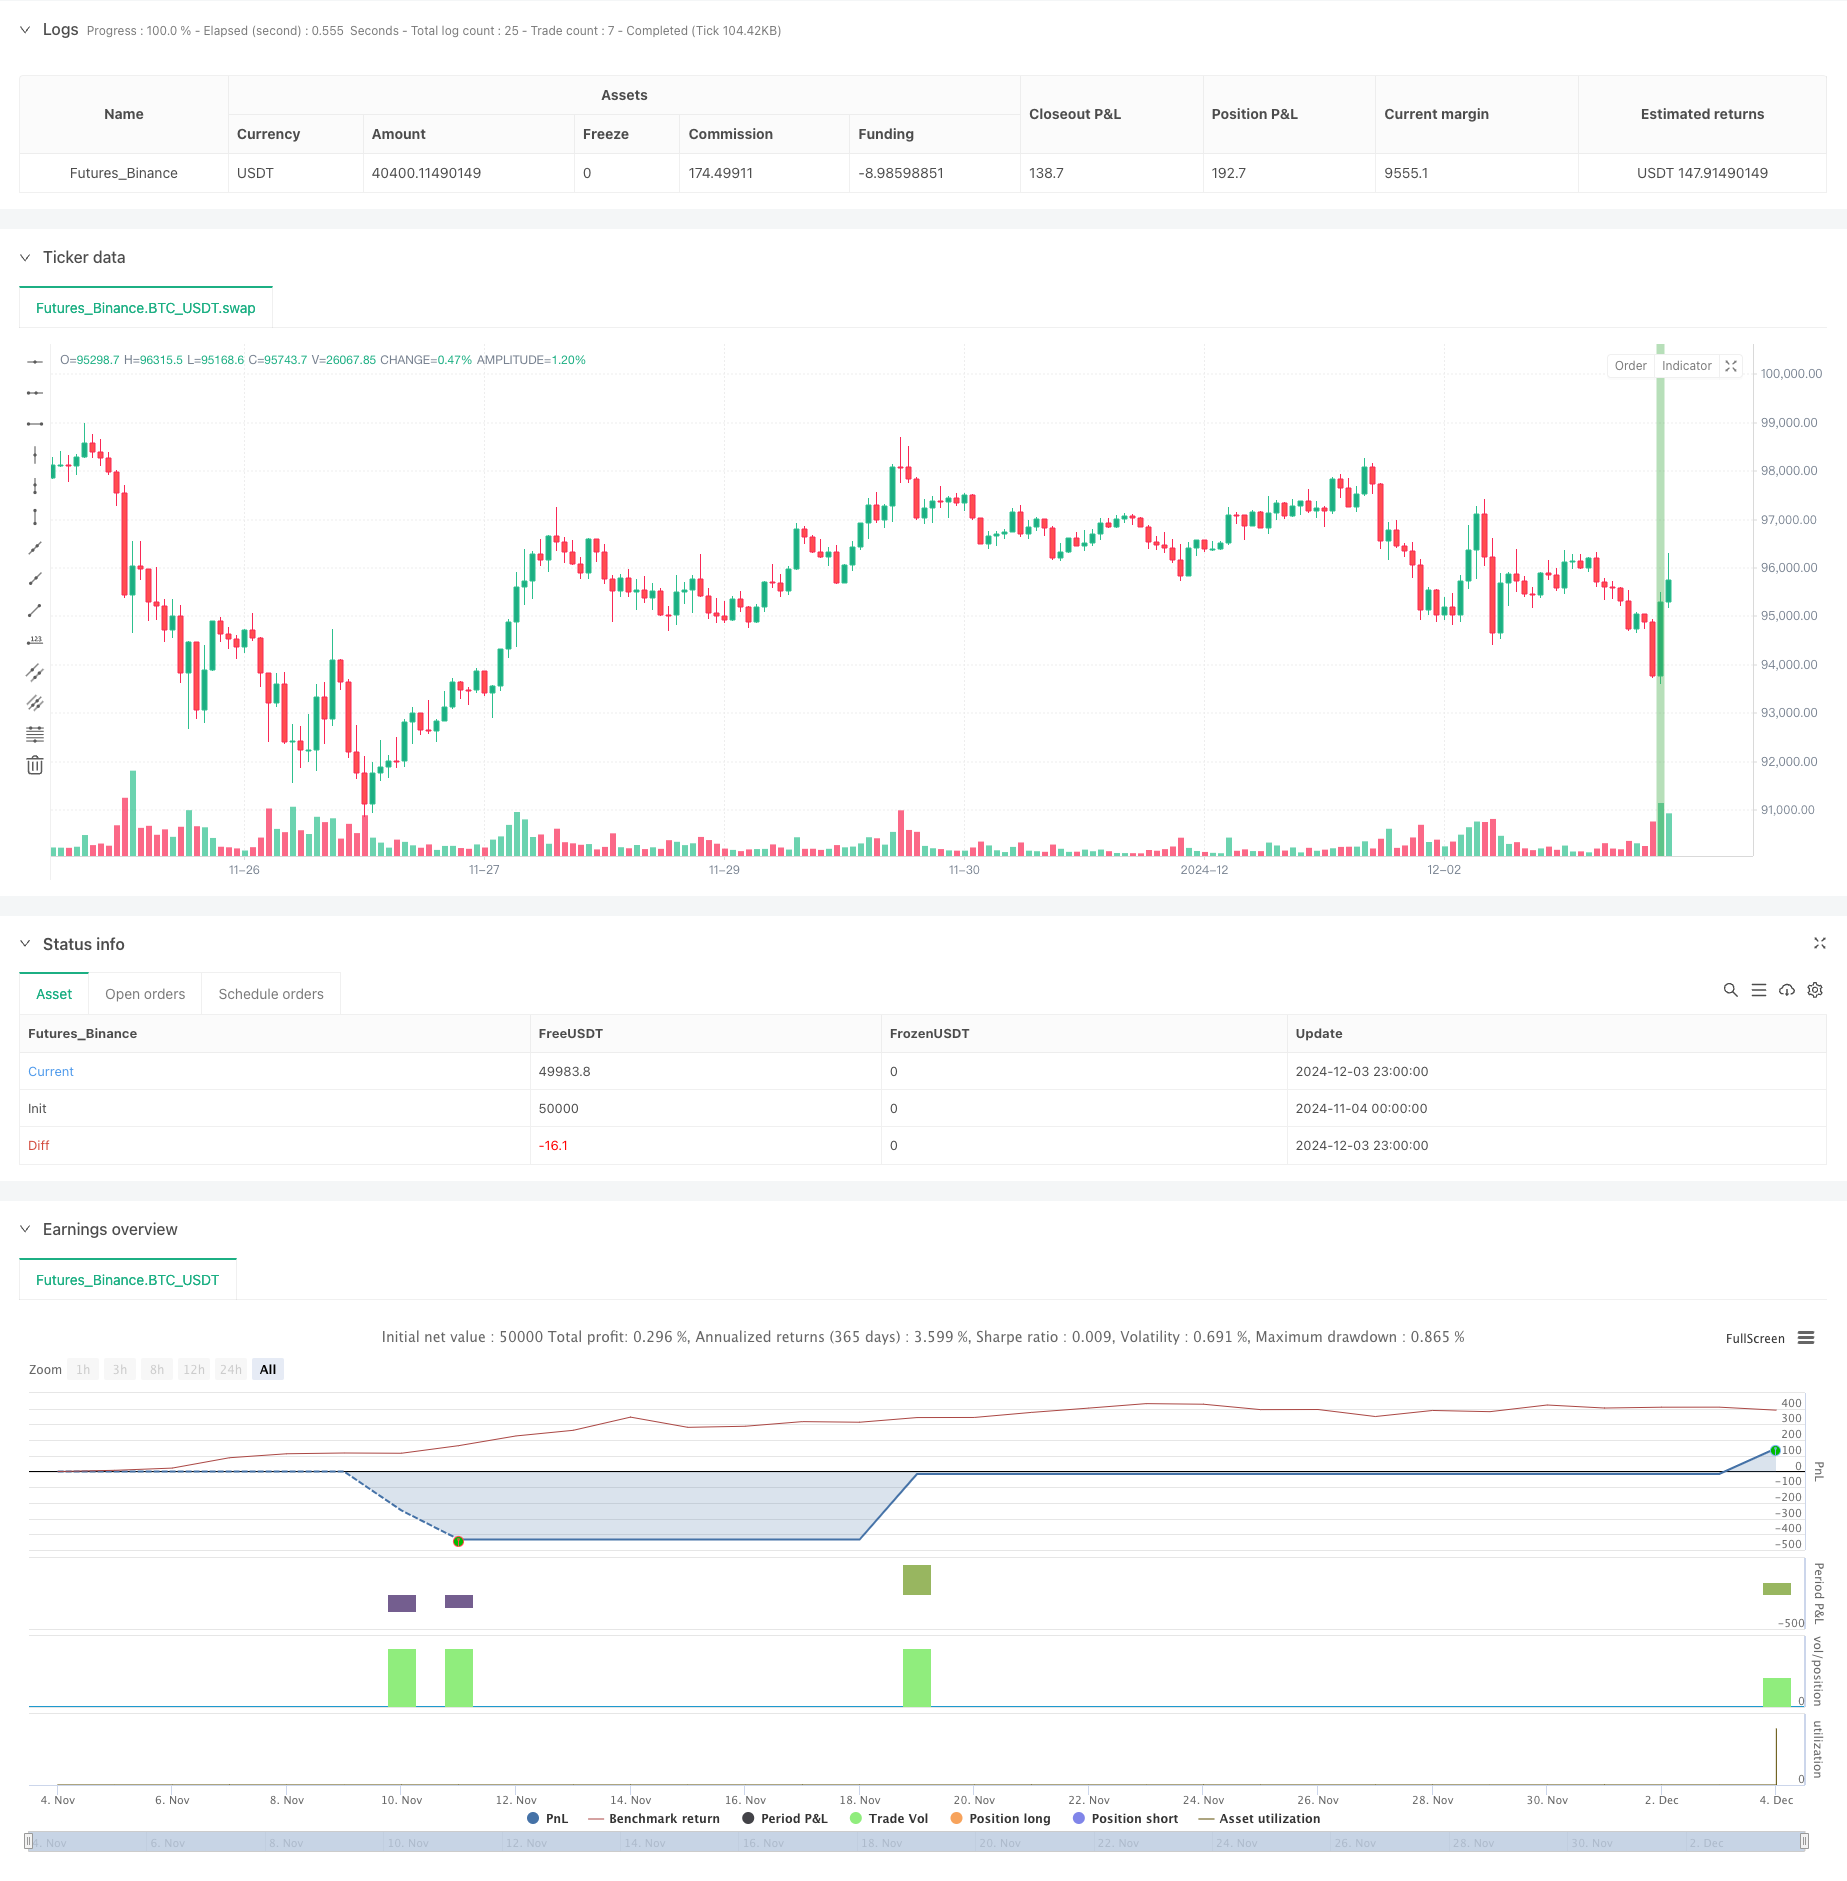
RSI Mean Reversion Breakout Strategy
Author: ChaoZhang, Date: 2024-12-05 16:53:44Tags: RSISMAATR

Strategy Overview
This strategy is a quantitative trading system based on the RSI indicator and mean reversion principles. It identifies market reversal opportunities by detecting overbought and oversold conditions, combined with price range analysis and closing price position. The core concept is to capture mean reversion opportunities after extreme market conditions, managing risk through strict entry criteria and dynamic stop-loss mechanisms.
Strategy Principles
The strategy employs multiple filtering mechanisms to determine trading signals: First, the price must make a 10-period low, indicating an oversold market condition; second, the day’s price range must be the largest in the past 10 trading days, suggesting increased market volatility; finally, it confirms potential reversal signals by checking if the closing price is in the upper quartile of the day’s range. Entry is executed through breakout confirmation, going long if price breaks above the previous high within 2 trading days after conditions are met. Stop-loss is implemented through a trailing mechanism to protect profits.
Strategy Advantages
- Multiple filtering conditions improve signal quality and reduce false signals
- Integrates multiple dimensions including technical price patterns, volatility, and momentum
- Employs trailing stop-loss mechanism for effective profit protection
- Entry mechanism uses breakout confirmation to avoid premature entry
- Trading logic is clear, easy to understand and implement
Strategy Risks
- May trigger frequent stop-losses in strong trend markets
- Strict entry conditions might miss some trading opportunities
- Requires higher trading frequency, potentially leading to higher transaction costs
- May struggle to find effective trading signals in low volatility environments
- Stop-loss settings might be too conservative, affecting overall returns
Strategy Optimization Directions
- Can introduce trend filters to pause trading in strong trend environments
- Consider adding volume indicators for additional confirmation
- Optimize stop-loss settings with dynamic adjustments based on market volatility
- Add position holding time limits to avoid prolonged oscillations
- Consider implementing multi-timeframe analysis to improve signal reliability
Summary
This is a well-structured mean reversion strategy with clear logic. Through multiple condition filtering and dynamic stop-loss management, the strategy effectively captures market oversold rebound opportunities while controlling risk. Although it has some limitations, the overall performance can be improved through reasonable optimization and refinement. Investors are advised to adjust parameters based on specific market characteristics and their risk tolerance when applying the strategy in live trading.
/*backtest
start: 2024-11-04 00:00:00
end: 2024-12-04 00:00:00
period: 1h
basePeriod: 1h
exchanges: [{"eid":"Futures_Binance","currency":"BTC_USDT"}]
*/

//@version=5
strategy("Larry Conners SMTP Strategy", overlay=true, margin_long=100, margin_short=100)

// --- Inputs ---
// Corrected the input type declaration by removing 'type='
tickSize = input.float(0.01, title="Tick Size (e.g., 1/8 for stocks)")

// --- Calculate conditions ---
// 1. Today the market must make a 10-period low
low10 = ta.lowest(low, 10)
is10PeriodLow = low == low10

// 2. Today's range must be the largest of the past 10 bars
rangeToday = high - low
maxRange10 = ta.highest(high - low, 10)
isLargestRange = rangeToday == maxRange10

// 3. Today's close must be in the top 25 percent of today's range
rangePercent = (close - low) / rangeToday
isCloseInTop25 = rangePercent >= 0.75

// Combine all buy conditions
buyCondition = is10PeriodLow and isLargestRange and isCloseInTop25

// --- Buy Entry (on the next day) ---
var float buyPrice = na
var bool orderPending = false
var float stopLoss = na  // Initialize stopLoss at the top level to avoid 'Undeclared identifier' errors

if (buyCondition and strategy.position_size == 0)
    buyPrice := high + tickSize
    stopLoss := low
    orderPending := true

// Condition to place buy order the next day or the day after
if orderPending and ta.barssince(buyCondition) <= 2
    strategy.entry("Buy", strategy.long, stop=buyPrice)
    orderPending := false

// --- Stop-Loss and Trailing Stop ---
if (strategy.position_size > 0)
    stopLoss := math.max(stopLoss, low) // Move stop to higher lows (manual trailing)
    strategy.exit("Exit", from_entry="Buy", stop=stopLoss)

// --- Plotting ---
// Highlight buy conditions
bgcolor(buyCondition ? color.new(color.green, 50) : na)
//plotshape(series=buyCondition, location=location.belowbar, color=color.green, style=shape.labelup, text="Buy Setup")

// Plot Stop-Loss level for visualization
//plot(strategy.position_size > 0 ? stopLoss : na, color=color.red, linewidth=2, title="Stop-Loss Level")
- Z-Score and Supertrend Based Dynamic Trading Strategy: Long-Short Switching System
- Advanced Dynamic Trailing Stop with Risk-Reward Targeting Strategy
- RSI Dynamic Stop-Loss Intelligent Trading Strategy
- Moving Average Crossover with Trailing Stop Loss Strategy
- Short-term Quantitative Trading Strategy Based on Dual Moving Average Crossover, RSI, and Stochastic Indicators
- Dynamic Trend Following Strategy with Machine Learning Enhanced Risk Management
- Multi-Indicator Intelligent Pyramiding Strategy
- High-Precision RSI and Bollinger Bands Breakout Strategy with Optimized Risk-Reward Ratio
- Dual Moving Average Cross RSI Momentum Strategy with Risk-Reward Optimization System
- Multi-Indicator Dynamic Adaptive Position Sizing with ATR Volatility Strategy
- Advanced Long-Only Dynamic Trendline Breakout Strategy
- Multi-Level Intelligent Dynamic Trailing Stop Strategy Based on Bollinger Bands and ATR
- Dynamic Dual EMA Crossover Strategy with Adaptive Profit/Loss Control
- Bollinger Bands and RSI Combined Dynamic Trading Strategy
- RSI-ATR Momentum Volatility Combined Trading Strategy
- Dual EMA Trend-Following Strategy with Limit Buy Entry
- Multi-Strategy Technical Analysis Trading System
- Multi-Timeframe Combined Candlestick Pattern Recognition Trading Strategy
- Triple Bollinger Bands Touch Trend Following Quantitative Trading Strategy
- Multi-Dimensional Dynamic Breakout Trading System Based on Bollinger Bands and RSI
- Dual EMA Crossover Momentum Trend Following Strategy
- Multi-Step ATR Trading Strategy with Dynamic Profit Taking
- Dual Timeframe Dynamic Support Trading System
- Multi-Period Moving Average and RSI Momentum Cross Trend Following Strategy
- Financial Asset MFI-Based Oversold Zone Exit and Signal Averaging System
- Multi-EMA Crossover with Momentum Indicators Trading Strategy
- MACD-KDJ Combined Martingale Pyramiding Quantitative Trading Strategy
- Multi-Pattern Recognition and SR Level Trading Strategy
- G-Channel and EMA Trend Filter Trading System
- Dynamic Stop-Loss Multi-Period RSI Trend Following Strategy