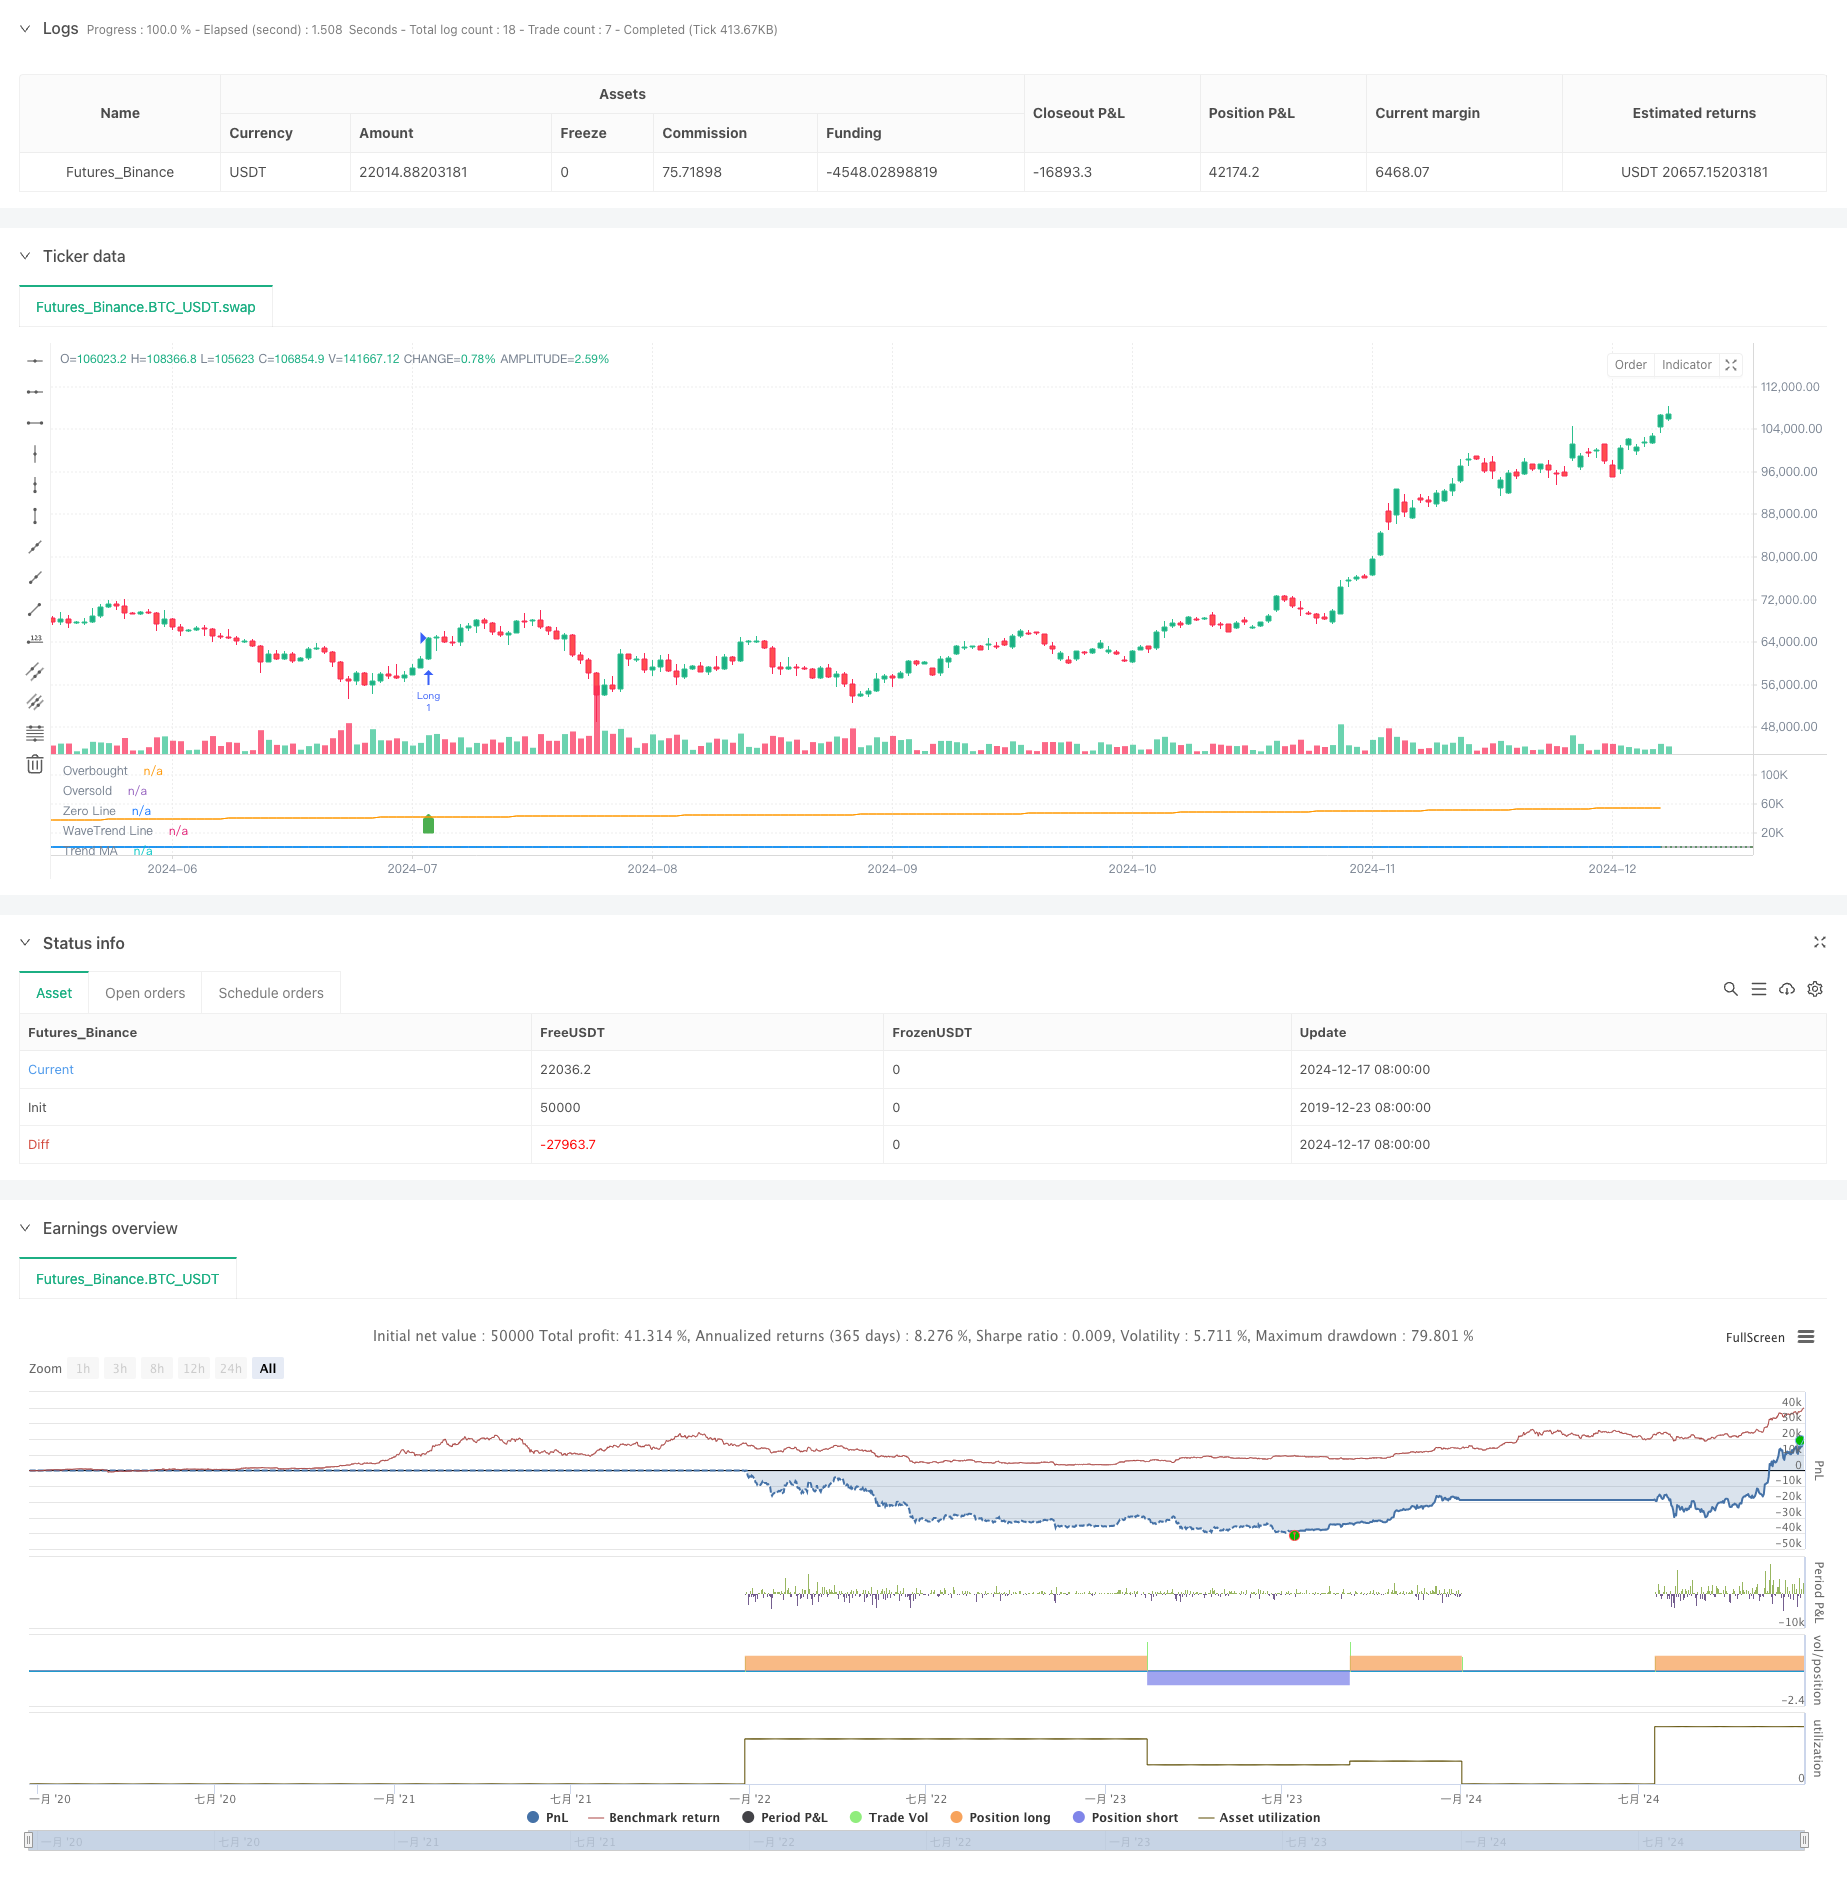
Dynamic Wave-Trend Tracking Strategy
Author: ChaoZhang, Date: 2024-12-20 16:17:27Tags: EMASMAHLCMA

Overview
This strategy is a quantitative trading system based on the WaveTrend indicator and trend following. It combines the WaveTrend indicator with moving averages to form a complete trading decision framework. The strategy utilizes EMA and SMA to calculate wave trend values and overall market trends, identifies market turning points through overbought and oversold thresholds, and incorporates trend filters to improve trading accuracy.
Strategy Principle
The strategy’s core is implemented through the following steps:
- Calculate HLC average price (average of high, low, and closing prices)
- Smooth the HLC average using EMA to obtain the ESA line
- Calculate and smooth the deviation between HLC average and ESA line using EMA
- Calculate K value based on deviation and smooth twice with EMA to get the final TCI line
- Use SMA to calculate long-term trend line as trend filter
- Generate trading signals when TCI line breaks through overbought/oversold levels and aligns with trend direction
Strategy Advantages
- High signal reliability: Effectively reduces false signals by combining WaveTrend indicator and trend filter
- Comprehensive risk control: Clear overbought/oversold thresholds for timely stop-loss
- Strong adaptability: Strategy parameters can be flexibly adjusted for different market conditions
- Clear operational logic: Explicit entry and exit conditions, easy to execute
- Comprehensive analysis: Considers both short-term fluctuations and long-term trends, improving trading stability
Strategy Risks
- Trend reversal risk: May lag in volatile markets
- Parameter sensitivity: Different parameter combinations may lead to drastically different results
- Market adaptability: May generate frequent trades in ranging markets
- Capital management: Requires reasonable position control to handle market volatility
- Technical dependence: Reliance on technical indicators may overlook fundamental factors
Strategy Optimization Directions
- Add volatility filter: Adjust trading thresholds during high volatility periods
- Incorporate multi-timeframe analysis: Combine signals from different timeframes to improve accuracy
- Optimize parameter adaptation: Dynamically adjust indicator parameters based on market conditions
- Improve profit/loss management: Add dynamic take-profit and stop-loss mechanisms
- Add volume confirmation: Incorporate volume analysis to enhance signal reliability
Summary
The strategy constructs a robust trading system by cleverly combining the WaveTrend indicator with trend filters. While maintaining operational simplicity, it achieves comprehensive market analysis. Although certain risks exist, the strategy has good practical value and development potential through proper risk management and continuous optimization.
/*backtest
start: 2019-12-23 08:00:00
end: 2024-12-18 08:00:00
period: 1d
basePeriod: 1d
exchanges: [{"eid":"Futures_Binance","currency":"BTC_USDT"}]
*/

// This Pine Script™ code is subject to the terms of the Mozilla Public License 2.0 at https://mozilla.org/MPL/2.0/
// © mojomarv

//@version=6
strategy("WaveTrend with Trend Filter", shorttitle="WaveTrend Trend", overlay=false, initial_capital = 100000)

// Inputs for the WaveTrend indicator
inputLength = input.int(10, title="Channel Length", minval=1)
avgLength = input.int(21, title="Average Length", minval=1)
obLevel = input.float(45, title="Overbought Level")
osLevel = input.float(-45, title="Oversold Level")
showSignals = input.bool(true, title="Show Buy/Sell Signals")

// Trend filter input
maLength = input.int(500, title="Trend MA Length", minval=1)

// Calculate WaveTrend values
hlc_avg = (high + low + close) / 3  // Renamed from hlc3 to hlc_avg
esa = ta.ema(hlc_avg, inputLength)
d = ta.ema(math.abs(hlc_avg - esa), inputLength)
k = (hlc_avg - esa) / (0.015 * d)
ci = ta.ema(k, avgLength)
tci = ta.ema(ci, avgLength)

// Moving average for trend detection
trendMA = ta.sma(close, maLength)

// Determine trend
bullishTrend = close > trendMA
bearishTrend = close < trendMA

// Generate signals with trend filter
crossUp = ta.crossover(tci, osLevel)
crossDown = ta.crossunder(tci, obLevel)

// Plot WaveTrend
plot(tci, title="WaveTrend Line", color=color.new(color.blue, 0), linewidth=2)
hline(obLevel, "Overbought", color=color.red, linestyle=hline.style_dotted)
hline(osLevel, "Oversold", color=color.green, linestyle=hline.style_dotted)
hline(0, "Zero Line", color=color.gray, linestyle=hline.style_solid)

// Plot moving average for trend visualization
plot(trendMA, title="Trend MA", color=color.orange, linewidth=1)

// Plot buy and sell signals
plotshape(showSignals and crossUp, title="Buy Signal", location=location.belowbar, style=shape.labelup, color=color.new(color.green, 0), size=size.small)
plotshape(showSignals and crossDown, title="Sell Signal", location=location.abovebar, style=shape.labeldown, color=color.new(color.red, 0), size=size.small)

// Alerts
alertcondition(crossUp, title="Buy Alert", message="WaveTrend Buy Signal (Trend Confirmed)")
alertcondition(crossDown, title="Sell Alert", message="WaveTrend Sell Signal (Trend Confirmed)")
alertcondition(bullishTrend, title="bull", message="WaveTrend Sell Signal (Trend Confirmed)")
alertcondition(bearishTrend, title="bear", message="WaveTrend Sell Signal (Trend Confirmed)")

// Strategy logic
if crossUp and bullishTrend
    strategy.entry("Long", strategy.long)

if crossDown
    strategy.close("Long")

if crossDown and bearishTrend
    strategy.entry("Short", strategy.short)

if crossUp
    strategy.close("Short")
- MA, SMA, MA Slope, Trailing Stop Loss, Re-Entry
- Dynamic Trend Following Multi-Period Moving Average Crossover Strategy
- Dynamic Fibonacci Retracement Trading Strategy
- Bollinger Awesome Alert R1
- Multi-Technical Indicator Trend Following Strategy with Ichimoku Cloud Breakout and Stop-Loss System
- Multi-Level Fibonacci EMA Trend Following Strategy
- Dual Dynamic Indicator Optimization Strategy
- MACD and Martingale Combination Strategy for Optimized Long Trading
- Dual Moving Average MACD Crossover Date-Adjustable Quantitative Trading Strategy
- MACD Multi-Interval Dynamic Stop-Loss and Take-Profit Trading System
- Multi-Period RSI Divergence with Support/Resistance Quantitative Trading Strategy
- Adaptive Trend Following Strategy with Dynamic Drawdown Control System
- Multi-EMA Golden Cross Strategy with Tiered Take-Profit
- Multi-Technical Indicator Cross-Trend Tracking Strategy: RSI and Stochastic RSI Synergy Trading System
- Dynamic Buy Entry Strategy Combining EMA Crossing and Candle Body Penetration
- Intelligent Wave-Trend Dollar Cost Averaging Cyclical Trading Strategy
- MACD-RSI Crossover Trend Following Strategy with Bollinger Bands Optimization System
- Adaptive EMA Dynamic Position Break-out Trading Strategy
- Multi-Indicator Dynamic Trading Optimization Strategy
- Multi-SMA Zone Breakout with Dynamic Profit Lock Quantitative Trading Strategy
- Break of Structure with Volume Confirmation Multi-Condition Intelligent Trading Strategy
- Multi-Indicator Dynamic Stop-Loss Momentum Trend Trading Strategy
- Multi-Condition Trend Following Quantitative Trading Strategy Based on Fibonacci Retracement Levels
- Multi-Moving Average Trend Following Trading Strategy
- Multi-Filter Trend Breakthrough Smart Moving Average Trading Strategy
- Dynamic EMA Breakthrough and Reversal Strategy
- Dynamic Trend Momentum Optimization Strategy with G-Channel Indicator
- Multi-level ATH Dynamic Tracking Triple-Entry Strategy
- Adaptive VWAP Bands with Garman-Klass Volatility Dynamic Tracking Strategy
- Multi-Indicator Trend Following Options Trading EMA Cross Strategy