Efficient Price Channel Trading Strategy Based on 15-Minute Breakout
Author: ChaoZhang, Date: 2025-01-17 14:49:53Tags: MARSICCIATRFCHFCL

Overview
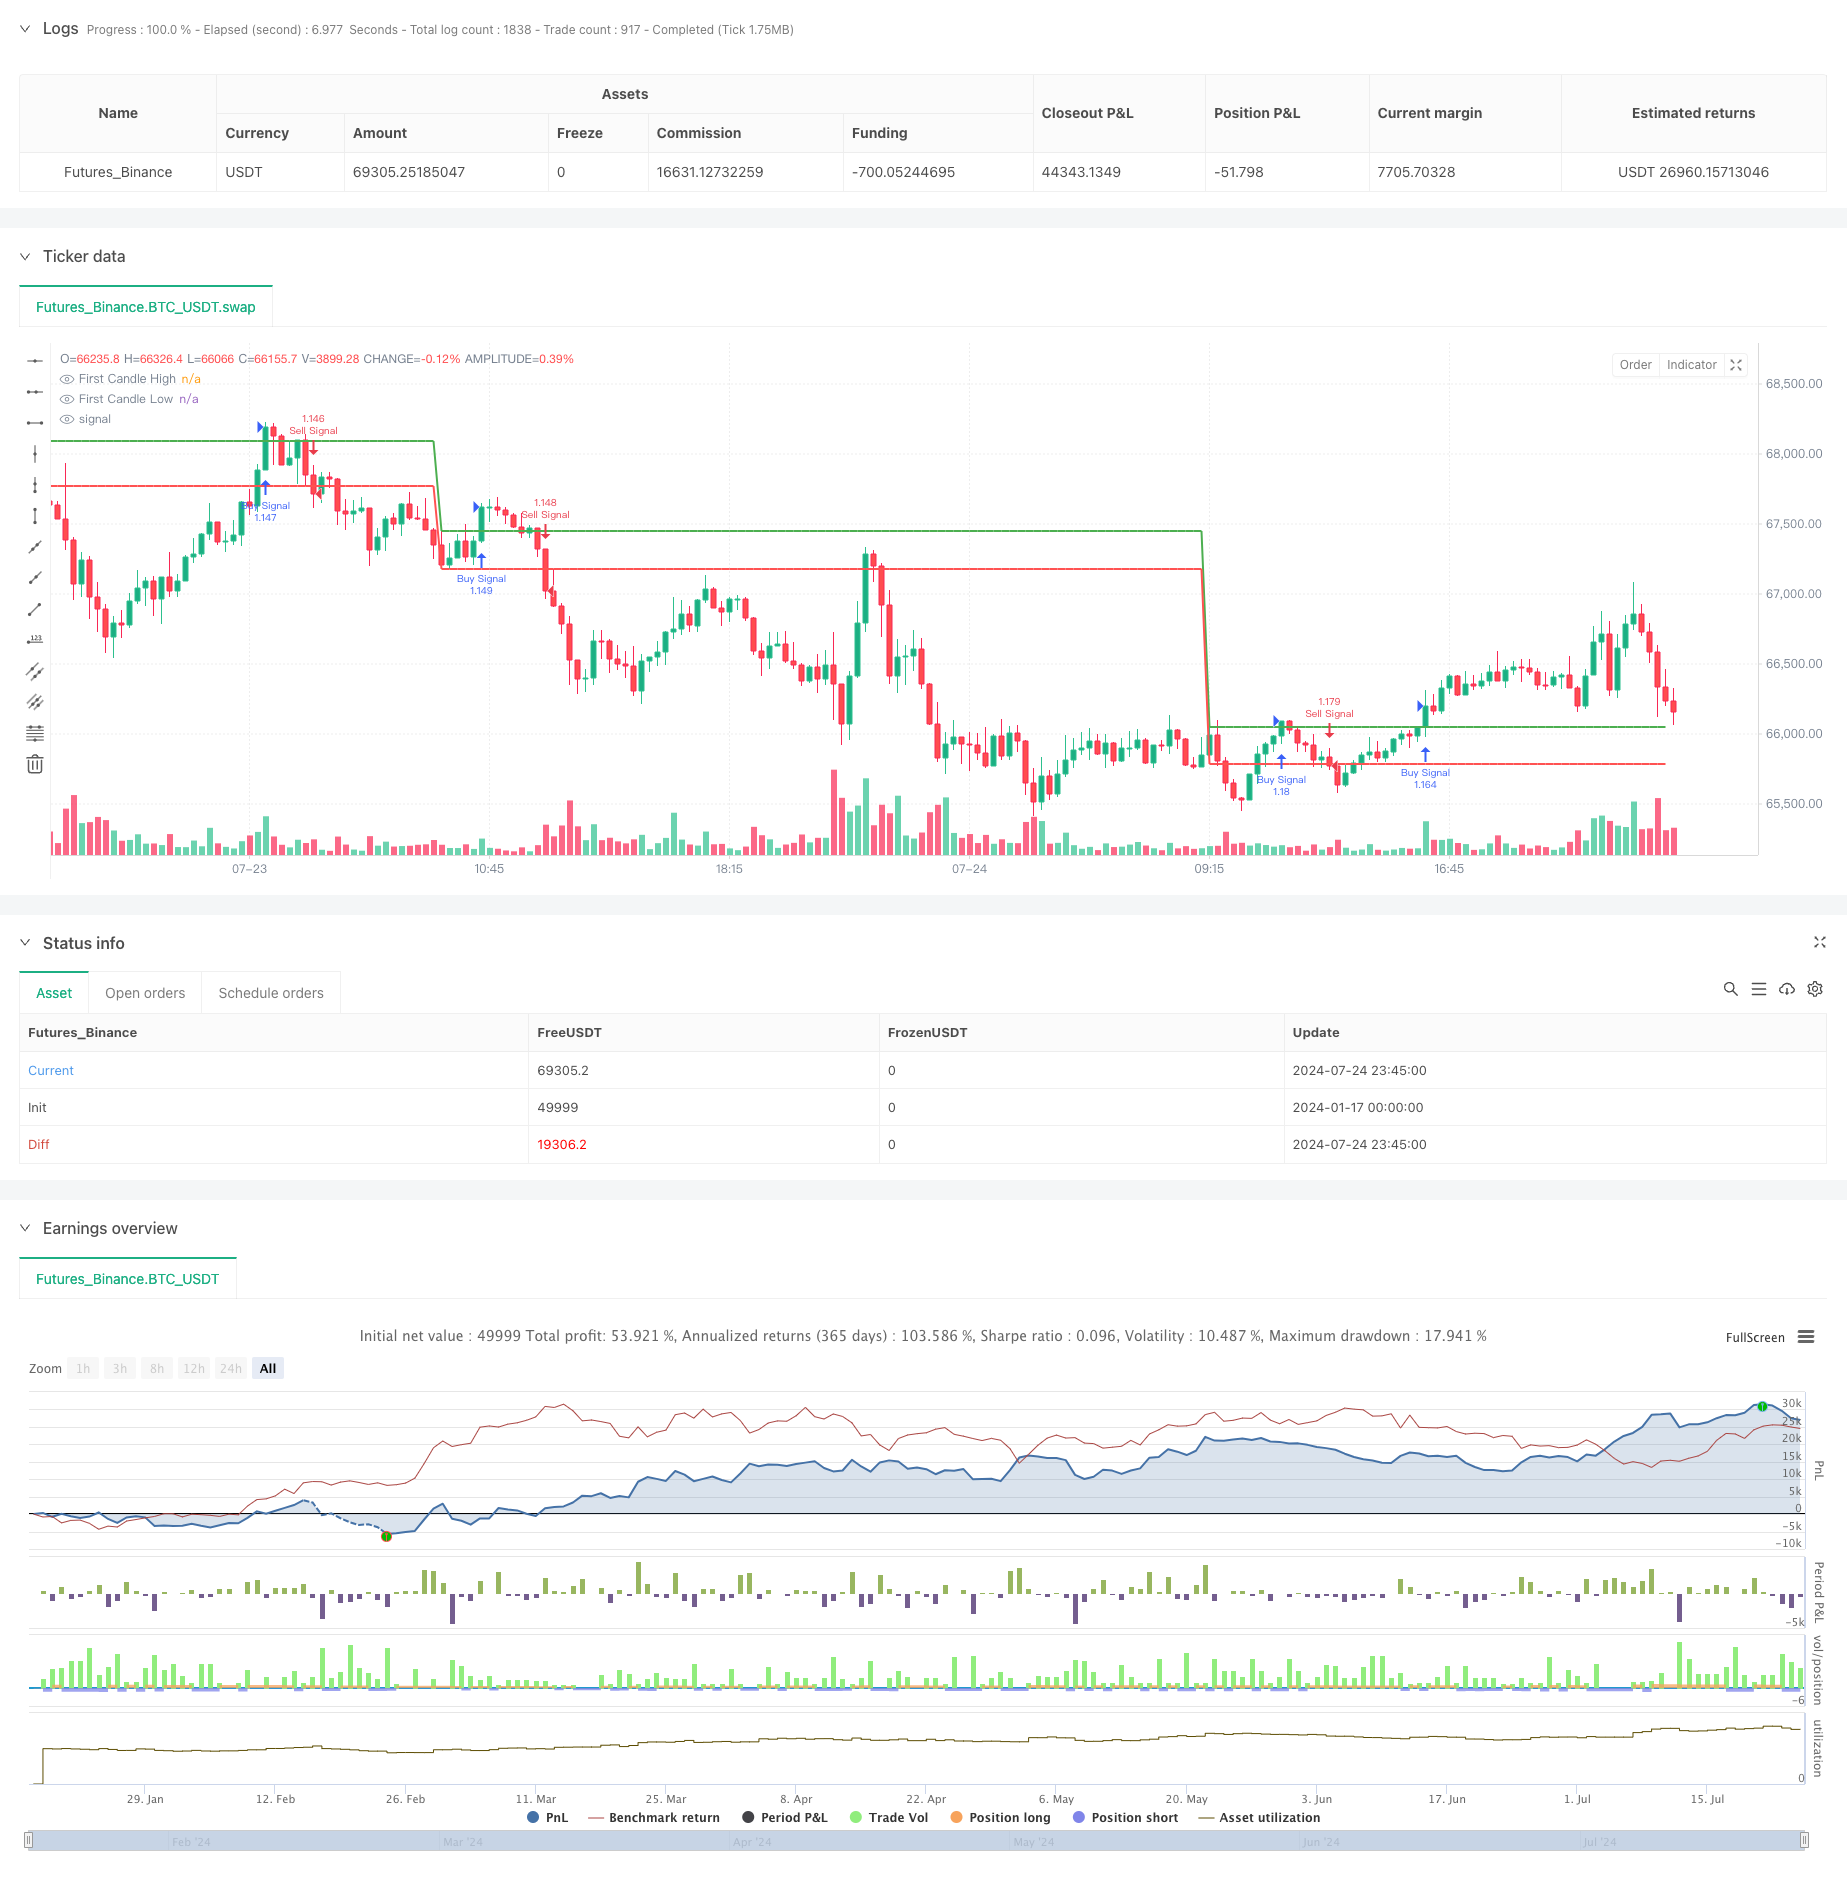
This strategy is a breakout trading system based on 15-minute candlestick charts. The core idea is to construct a price channel using the high and low points of the first 15-minute candle of each trading day, capturing market trends through price breakouts of this channel. The strategy provides clear entry signals for intraday trading by analyzing the price volatility range during the opening period.
Strategy Principles
The strategy operates based on the following core principles: 1. Time Window Lock - The strategy focuses on capturing the first candle at 9:15, a time period that typically contains important price information. 2. Price Channel Construction - Using the high and low of the first candle to set upper and lower bounds, forming a trading channel. 3. Breakout Signal Generation - Generating long signals when price closes above the channel and short signals when below. 4. Automated Execution - Implementing fully automated trading through programmatic coding to avoid emotional interference.
Strategy Advantages
- Simple and Intuitive - Clear strategy logic, easy to understand and execute, suitable for traders of all levels.
- High Time Efficiency - Quickly captures market direction by targeting high volatility during opening hours.
- Controllable Risk - Provides objective references for stop-loss and take-profit through defined price channels.
- Good Adaptability - Strategy can be applied to various trading instruments with good universality.
- High Automation Level - Complete programmatic implementation ensures trading objectivity and execution efficiency.
Strategy Risks
- False Breakout Risk - Markets may exhibit false breakouts leading to incorrect signals.
- Volatility Dependence - Strategy performance may be suboptimal in low volatility environments.
- Time Limitations - Only applicable to specific time periods, potentially missing opportunities at other times.
- Slippage Impact - May face significant slippage in highly volatile markets.
- Technical Dependence - Requires stable technical environment for accurate execution.
Strategy Optimization Directions
- Introduce Volatility Filtering - Add ATR indicator to filter signals in low volatility environments.
- Optimize Entry Timing - Incorporate volume indicators to verify breakout validity.
- Add Trend Confirmation - Include trend indicators like moving averages to improve signal quality.
- Dynamic Stop-Loss Optimization - Adjust stop-loss positions based on market volatility.
- Improve Time Window - Study performance across different time windows to optimize trading periods.
Summary
This strategy provides a simple but effective trading method through monitoring opening period price breakouts. Its core advantages lie in simple logic and clear execution, but traders need to be aware of false breakout risks and market environment adaptability. Through continuous optimization and risk management improvements, the strategy has the potential to achieve better performance in real trading. Successful application requires traders to deeply understand market characteristics and make reasonable adjustments based on their risk tolerance.
/*backtest
start: 2024-01-17 00:00:00
end: 2024-07-25 00:00:00
period: 15m
basePeriod: 15m
exchanges: [{"eid":"Futures_Binance","currency":"BTC_USDT","balance":49999}]
*/

// This Pine Script™ code is subject to the terms of the Mozilla Public License 2.0 at https://mozilla.org/MPL/2.0/
// © OLYANGO
//@version=5
strategy("15 Min Breakout Strategy by https://x.com/iamgod43 (Yallappa) ", overlay=true, default_qty_type=strategy.percent_of_equity, default_qty_value=100)

// Define the start of backtest period
startDate = timestamp(2023, 1, 1, 0, 0)

// Ensure the script is run on a 15-minute chart
// if (timeframe.period != "15")
//     alert("Switch to a 15-minute chart for this strategy.", alert.freq_once_per_bar_close)

// Variables to store the first 15-minute candle's high and low
var float firstCandleHigh = na
var float firstCandleLow = na
var bool isFirstCandleCaptured = false

// Detect the first candle of the session
isFirstCandle = (hour == 9 and minute == 15)

// Reset first candle values for the new session
if isFirstCandle
    firstCandleHigh := high
    firstCandleLow := low
    isFirstCandleCaptured := true

// Check for breakout conditions
longCondition = isFirstCandleCaptured and close > firstCandleHigh
shortCondition = isFirstCandleCaptured and close < firstCandleLow

// Entry signals
if longCondition
    strategy.entry("Buy Signal", strategy.long)

if shortCondition
    strategy.entry("Sell Signal", strategy.short)

// Plot the first 15-minute candle high and low
plot(isFirstCandleCaptured ? firstCandleHigh : na, color=color.green, linewidth=2, title="First Candle High")
plot(isFirstCandleCaptured ? firstCandleLow : na, color=color.red, linewidth=2, title="First Candle Low")

// Backtesting start date logic
if time < startDate
    strategy.close_all("Pre-Backtest Period")
- Turnaround Tuesday Strategy (Weekend Filter)
- RSI-ATR Momentum Volatility Combined Trading Strategy
- Multi-Level Dynamic Trend Following System
- Multi-Indicator Intelligent Pyramiding Strategy
- Enhanced Breakout Strategy with Targets and Stop Loss Optimization
- AlphaTradingBot Trading Strategy
- Multi-Indicator Trend Following Strategy
- MORNING CANDLE BREAKOUT AND REVERSION STRATEGY
- Trend-Following Trading Strategy with Momentum Filtering
- Dynamic Dual-Indicator Momentum Trend Quantitative Strategy System
- Liquidity-Weighted Moving Average Momentum Crossover Strategy
- Multi-Indicator Synergistic Trend Reversal Quantitative Trading Strategy
- Multi-Channel Dynamic Support Resistance Keltner Channel Strategy
- Machine Learning Adaptive SuperTrend Quantitative Trading Strategy
- Dynamic WaveTrend and Fibonacci Integrated Quantitative Trading Strategy
- Volatility Stop Based EMA Trend Following Trading Strategy
- Multi-EMA Trend Following Strategy with Dynamic Volatility Filter
- Triple EMA Trend Following Multi-Indicator Quantitative Trading Strategy
- Year-end Trend Following Momentum Trading Strategy(60-day MA Breakout)
- Multi-Indicator Trend Following with RSI Overbought/Oversold Quantitative Trading Strategy
- Multi-timeframe Fair Value Gap Breakout Strategy with Historical Backtest
- Dynamic QQE Trend Following with Risk Management Quantitative Trading Strategy
- Dual Trend Confirmation Trading Strategy Based on Moving Averages and Outside Bar Pattern
- Dynamic Trend Following SuperTrend Triple Enhancement Strategy
- RSI Dynamic Breakout Retracement Trading Strategy
- Optimized Dual T3 Trend Tracking Strategy
- Multi-Condition Donchian Channel Momentum Breakout Strategy
- Multi-Period Technical Indicator Dynamic Trading System Strategy
- Dynamic Support Resistance & Bollinger Bands Multi-Indicator Cross Strategy
- Multi-Dimensional Ichimoku Cloud Price Breakthrough Trend Confirmation Trading Strategy