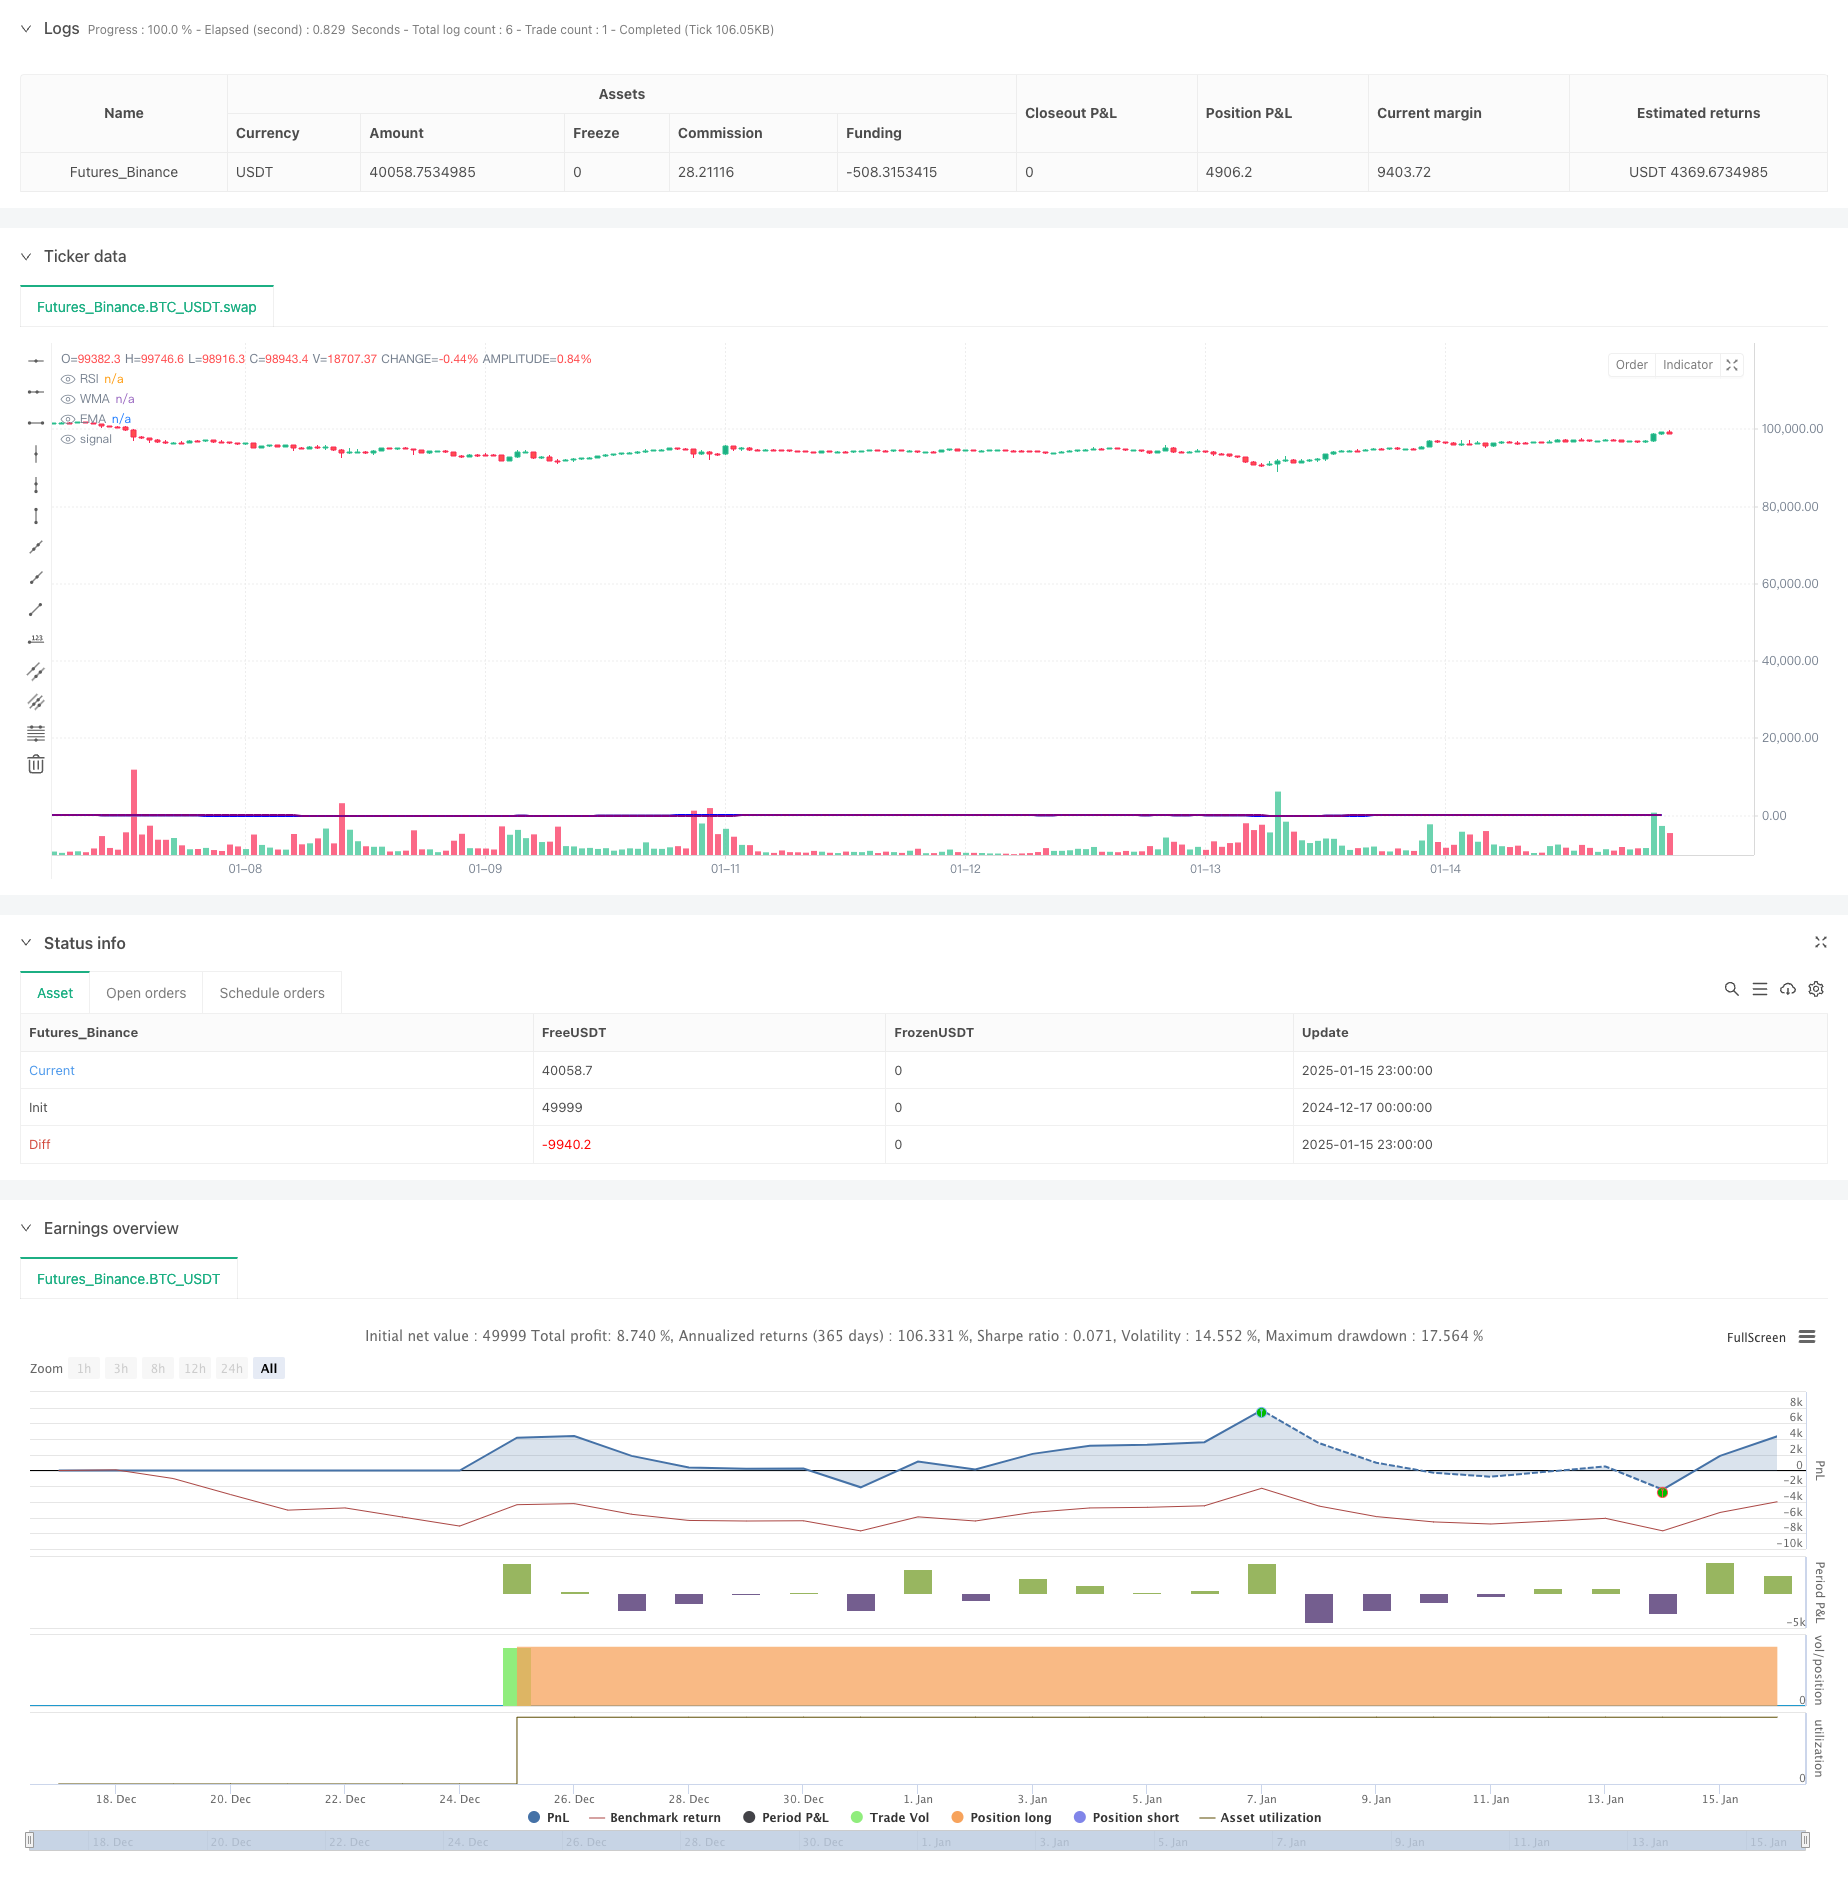
Dynamic Trend RSI Indicator Crossing Strategy
Author: ChaoZhang, Date: 2025-01-17 16:12:08Tags: RSIWMAEMA

Overview
This strategy is a trend-following trading system that combines the Relative Strength Index (RSI), Weighted Moving Average (WMA), and Exponential Moving Average (EMA). The strategy identifies market trend changes by monitoring RSI levels and the crossover between WMA and EMA to generate buy and sell signals. This combination method considers both market overbought/oversold conditions and trend judgments from different period moving averages, enabling more accurate capture of market turning points.
Strategy Principles
The core logic of the strategy is based on the following key elements: 1. Uses 14-period RSI to calculate market overbought/oversold conditions 2. Calculates 45-period WMA and 89-period EMA 3. Entry conditions: - Long signal: When RSI is below 50 and WMA crosses above EMA - Short signal: When RSI is above 50 and WMA crosses below EMA 4. Strategy uses ta.rma function to smooth RSI calculation, improving signal stability 5. Uses plotshape functionality to mark buy/sell points on the chart for intuitive judgment
Strategy Advantages
- High signal reliability: Combines momentum indicator (RSI) and trend indicators (moving averages) to effectively filter false signals
- Excellent risk control: Uses RSI 50 level as trend confirmation to reduce counter-trend trading risk
- Strong adaptability: Strategy parameters are highly adjustable to adapt to different market conditions
- Clear visualization: Trading signals are clearly visible on the chart for analysis and backtesting
- High computational efficiency: Uses Pine Script native functions for fast calculation
Strategy Risks
- Choppy market risk: May generate frequent false signals in sideways markets
- Lag risk: Moving averages inherently have some lag, which may lead to slightly delayed entry timing
- Parameter sensitivity: Different timeframe parameter settings significantly affect strategy performance
- Market environment dependence: Strategy performs better in trending markets but may underperform in ranging markets
- Drawdown risk: May face significant drawdowns during periods of intense volatility
Strategy Optimization Directions
- Incorporate volatility filtering: Add ATR indicator to filter trading signals in low volatility environments
- Optimize stop-loss settings: Suggest setting dynamic stop-loss levels based on ATR to improve risk management
- Add trend strength confirmation: Consider incorporating ADX or other trend strength indicators to improve signal reliability
- Enhance position management: Suggest dynamic position sizing based on volatility and risk metrics
- Add market environment classification: Consider adding market condition logic to use different parameter settings in different market conditions
Summary
The strategy constructs a relatively complete trend-following system by combining RSI, WMA, and EMA indicators. Its core advantages lie in signal reliability and risk control capabilities, while attention must be paid to false signal risks in ranging markets. Through optimization measures such as adding volatility filtering and trend strength confirmation, the strategy’s stability and profitability can be further improved. Overall, this is a trading strategy with practical value, particularly suitable for medium to long-term trend traders.
/*backtest
start: 2024-12-17 00:00:00
end: 2025-01-16 00:00:00
period: 1h
basePeriod: 1h
exchanges: [{"eid":"Futures_Binance","currency":"BTC_USDT","balance":49999}]
*/

//@version=5
strategy(title="RSI + WMA + EMA Strategy", shorttitle="RSI Strategy", overlay=true)

// RSI Settings
rsiLengthInput = input.int(14, minval=1, title="RSI Length", group="RSI Settings")
rsiSourceInput = input.source(close, "Source", group="RSI Settings")

// WMA and EMA Settings
wmaLengthInput = input.int(45, minval=1, title="WMA Length", group="WMA Settings")
wmaColorInput = input.color(color.blue, title="WMA Color", group="WMA Settings")
emaLengthInput = input.int(89, minval=1, title="EMA Length", group="EMA Settings")
emaColorInput = input.color(color.purple, title="EMA Color", group="EMA Settings")

// RSI Calculation
change = ta.change(rsiSourceInput)
up = ta.rma(math.max(change, 0), rsiLengthInput)
down = ta.rma(-math.min(change, 0), rsiLengthInput)
rsi = down == 0 ? 100 : up == 0 ? 0 : 100 - (100 / (1 + up / down))

// WMA and EMA Calculation
wma = ta.wma(rsi, wmaLengthInput)
ema = ta.ema(rsi, emaLengthInput)

// Plot RSI, WMA, and EMA
plot(rsi, "RSI", color=#7E57C2)
plot(wma, title="WMA", color=wmaColorInput, linewidth=2)
plot(ema, title="EMA", color=emaColorInput, linewidth=2)

// Entry and Exit Conditions
longCondition = ta.crossover(wma, ema) and rsi < 50
shortCondition = ta.crossunder(wma, ema) and rsi > 50

if (longCondition)
    strategy.entry("Long", strategy.long)

if (shortCondition)
    strategy.entry("Short", strategy.short)

// Optional: Plot Buy/Sell Signals on Chart
plotshape(series=longCondition, style=shape.labelup, location=location.belowbar, color=color.green, size=size.small, title="Buy Signal")
plotshape(series=shortCondition, style=shape.labeldown, location=location.abovebar, color=color.red, size=size.small, title="Sell Signal")
- Multi-Technical Indicator Crossover Momentum Trend Following Strategy
- Swing Hull/rsi/EMA Strategy
- Scalping EMA ADX RSI with Buy/Sell
- Super Scalper - 5 Min 15 Min
- Dynamic RSI Quantitative Trading Strategy with Multiple Moving Average Crossover
- RSI and Stochastic Fusion Cross Strategy
- RSI and MA Combination Strategy
- Advanced Quantitative Trading Strategy Combining RSI Divergence and Moving Averages
- Dynamic RSI Smart Timing Swing Trading Strategy
- MACD and RSI Combined Natural Trading Strategy
- Advanced Multi-Indicator Trend Confirmation Trading Strategy
- Dual Moving Average-RSI Multi-Signal Trend Trading Strategy
- Adaptive Trend Following and Multi-Confirmation Trading Strategy
- Dynamic EMA System Combined with RSI Momentum Indicator for Optimized Intraday Trading Strategy
- Multi-Technical Indicator Crossover Momentum Trend Following Strategy
- Dynamic Stop-Loss Adjustment Elephant Bar Trend Following Strategy
- Dual-Period RSI Trend Momentum Strategy with Pyramiding Position Management System
- Multi-Timeframe Trading Strategy Combining Harmonic Patterns and Williams %R
- EMA Trend with Round Number Breakout Trading Strategy
- Dynamic RSI Quantitative Trading Strategy with Multiple Moving Average Crossover
- Multi-Dimensional KNN Algorithm with Volume-Price Candlestick Pattern Trading Strategy
- Dual Crossover Trend Following Strategy: EMA and MACD Synergistic Trading System
- SMA-Based Intelligent Trailing Stop Strategy with Intraday Pattern Recognition
- Adaptive Multi-Strategy Dynamic Switching System: A Quantitative Trading Strategy Combining Trend Following and Range Oscillation
- Advanced Multi-Indicator Multi-Dimensional Trend Cross Quantitative Strategy
- Multi-Factor Regression and Dynamic Price Band Quantitative Trading System
- Multi-Indicator Dynamic Trend Detection and Risk Management Trading Strategy
- Multi-Smoothed Moving Average Dynamic Crossover Trend Following Strategy with Multiple Confirmations
- Advanced Dynamic Stop-Loss Strategy Based on Large Candles and RSI Divergence
- Liquidity-Weighted Moving Average Momentum Crossover Strategy