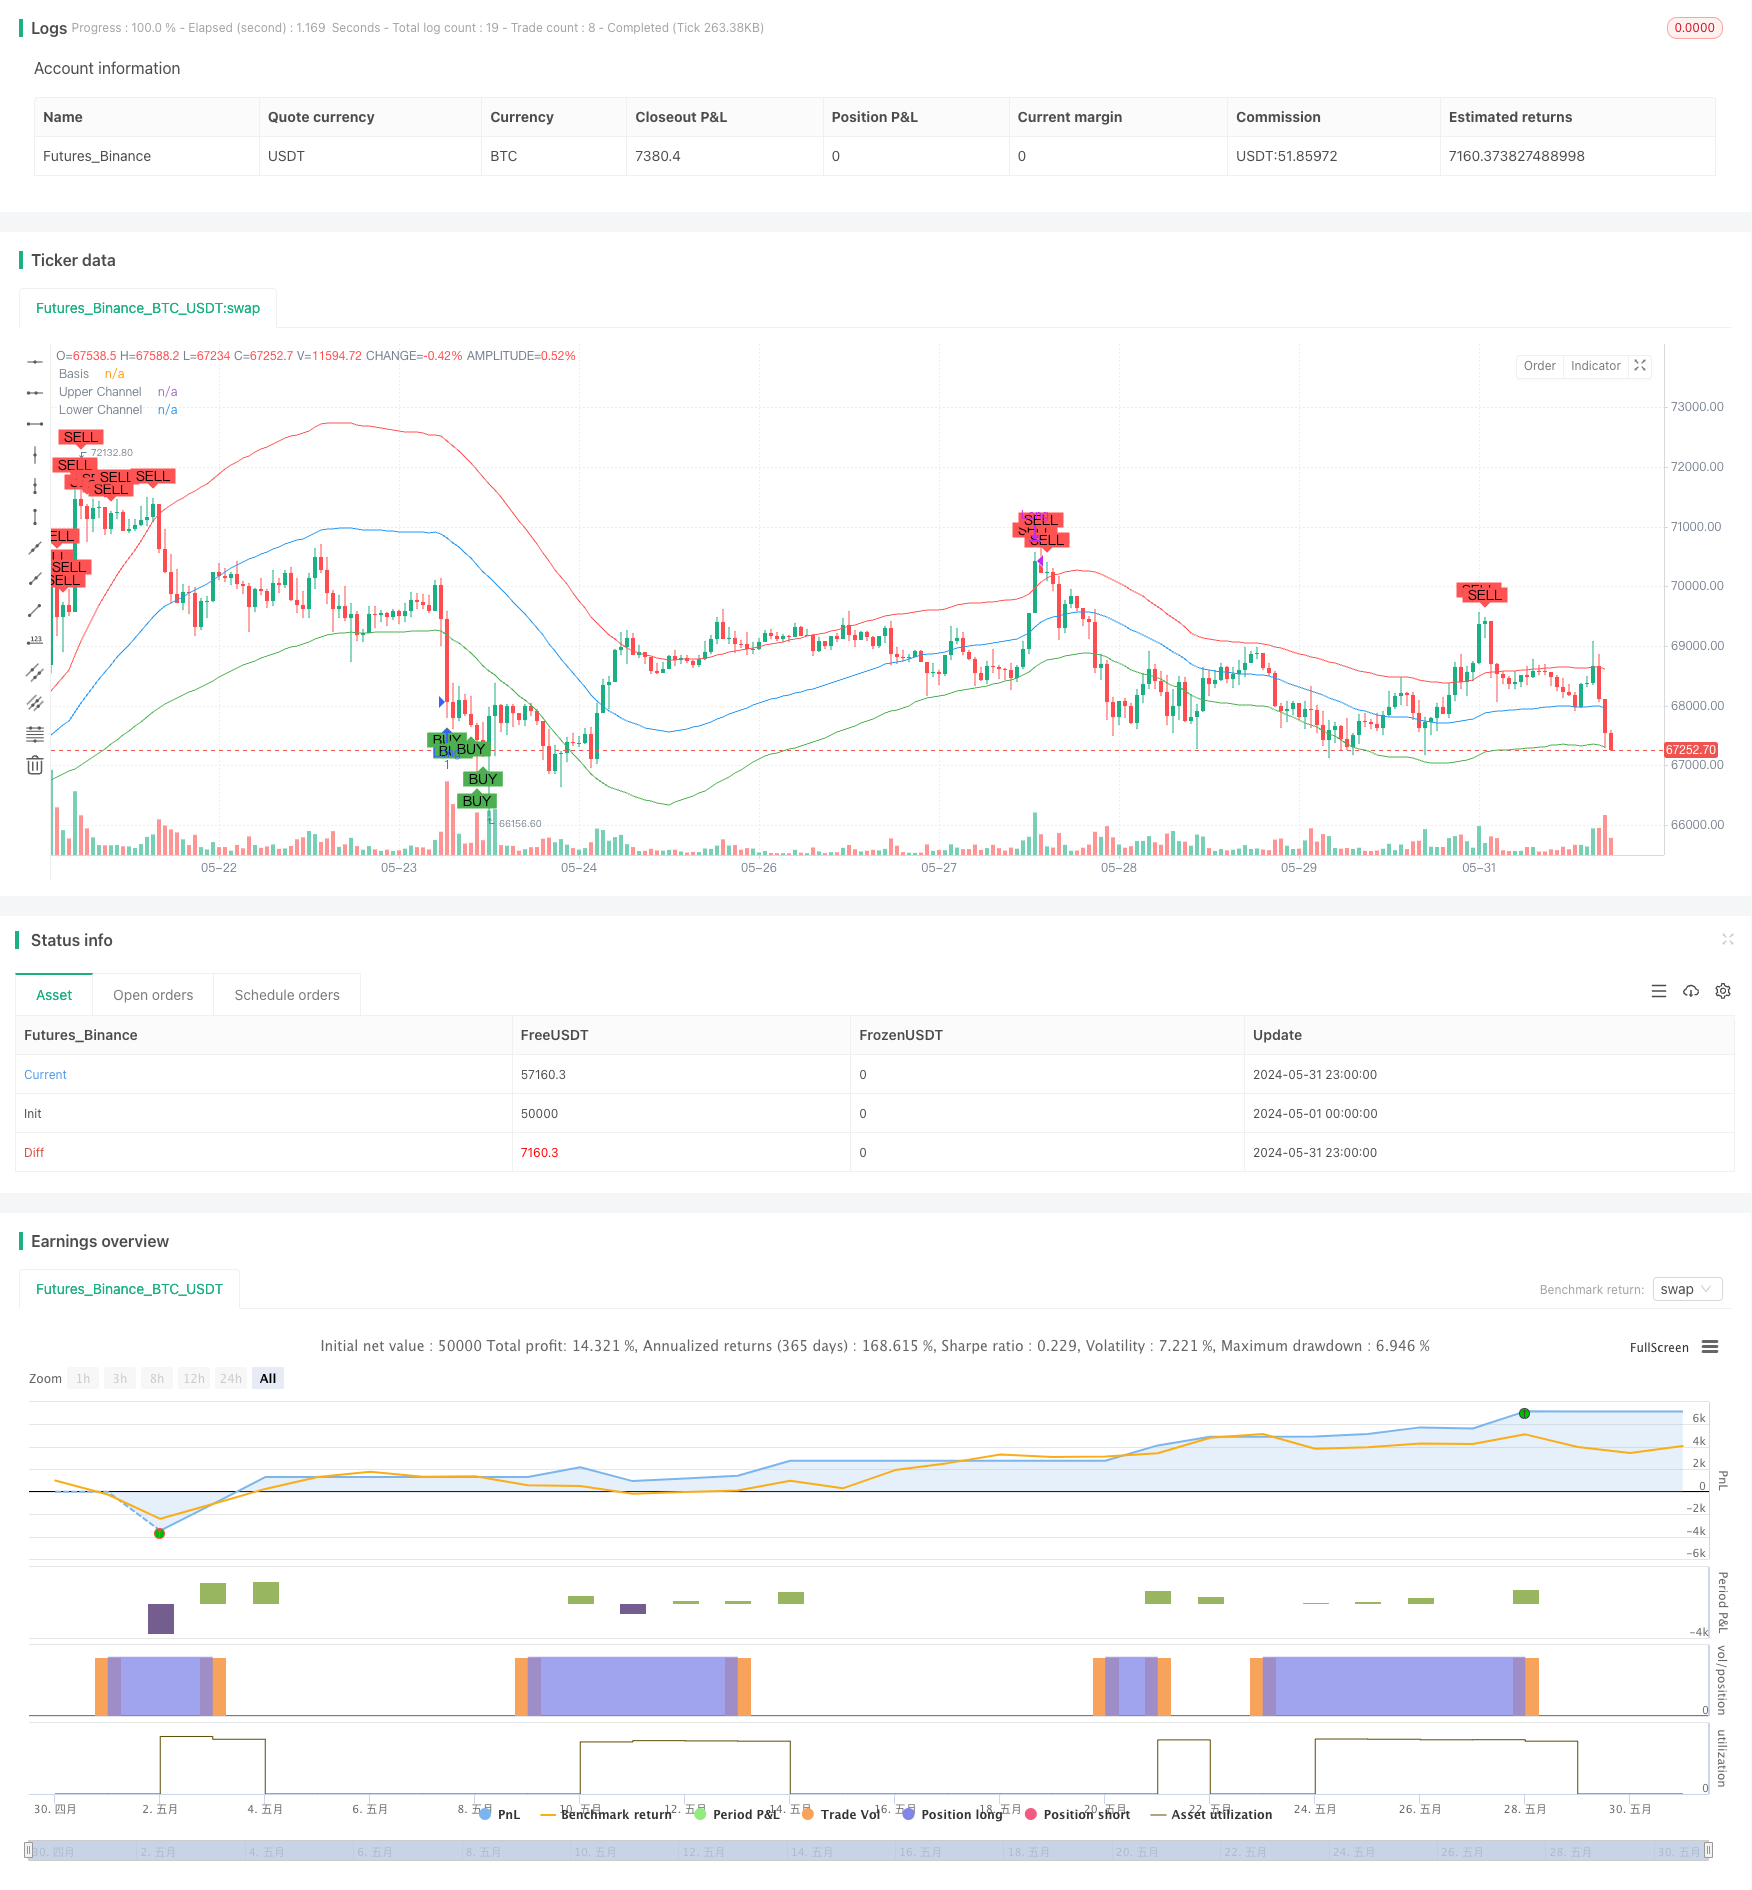
RSIと線形回帰チャネル取引戦略
作者: リン・ハーンチャオチャン,日付: 2024-06-03 11:19:49タグ:RSILRC

概要
この戦略は,市場における過剰購入および過剰販売の機会を把握するために,相対強度指数 (RSI) と線形回帰チャネル (LRC) の技術指標を組み合わせます.価格が線形回帰チャネルの下帯に触れてRSIインジケーターが30を下回ると,戦略は購入信号を生成します.価格が線形回帰チャネル上帯に触れてRSIインジケーターが70を超えると,戦略は販売信号を生成します.RSIとLRCを組み合わせるこのアプローチは,偽信号の確率を減らすと同時に潜在的な取引機会を効果的に特定することができます.
戦略原則
この戦略の核心は,RSI指標と線形回帰チャネルである.RSIは,最近の価格変動の大きさと方向を測定するために使用されるモメント指標である.RSIが30を下回ると,市場は過売りとみなされ,RSIが70を超えると,市場は過買いとみなされる.線形回帰チャネルは,ベースラインと2つの平行線 (上下チャネル) を含むトレンドフォローする指標である.ベースラインは閉値の線形回帰であり,上下チャネルラインはベースラインプラスまたはマイナス一定の標準偏差である.価格が下下チャネルラインに触ると,市場は過売りになり,潜在的に反弹する可能性があります.価格が上下チャネルラインに触ると,市場は過買いになり,潜在的に引き戻す可能性があります.RSIとLRCを組み合わせることで,この戦略は取引の成功率を確認することを目指しています.
戦略 の 利点
- より包括的な市場分析のために,モメントインジケーター (RSI) とトレンドフォローインジケーター (LRC) を組み合わせます.
- 価格が線形回帰チャネルの上または下帯に触れるのを待って,RSIの過買いまたは過売状態を確認することで,戦略はいくつかの誤った信号をフィルタリングすることができます.
- 戦略の論理は明確で 分かりやすく 実行できます
- 日時と4時間チャートなどの異なる時間枠に適用できるため,柔軟性がある.
戦略リスク
- 市場が不安定で トレンドが不明な場合 この戦略は より多くの誤った信号を生み出します
- RSIとLRCのパラメータの選択は戦略のパフォーマンスに影響し,パラメータの設定が適切でない場合,戦略の失敗につながる可能性があります.
- 戦略では,ストップ・ロースやポジションサイジングなどのリスク管理は考慮されていない.これは大きな引き上げにつながる可能性がある.
- 戦略の業績は,市場の状況によって変化し,特定の市場環境ではうまくいかない可能性があります.
戦略の最適化方向
- 信号の信頼性を高めるため,より多くの技術指標や市場情勢指標を導入する.
- RSIとLRCのパラメータ設定を最適化し,異なる市場状況と取引手段に適応させる.
- 潜在的な損失を制御するために,ストップ・ロースやダイナミック・ポジション・サイジングなどのリスク管理措置を導入する.
- トレンドフィルターを追加して 不安定な市場での取引を避けるようにしましょう
- バックテストと戦略の最適化により 最適なパラメータの組み合わせと取引規則を決定します
概要
RSIと線形回帰チャネル取引戦略は,勢いとトレンドフォローする指標を組み合わせることで,市場における過剰購入および過剰販売の機会を把握しようと試みます.この戦略の利点は,明確な論理,実装の容易性,異なるタイムフレームに適用可能性などです.しかし,この戦略には,誤った信号,パラメータ敏感性,リスク管理の欠如などのリスクもあります.戦略のパフォーマンスを向上させるために,より多くの指標を導入し,パラメータ設定を最適化し,リスク管理対策を組み込み,トレンドフィルターを追加することを検討することができます.全体的に,この戦略は,RSIとLRCをベースとした取引のための枠組みを提供しますが,さらに最適化と精製が必要です.
/*backtest
start: 2024-05-01 00:00:00
end: 2024-05-31 23:59:59
period: 1h
basePeriod: 15m
exchanges: [{"eid":"Futures_Binance","currency":"BTC_USDT"}]
*/

//@version=5
strategy("RSI and Linear Regression Channel Strategy", overlay=true)

// Define input parameters
rsiLength = input(14, title="RSI Length")
channelLength = input(100, title="Linear Regression Channel Length")
rsiBuyThreshold = 30
rsiSellThreshold = 70

// Calculate RSI
rsi = ta.rsi(close, rsiLength)

// Calculate Linear Regression Channel
basis = ta.linreg(close, channelLength, 0)
dev = ta.stdev(close, channelLength)
upperChannel = basis + dev
lowerChannel = basis - dev

// Plot Linear Regression Channel
plot(basis, color=color.blue, title="Basis")
plot(upperChannel, color=color.red, title="Upper Channel")
plot(lowerChannel, color=color.green, title="Lower Channel")

// Entry condition: Price touches lower channel and RSI crosses below buy threshold
longCondition = (close <= lowerChannel) and (rsi < rsiBuyThreshold)

// Exit condition: Price touches upper channel and RSI crosses above sell threshold
shortCondition = (close >= upperChannel) and (rsi > rsiSellThreshold)

// Strategy execution
if (longCondition)
    strategy.entry("Long", strategy.long)

if (shortCondition)
    strategy.close("Long")

// Plot buy/sell signals on the chart
plotshape(series=longCondition, location=location.belowbar, color=color.green, style=shape.labelup, text="BUY")
plotshape(series=shortCondition, location=location.abovebar, color=color.red, style=shape.labeldown, text="SELL")
- 複数の指標を備えた インテリジェントピラミッド戦略
- TMA-レガシー
- RSI_now_sb_ok
- 2つのRSI差分戦略
- RSI MTF Ob+Os
- RSI モメントベースのスマートアダプティブ・トレーディング・システム
- RSI 過剰購入および過剰販売レベルに基づく自動取引戦略
- スーパートレックス
- RSI オーバーセール 周期投資戦略
- RSI ダイバージェンスをベースにしたトレンド逆転取引戦略
- % 制限量的な取引戦略
- 動向平均のクロスオーバー戦略は,二重動向平均に基づいている
- MACDとスーパートレンドの組み合わせ戦略
- ボリュームとキャンドルスティックパターンをベースにした買い/売る戦略
- ストップ・ロスの後退と規律的な再入入りのSMAトレンド
- EMAとボリンガーバンドのブレイクアウト戦略
- CDCアクションゾーン トレーディングボット戦略 ATRで 利益とストップ損失を
- ダイナミックストップ・ロスの戦略を持つ連続的なキャンドルベースのダイナミックグリッドアダプティブ移動平均
- MAのクロス戦略
- 動向フィルタリングによるトレンドフォローする取引戦略
- ダブル・ベガス・チャネル・ボラティリティ調整スーパートレンド量的な取引戦略
- EMAのRSIクロスオーバー戦略
- 移動平均収束勢雲戦略
- 2つの移動平均のクロスオーバーストップ損失と利益戦略
- TEMAの二重移動平均のクロスオーバー戦略
- マルチタイムフレーム SMA トレンド ダイナミックストップロスの戦略をフォローする
- ボリンジャー・バンドの正確なエントリーとリスク管理戦略
- ボリンジャーバンド+RSI+ストカスティックRSI戦略
- トートル=ATR ボリンジャー・バンドのブレイクアウト戦略
- VWAPとスーパートレンドの買い/売戦略