TURTLE-ATR Bollinger Bands Breakout Strategy
Author: ChaoZhang, Date: 2024-06-03 10:48:09Tags: ATR
Overview
This is a trend-following strategy based on the Turtle Trading rules. The strategy uses ATR (Average True Range) to determine the trend direction and trading position size. When the price breaks out of the highest or lowest price over a certain period, the strategy will open a long or short position. The position will be held until the price breaks out of the lowest or highest price over a certain period, at which point the strategy will close the position. The goal of this strategy is to capture strong trending markets while strictly controlling risk.
Strategy Principle
The core of this strategy is to use the ATR indicator to determine the trend direction and trading position size. The ATR indicator can measure market volatility, helping us determine appropriate stop-loss levels and position sizes. The main steps of the strategy are as follows:
- Calculate the ATR indicator value.
- Determine the breakout price levels for long and short positions. The long breakout price is the highest price over a certain period, and the short breakout price is the lowest price over a certain period.
- If the price breaks out above the long breakout price, open a long position; if the price breaks out below the short breakout price, open a short position.
- Calculate the position size for each trade based on the ATR indicator value and account balance.
- Hold the position until the price breaks out of the lowest price (for long positions) or highest price (for short positions) over a certain period, then close the position.
By following this approach, the strategy can capture strong trending markets while strictly controlling risk. The use of the ATR indicator helps us dynamically adjust position sizes to better adapt to market volatility.
Strategy Advantages
- Trend Following: The strategy aims to capture strong trending markets, thus generating substantial profits.
- Risk Control: By using the ATR indicator to determine position sizes and stop-loss levels, the strategy can effectively control risk.
- Adaptability: The ATR indicator can be dynamically adjusted, allowing the strategy to adapt to different market environments.
- Simplicity: The strategy’s logic is clear and easy to understand and implement.
Strategy Risks
- Trend Reversal: When market trends suddenly reverse, the strategy may suffer significant losses.
- Choppy Markets: In choppy markets, the strategy may frequently open and close positions, leading to high trading costs.
- Parameter Sensitivity: The performance of the strategy may be sensitive to parameter settings, and inappropriate parameters may lead to poor performance.
To address these risks, the following solutions can be considered:
- Introduce a trend confirmation mechanism to avoid opening positions prematurely when trends reverse.
- Reduce position sizes or suspend trading in choppy markets.
- Optimize parameters to find the best combination.
Strategy Optimization Directions
- Introduce More Indicators: In addition to the ATR indicator, consider introducing other trend confirmation indicators, such as moving averages, to improve the accuracy of trend identification.
- Dynamic Parameter Adjustment: Dynamically adjust strategy parameters based on different market environments, such as ATR period and breakout price period, to adapt to market changes.
- Incorporate a Take Profit Mechanism: After achieving a certain profit, consider partially closing positions to lock in profits and reduce risk.
- Long/Short Position Management: Consider managing long and short positions separately, such as using different stop-loss and take-profit standards, to improve the strategy’s flexibility.
Through the above optimizations, the stability and profitability of the strategy can be further improved.
Summary
The TURTLE-ATR Bollinger Bands Breakout Strategy is a trend-following strategy based on the Turtle Trading rules. The strategy utilizes the ATR indicator to determine trend direction and trading position size, opening positions when the price breaks out of the highest or lowest price over a certain period and holding positions until the trend reverses. The strategy’s advantages lie in its ability to capture strong trending markets while strictly controlling risk. However, the strategy also faces risks such as trend reversals, choppy markets, and parameter sensitivity. To further improve the strategy’s performance, optimizations can be considered in areas such as introducing more indicators, dynamically adjusting parameters, incorporating take-profit mechanisms, and optimizing position management. Overall, the TURTLE-ATR Bollinger Bands Breakout Strategy is a simple, adaptable trend-following strategy that is worth further research and application.
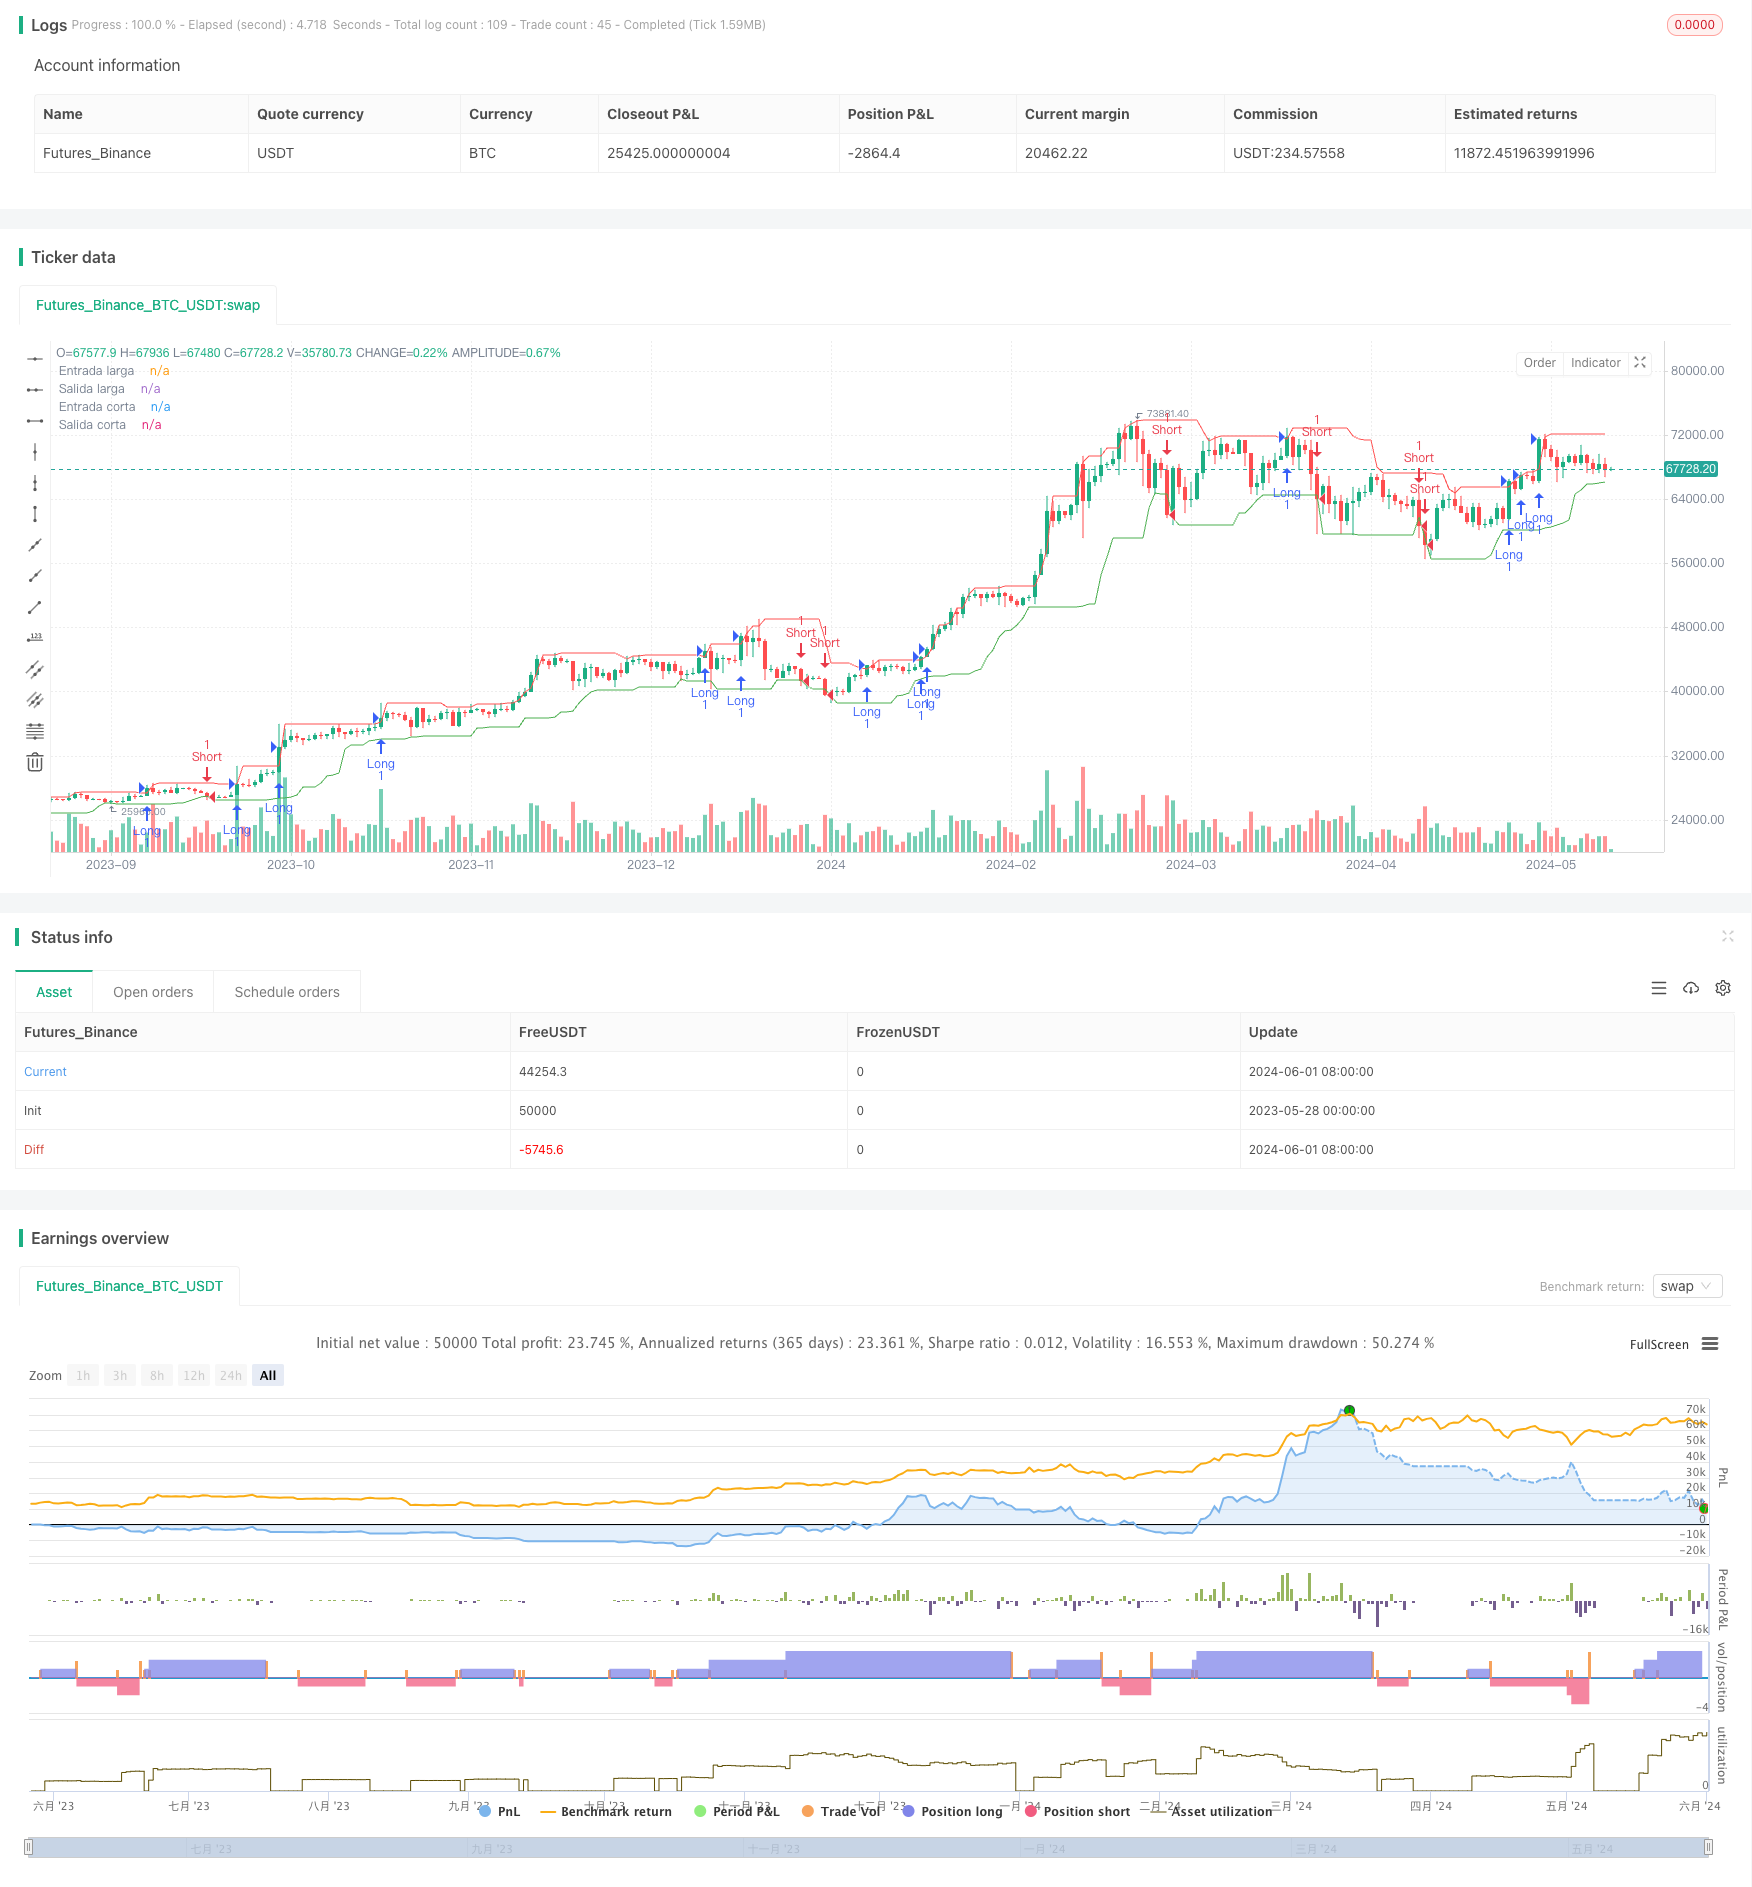
/*backtest
start: 2023-05-28 00:00:00
end: 2024-06-02 00:00:00
period: 1d
basePeriod: 1h
exchanges: [{"eid":"Futures_Binance","currency":"BTC_USDT"}]
*/

// This Pine Script™ code is subject to the terms of the Mozilla Public License 2.0 at https://mozilla.org/MPL/2.0/
// © luisfeijoo22

//@version=5
strategy("Estrategia de las tortugas_ES", overlay=true, pyramiding=3)

// Parámetros
atrLength = input.int(20, "Longitud del ATR")
atrFactor = input.float(2, "Factor del ATR")
entryBreakout = input.int(20, "Breakout de entrada")
exitBreakout = input.int(10, "Breakout de salida")
longOnly = input.bool(false, "Solo largos")
shortOnly = input.bool(false, "Solo cortos")


// Cálculo del ATR
atr = ta.atr(atrLength)

// Cálculo de los niveles de breakout
longEntry = ta.highest(high, exitBreakout)[1]
longExit = ta.lowest(low, exitBreakout)[1]
shortEntry = ta.lowest(low, exitBreakout)[1]
shortExit = ta.highest(high, exitBreakout)[1]

// Cálculo del tamaño de la posición
nContracts = math.floor((strategy.equity * 0.01) / (atrFactor * atr))

// Filtra las fechas según el rango deseado
// in_range = time >= timestamp(year(start_date), month(start_date), dayofmonth(start_date))

// Condiciones de entrada y salida
longCondition = not longOnly and close > longEntry and time >= timestamp("2023-03-15")
if longCondition
    strategy.entry("Long", strategy.long, qty = nContracts)

shortCondition = not shortOnly and close < shortEntry and time >=  timestamp("2023-03-15")
if shortCondition
    strategy.entry("Short", strategy.short, qty = nContracts)

strategy.exit("Exit Long", "Long", stop = longExit)
strategy.exit("Exit Short", "Short", stop = shortExit)

// Visualización de los niveles de breakout
plot(longEntry, "Entrada larga", color.green, style = plot.style_line)
plot(longExit, "Salida larga", color.red, style = plot.style_line)
plot(shortEntry, "Entrada corta", color.green, style = plot.style_line)
plot(shortExit, "Salida corta", color.red, style = plot.style_line)
- Multi-EMA Trend-Following Swing Trading Strategy with ATR-Based Risk Management
- Break of Structure with Volume Confirmation Multi-Condition Intelligent Trading Strategy
- Multi-Indicator Dynamic Stop-Loss Momentum Trend Trading Strategy
- Multi-Condition Trend Following Quantitative Trading Strategy Based on Fibonacci Retracement Levels
- Multi-Filter Trend Breakthrough Smart Moving Average Trading Strategy
- Multi-Indicator Volatility Trading RSI-EMA-ATR Strategy
- Triple Supertrend and Bollinger Bands Multi-Indicator Trend Following Strategy
- Multi-Trendline Breakout Momentum Quantitative Strategy
- RSI Momentum and ADX Trend Strength Based Capital Management System
- Multi-Timeframe Trend Following Strategy with ATR-Based Take Profit and Stop Loss
- Advanced Trend Following Strategy with Adaptive Trailing Stop
- Trend-Following Trading Strategy with Momentum Filtering
- RSI and Linear Regression Channel Trading Strategy
- Double Vegas Channel Volatility-Adjusted SuperTrend Quantitative Trading Strategy
- EMA RSI Crossover Strategy
- Moving Average Convergence Momentum Cloud Strategy
- Dual Moving Average Crossover Stop Loss and Take Profit Strategy
- TEMA Dual Moving Average Crossover Strategy
- Multi-Timeframe SMA Trend Following Strategy with Dynamic Stop Loss
- Bollinger Bands Accurate Entry And Risk Control Strategy
- Bollinger Bands + RSI + Stochastic RSI Strategy Based on Volatility and Momentum Indicators
- VWAP and Super Trend Buy/Sell Strategy
- Advanced MACD Strategy with Limited Martingale
- Keltner Channels EMA ATR Strategy
- MA MACD BB Multi-Indicator Trading Strategy Backtesting Tool
- RSI+Supertrend Trend-Following Trading Strategy
- Ichimoku Kumo Trading Strategy
- Dynamic ATR Stop Loss and Take Profit Moving Average Crossover Strategy
- EMA Trend Momentum Candlestick Pattern Strategy
- G-Channel Trend Detection Strategy
- Moving Average Crossover with Trailing Stop Loss Strategy