5 EMA RSI トレンドフォローするダイナミックチャネル取引システム
作者: リン・ハーンチャオチャン開催日:2024年12月5日15時28分タグ:エイマRSIDC

概要
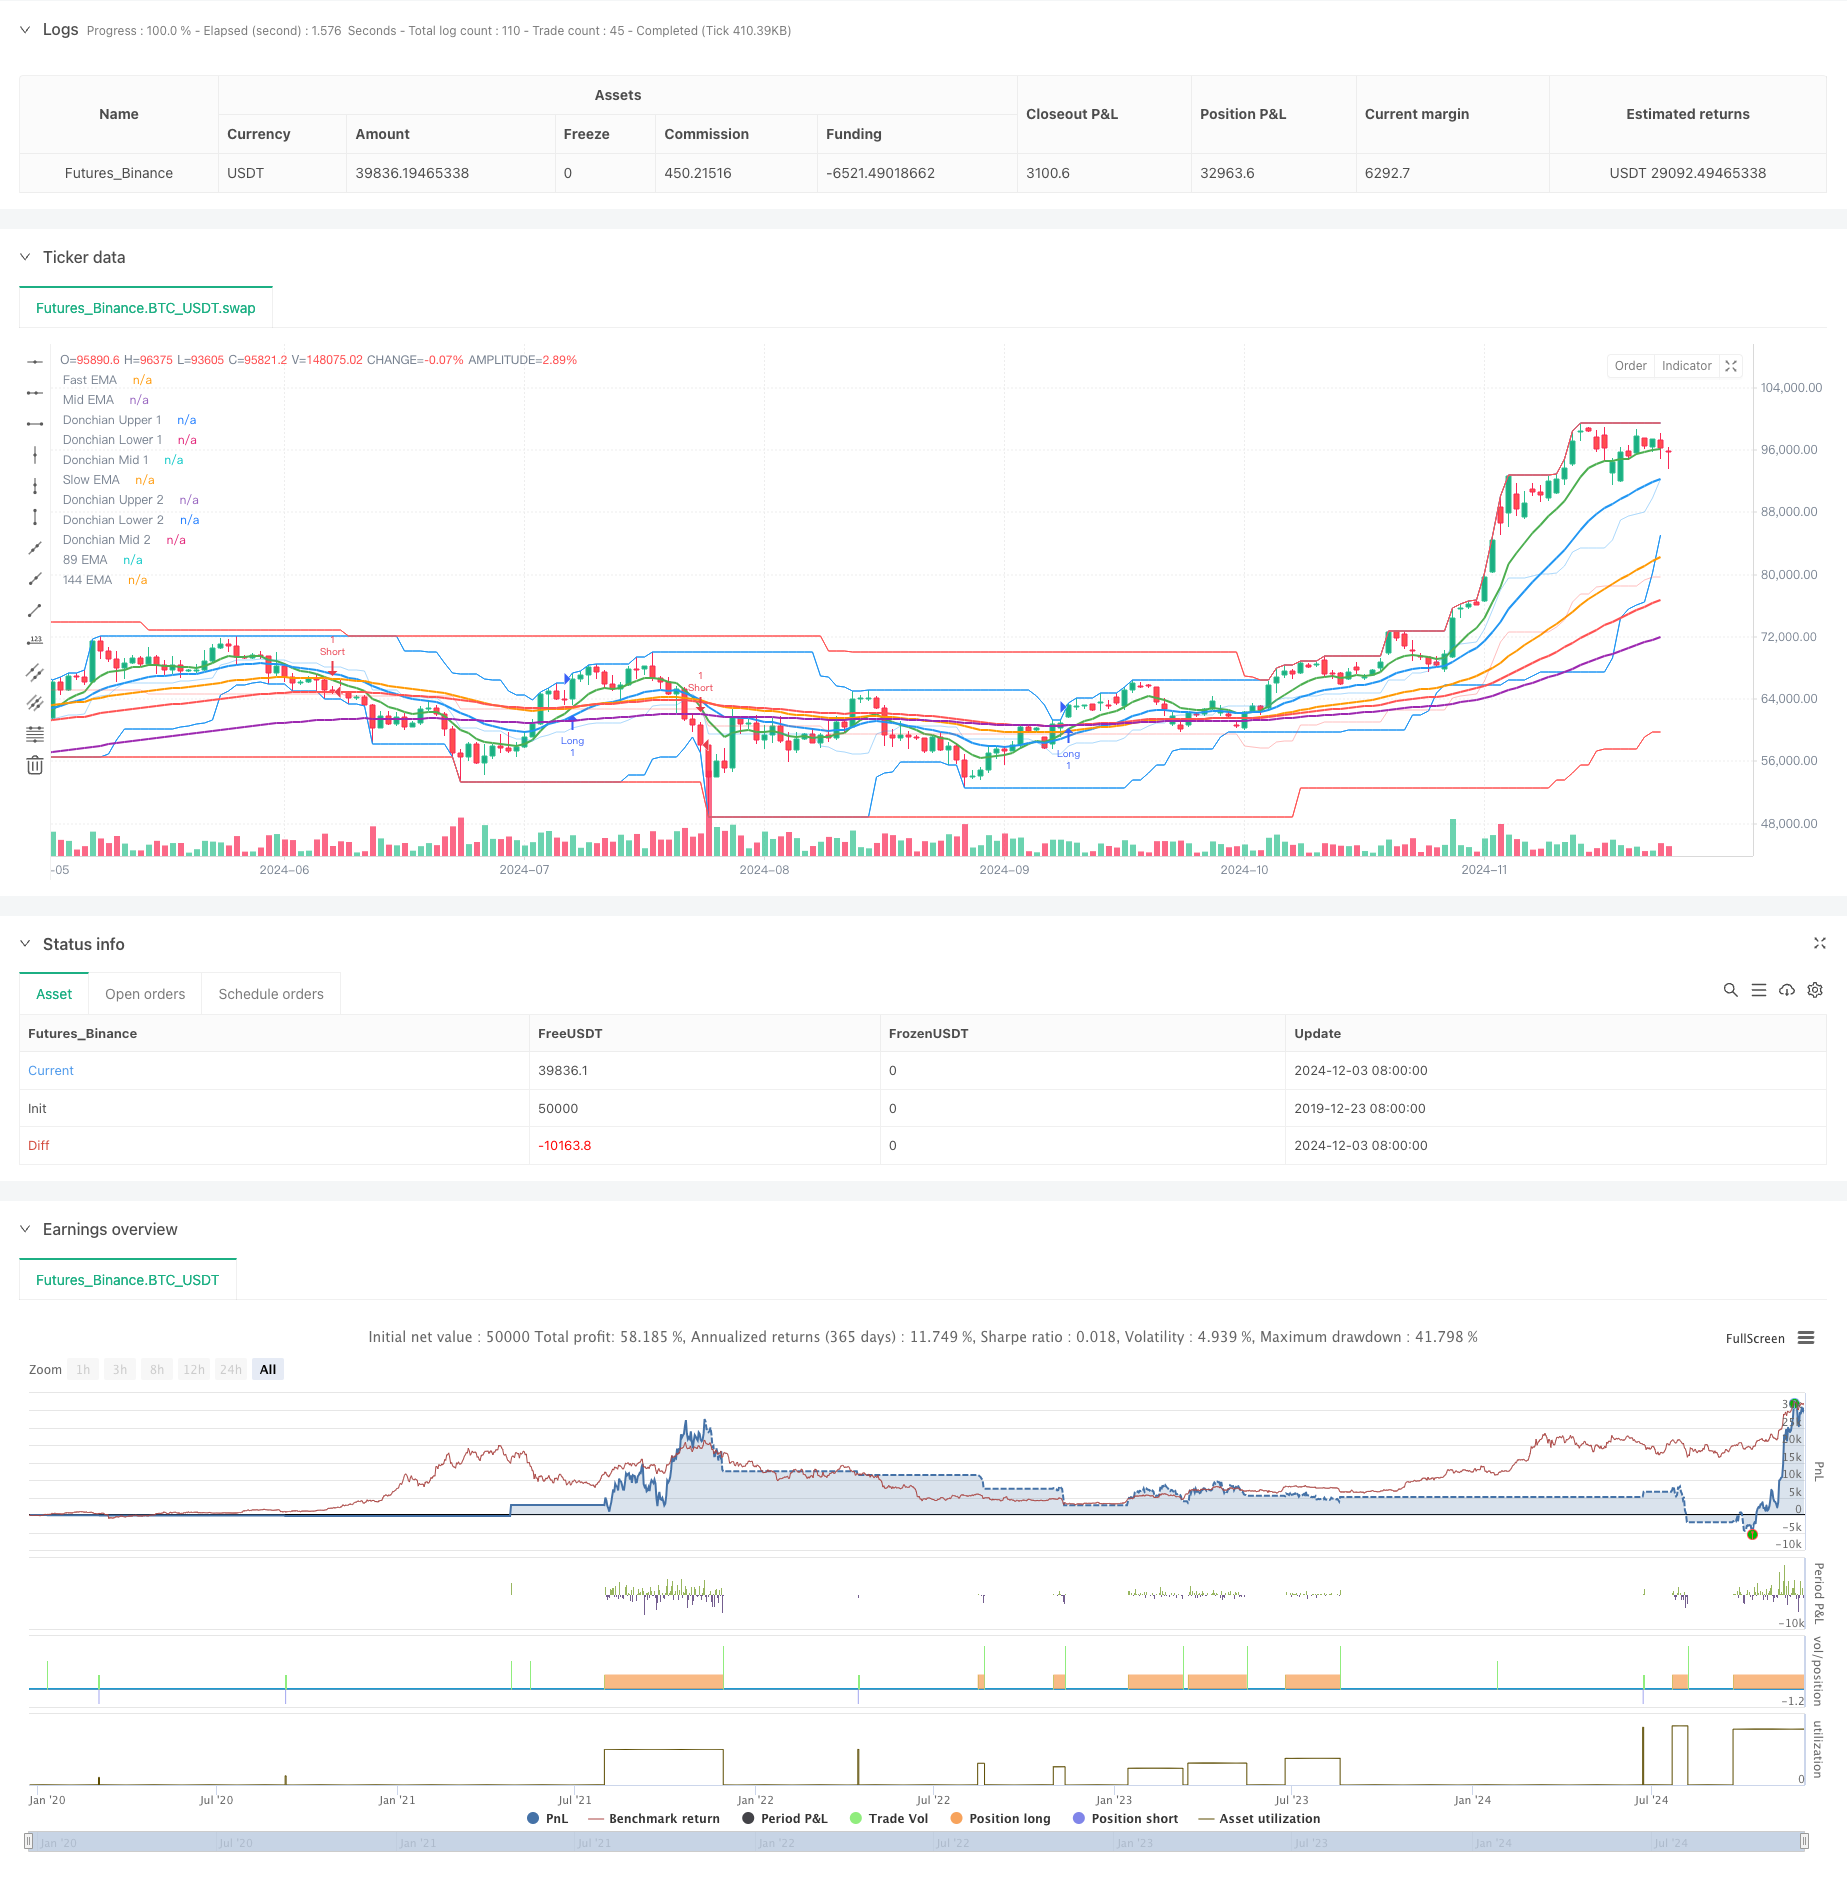
この戦略は,複数の技術指標を組み合わせたトレンドフォローシステムで,主に異なる期間の5つの指数関数移動平均値 (EMA),相対強度指数 (RSI),および異なる期間の2つのドンキアンチャネルを統合しています.このシステムは複数の指標の調整を通じて市場の傾向を把握し,ダイナミックなストップ損失と利益目標を使用してリスクと利益を管理します.
戦略の原則
この戦略は,シグナル確認のために複数の技術指標を使用している.第一に,トレンドフレームワークを構築するために5つのEMA (9, 21, 55, 89, 144期) を使用し,高速と遅いEMAの間のクロスオーバーを通じて初期トレンド方向を決定する.第二に,トレンドフィルターとしてRSI (14期) を使用し,RSIがロングポジションではオーバーバイドゾーン (60度以上) で,ショートポジションではオーバーセールドゾーン (40度以下) でなければならない.したがって,レンジング市場で頻繁な取引を避ける.最後に,21期および74期ドンチアンチャネルを使用して価格動きの範囲を定義し,取引のための追加の市場構造参照を提供します.
戦略 の 利点
- 複数の技術指標のクロスバリデーションにより信号の信頼性が向上する
- トレンドフォローとモメントインジケーターの組み合わせは,トレンド市場でうまく機能しています
- 動的なストップ・ロストと複数の利益目標を使用して,トレンド利用を最大化しながら資本を保護します.
- RSIのフィルタリングは,様々な市場での誤った信号を減らす
- 高度なシステム自動化により 感情的干渉が減ります
戦略リスク
- 複数の指標が信号遅延を引き起こし,急速な逆転市場での大幅な引き下げを引き起こす可能性があります
- RSIのフィルタリングは重要なトレンド開始を逃す可能性があります
- 固定パーセントのストップ損失と利益目標は,すべての市場条件に適合しない可能性があります.
- 高波動性のある市場では頻繁にストップ・ロスのヒットが可能です
- 過剰な技術指標は,システムの過剰な最適化につながる可能性があります.
オプティマイゼーションの方向性
- 市場変動に基づいて動的に調整する適応指標パラメータを導入する
- 補助確認として音量指標を追加
- トレイリングストップやATRベースのダイナミックストップなど,より柔軟なストップ・ロスの戦略を開発する.
- 異なる市場条件における異なるパラメータ設定のための市場状況認識メカニズムを実装する
- 不利な期間の取引を避けるために時間フィルターを追加することを検討します
結論
戦略は,複数の技術指標の組み合わせによって比較的完全な取引システムを構築する.いくつかの遅れがあるにもかかわらず,厳格な信号フィルタリングとリスク管理を通じてトレンド市場で安定した収益を達成することができる.トレーダーは,具体的な市場特性および実用的なアプリケーションにおけるリスク耐性に応じてパラメータを調整することをお勧めする.一方,システムのパフォーマンスの継続的な監視と最適化方向の定期的な評価は,戦略が市場の変化に適応できるようにするために必要である.
/*backtest
start: 2019-12-23 08:00:00
end: 2024-12-04 00:00:00
period: 1d
basePeriod: 1d
exchanges: [{"eid":"Futures_Binance","currency":"BTC_USDT"}]
*/

//@version=5
strategy("EMA RSI Donchian Strategy", overlay=true)

// Input parameters
fastEmaLength = input(9, title="Fast EMA Length")
midEmaLength = input(21, title="Mid EMA Length")
slowEmaLength = input(55, title="Slow EMA Length")
ema89Length = input(89, title="89 EMA Length")
ema144Length = input(144, title="144 EMA Length")
rsiPeriod = input(14, title="RSI Period")
rsiOverbought = input(60, title="RSI Overbought Level")
rsiOversold = input(40, title="RSI Oversold Level")
donchianLength1 = input(21, title="Donchian Channel Length 1")
donchianLength2 = input(74, title="Donchian Channel Length 2")

// EMA calculations
fastEma = ta.ema(close, fastEmaLength)
midEma = ta.ema(close, midEmaLength)
slowEma = ta.ema(close, slowEmaLength)
ema89 = ta.ema(close, ema89Length)
ema144 = ta.ema(close, ema144Length)

// RSI calculation
rsi = ta.rsi(close, rsiPeriod)

// Donchian Channel calculations
donchianUpper1 = ta.highest(high, donchianLength1)
donchianLower1 = ta.lowest(low, donchianLength1)
donchianUpper2 = ta.highest(high, donchianLength2)
donchianLower2 = ta.lowest(low, donchianLength2)
donchianMid1 = (donchianUpper1 + donchianLower1) / 2
donchianMid2 = (donchianUpper2 + donchianLower2) / 2

// Plot EMAs
plot(fastEma, color=color.green, linewidth=2, title="Fast EMA")
plot(midEma, color=color.blue, linewidth=2, title="Mid EMA")
plot(slowEma, color=color.orange, linewidth=2, title="Slow EMA")
plot(ema89, color=color.red, linewidth=2, title="89 EMA")
plot(ema144, color=color.purple, linewidth=2, title="144 EMA")

// Plot Donchian Channels
plot(donchianUpper1, color=color.new(color.blue, 0), title="Donchian Upper 1")
plot(donchianLower1, color=color.new(color.blue, 0), title="Donchian Lower 1")
plot(donchianMid1, color=color.new(color.blue, 80), title="Donchian Mid 1")
plot(donchianUpper2, color=color.new(color.red, 0), title="Donchian Upper 2")
plot(donchianLower2, color=color.new(color.red, 0), title="Donchian Lower 2")
plot(donchianMid2, color=color.new(color.red, 80), title="Donchian Mid 2")

// Entry Conditions
longCondition = ta.crossover(fastEma, slowEma) and rsi > rsiOverbought
shortCondition = ta.crossunder(fastEma, slowEma) and rsi < rsiOversold

// Stop Loss and Take Profit
var float longStopLoss = na
var float longTakeProfit1 = na
var float longTakeProfit2 = na
var float shortStopLoss = na
var float shortTakeProfit1 = na
var float shortTakeProfit2 = na

if longCondition
    longStopLoss := high * 0.99
    longTakeProfit1 := longStopLoss * 1.02618
    longTakeProfit2 := longStopLoss * 1.036185
    strategy.entry("Long", strategy.long)

if shortCondition
    shortStopLoss := low * 1.01
    shortTakeProfit1 := shortStopLoss * 0.97382
    shortTakeProfit2 := shortTakeProfit1 * 0.96381
    strategy.entry("Short", strategy.short)

// Exit Conditions
if not na(longStopLoss)
    strategy.exit("Take Profit 1", "Long", limit=longTakeProfit1)
    strategy.exit("Take Profit 2", "Long", limit=longTakeProfit2)
    strategy.exit("Stop Loss", "Long", stop=longStopLoss)

if not na(shortStopLoss)
    strategy.exit("Take Profit 1", "Short", limit= shortTakeProfit1)
    strategy.exit("Take Profit 2", "Short", limit=shortTakeProfit2)
    strategy.exit("Stop Loss", "Short", stop=shortStopLoss)

// Labels for buy and sell signals
if longCondition
    label.new(bar_index, low, "Buy", color=color.green, style=label.style_label_up, textcolor=color.white)

if shortCondition
    label.new(bar_index, high, "Sell", color=color.red, style=label.style_label_down, textcolor=color.white)

// Alerts
alertcondition(longCondition, title="Long Entry Alert", message="Long entry signal")
alertcondition(shortCondition, title="Short Entry Alert", message="Short entry signal")
関連性
- 戦略をフォローする多指標適応傾向
- EMAクロスオーバーフィボナッチ逆転戦略
- 戦略をフォローする多指標の傾向
- RSIの差異,30分間のトレンド識別,価格の枯渇と EMAのクロス戦略
- RSIとEMAを組み合わせた多期量的なダイナミック取引戦略
- EMAの上昇型クロスオーバー戦略
- 双 EMA RSI モメンタム トレンド 逆転 トレーディング システム - EMA と RSI クロスオーバー をベースにしたモメンタム 突破戦略
- RSIと二重EMAのクロスオーバー・シグナル量的な戦略
- 強化されたボリンガー帯のRSI取引戦略
- ポジションスケーリングを含む多期間のRSI-EMAモメンタム取引戦略
もっと
- 多期移動平均値とRSIモメントの交差トレンド 戦略に従う
- 金融資産 MFI ベースオーバーセールゾーン エグジットとシグナル平均化システム
- マルチEMA・クロスオーバーとモメンタム・インディケーターの取引戦略
- MACD-KDJ 組み合わせたマルティンゲール・ピラミディング量的な取引戦略
- 複数のパターン認識とSRレベル取引戦略
- GチャネルとEMAトレンドフィルター取引システム
- ストップ・ロスの動的多期RSIトレンド 戦略に従う
- ダイナミック・ダブル・ムービング・メアワー・ブレークスルー・トレーディング・システム
- 多指標クロスオーバーモメントトレンド 戦略をフォローし,最適化された利益とストップ・ロスのシステム
- RSIモメント戦略で三角突破
- 適応性重度のトレンド (VIDYAマルチインジケータシステム)
- 強化された二重ピボットポイント逆転取引戦略
- AO 多層次量的な傾向強化戦略
- DPO-EMA トレンドクロスオーバー 定量戦略研究
- EMA-MACD 高頻度量的な戦略とスマートなリスク管理
- リスク管理システム付きのマルチEMAトレンド・モメンタム・トレード戦略
- 動向平均フィルター (HBTS) を搭載した過去ブレイクトレンドシステム
- ポジションスケーリングによるマルチRSI-EMAモメントヘッジ戦略
- ダイナミック・デュアル・EMA・クロスオーバー・量子的取引戦略
- トレーリング・プロフィート・ロック付きのマルチEMA自動取引システム