動的移動平均傾向をRSI確認取引戦略でフォローする
作者: リン・ハーンチャオチャン開催日:2024年12月27日15時05分タグ:エイマRSI

概要
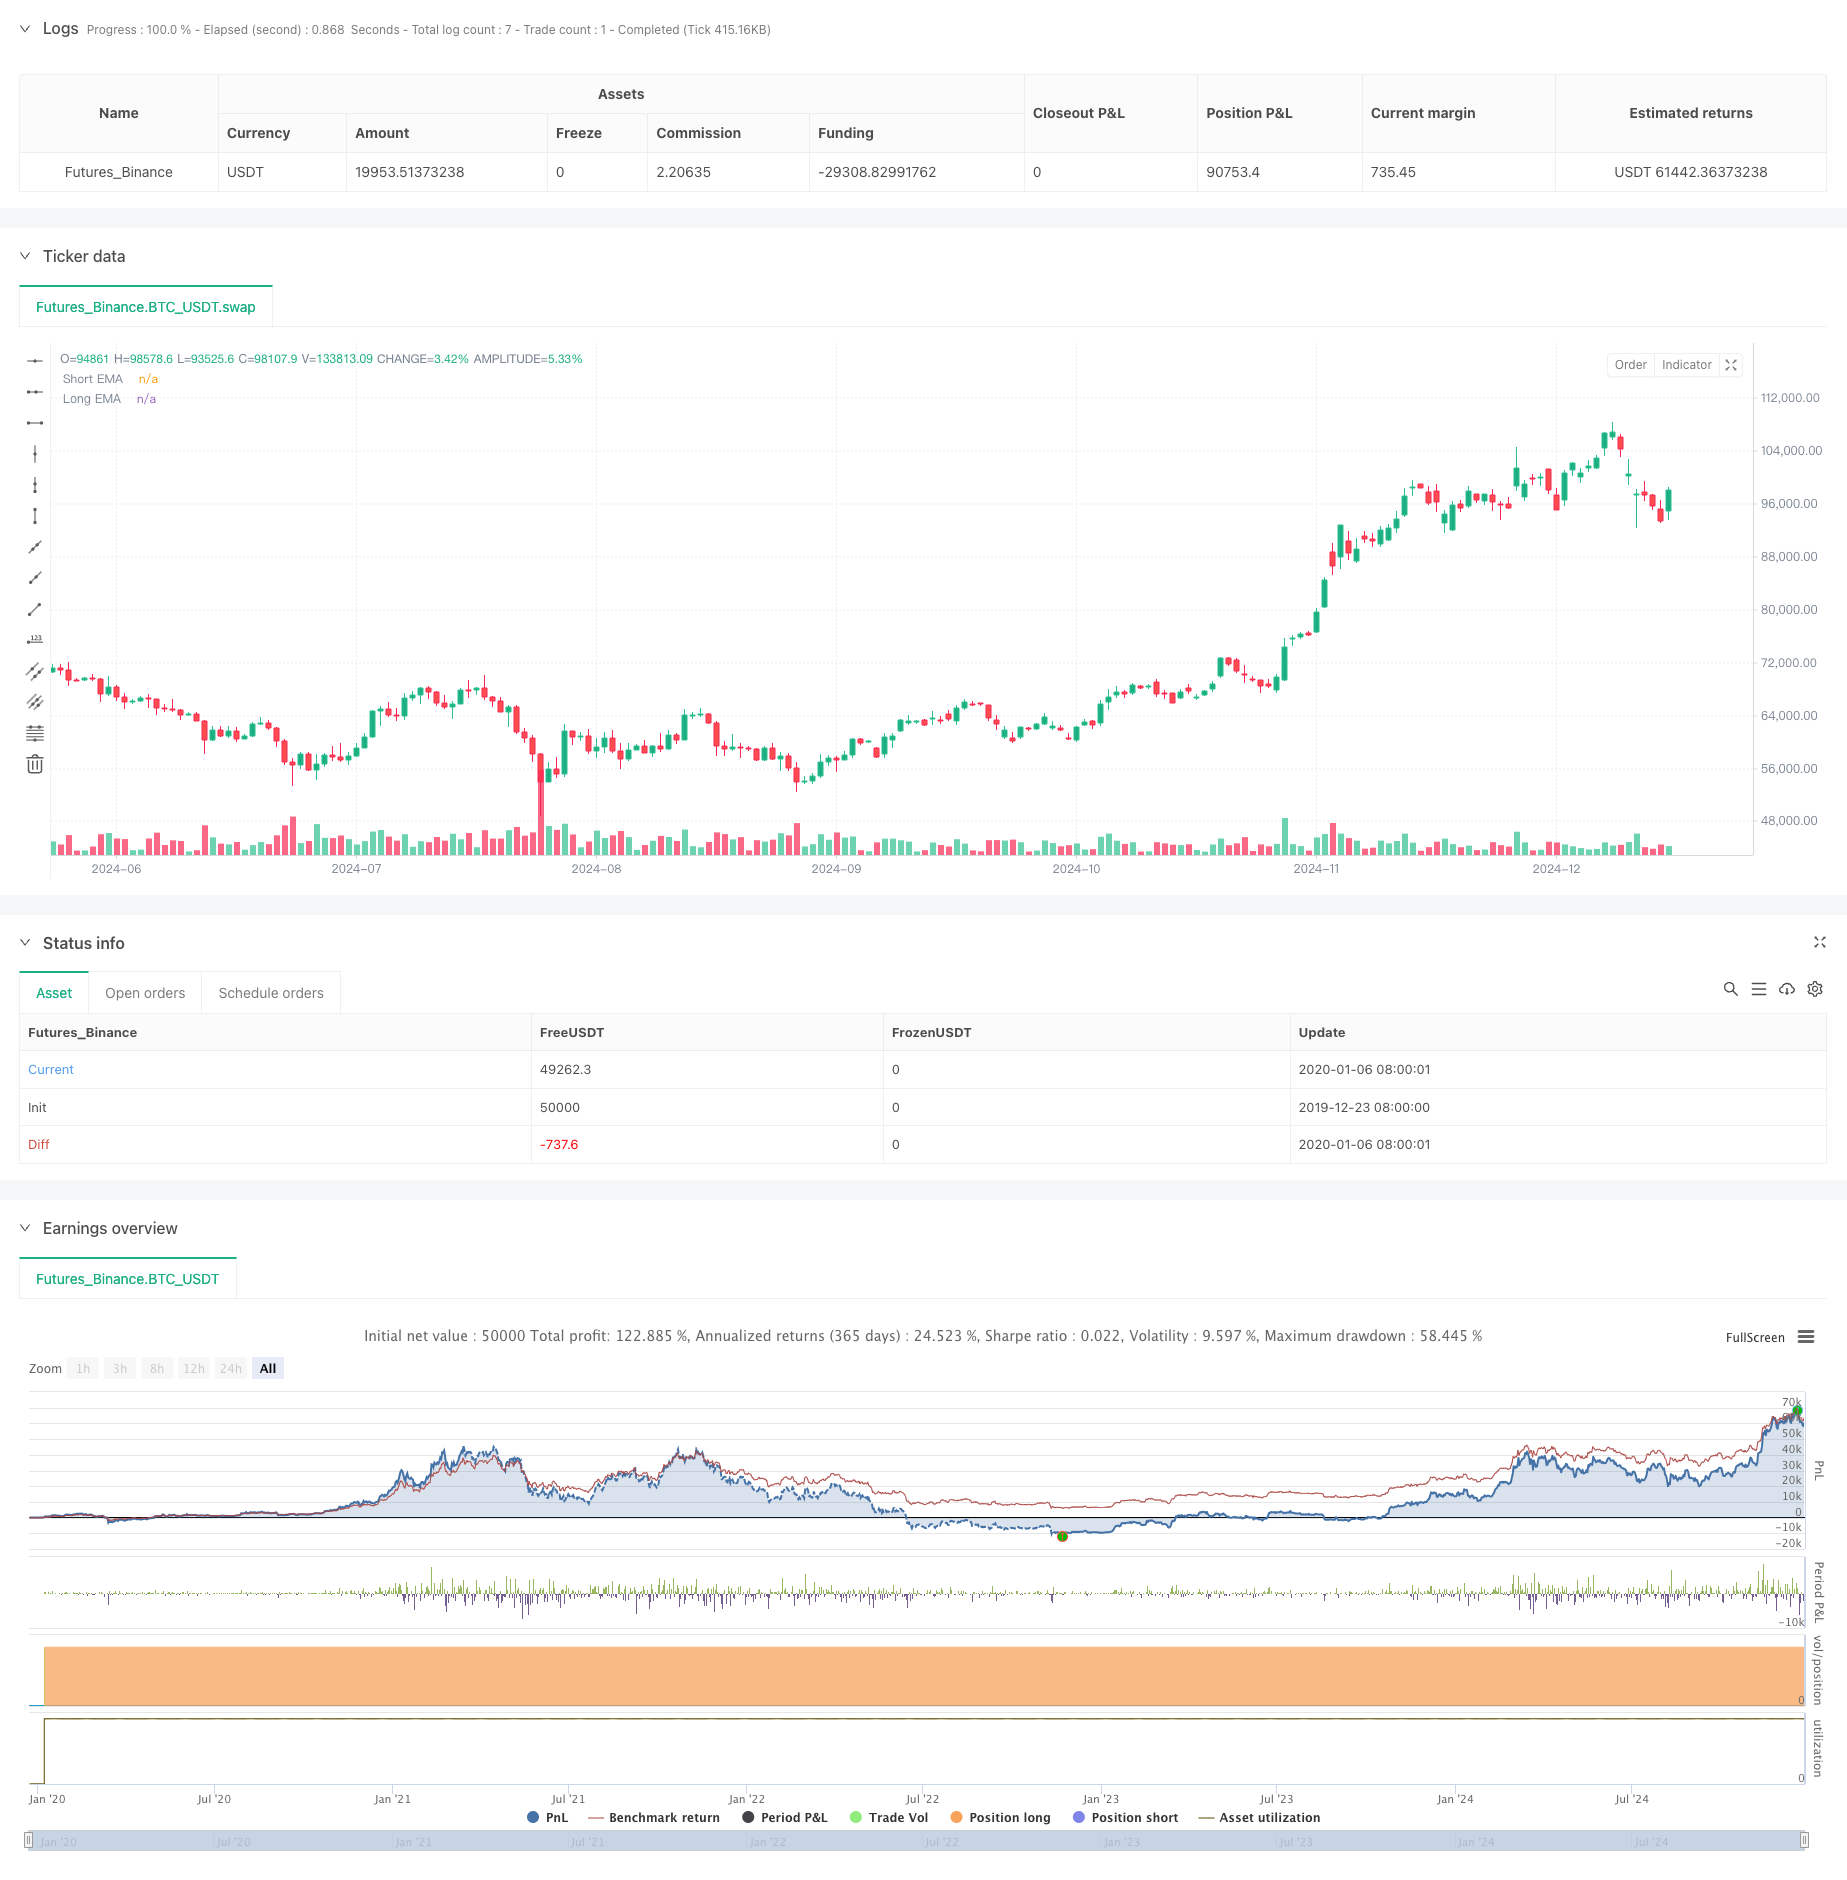
これは指数動平均 (EMA) クロスオーバーと相対強度指数 (RSI) の確認に基づいたトレンドフォロー戦略である.この戦略は,短期間および長期間のEMA クロスオーバーからの信号とRSIモメントの確認を組み合わせ,パーセントベースのストップロスのメカニズムを組み込む.技術指標のシネージ効果を通じてリスク制御を維持しながら,重要な市場トレンド逆転を把握することを目的としている.
戦略の原則
この戦略は2つの技術指標フィルタリングメカニズムを使用している.まず,短期EMA (9期) と長期EMA (21期) のクロスオーバーを通じて潜在的なトレンド逆転点を特定する.短期EMAが長期EMAを超越し,RSI値が指定値を超えると購入信号が生成される.短期EMAが長期EMAを下回り,RSI値が指定値を下回るときに販売信号が発生する.さらに,この戦略は百分比ベースのストップ損失メカニズムを組み込み,ダウンサイドリスクを効果的に制御するために,各取引に動的なストップ損失レベルを設定する.
戦略 の 利点
- 双重技術指標の確認メカニズムは,取引信号の信頼性を著しく向上させ,誤った信号を減らす.
- ダイナミックストップ・ロスのメカニズムは,それぞれの取引に対するリスクリスクを効果的に制御します.
- 高いパラメータ調整能力により,トレーダーは異なる市場環境に適応できます
- 分かりやすく実行できる明確な戦略論理
- 視覚化されたシグナル表示とストップ・ロストラインにより,取引決定がより直感的にできます
戦略リスク
- 取引コストを増加させ,様々な市場で頻繁に取引信号を生成する可能性があります.
- EMAは遅れている指標として,非常に不安定な市場では十分に迅速に対応しない可能性があります.
- RSI確認メカニズムは,特定の市場条件下で重要なトレンド開始を逃す可能性があります.
- 固定パーセントのストップ・ロスは,変動する市場では過度に厳しく,過度に緩やかかもしれません.
戦略の最適化方向
- 変動指標を導入し,ストップ・ロスの割合を動的に調整し,より適応性の高いリスク管理を行う
- 傾向強度フィルターを追加し,弱い傾向市場での頻繁な取引を避ける
- 信号品質を改善するための追加の確認メカニズムとして音量指標を統合する
- 累積利益のよりよい保護のために,ストップ・ロスのメカニズムを追加する
- 市場環境分類を組み込むことを検討し,異なる市場状態における異なるパラメータを使用する.
概要
この戦略は,移動平均値とモメンタム指標の組み合わせを通じて,完全なトレンドフォローする取引システムを構築する.その主な利点は,信頼できる信号確認メカニズムと包括的なリスク制御システムにある.固有の限界があるものの,戦略の全体的なパフォーマンスは,提案された最適化方向性によってさらに向上することができる.これは中長期トレンドトレーダーに適した強力な戦略フレームワークである.
/*backtest
start: 2019-12-23 08:00:00
end: 2024-12-25 08:00:00
period: 1d
basePeriod: 1d
exchanges: [{"eid":"Futures_Binance","currency":"BTC_USDT"}]
*/

//@version=5
strategy("Simple Trend Following Strategy", overlay=true)

// Inputs
shortEMA = input.int(9, title="Short EMA Length", minval=1)
longEMA = input.int(21, title="Long EMA Length", minval=1)
confirmationRSI = input.int(50, title="RSI Confirmation Level", minval=1, maxval=100)
stopLossPercent = input.float(2, title="Stop Loss Percentage", minval=0.1)  // Stop Loss percentage

// Calculations
emaShort = ta.ema(close, shortEMA)
emaLong = ta.ema(close, longEMA)

rsiValue = ta.rsi(close, 14)

// Buy and Sell Conditions
buySignal = ta.crossover(emaShort, emaLong) and rsiValue > confirmationRSI
sellSignal = ta.crossunder(emaShort, emaLong) and rsiValue < confirmationRSI

// Plotting Signals
plotshape(buySignal, title="Buy Signal", location=location.belowbar, color=color.green, style=shape.labelup, text="BUY")
plotshape(sellSignal, title="Sell Signal", location=location.abovebar, color=color.red, style=shape.labeldown, text="SELL")

// Plotting EMAs
plot(emaShort, title="Short EMA", color=color.yellow)
plot(emaLong, title="Long EMA", color=color.purple)

// Strategy logic
strategy.entry("Buy", strategy.long, when=buySignal)
strategy.entry("Sell", strategy.short, when=sellSignal)

// Calculate stop loss price based on stopLossPercent
longStopLossPrice = strategy.position_avg_price * (1 - stopLossPercent / 100)
shortStopLossPrice = strategy.position_avg_price * (1 + stopLossPercent / 100)

// Draw stop loss line for long positions
if (strategy.position_size > 0)  // For long positions
    line.new(x1=bar_index, y1=longStopLossPrice, x2=bar_index + 1, y2=longStopLossPrice, color=color.red, width=2, style=line.style_dashed)

// Draw stop loss line for short positions
if (strategy.position_size < 0)  // For short positions
    line.new(x1=bar_index, y1=shortStopLossPrice, x2=bar_index + 1, y2=shortStopLossPrice, color=color.green, width=2, style=line.style_dashed)
関連性
- 双 EMA RSI モメンタム トレンド 逆転 トレーディング システム - EMA と RSI クロスオーバー をベースにしたモメンタム 突破戦略
- EMAクロスオーバーフィボナッチ逆転戦略
- 低値探知器
- EMA,RSI,ボリューム価格トレンド
- 複合戦略をフォローする多期RSIモメンタムと三重EMAトレンド
- RSIとEMAを組み合わせた多期量的なダイナミック取引戦略
- EMAの上昇型クロスオーバー戦略
- 戦略をフォローする多指標の傾向
- 双指数移動平均値と相対強度指標のクロスオーバー戦略
- 暗号期貨は,ma & rsi - ogcheckersで毎時間スカルパー
もっと
- クラウドベースのボリンガー帯 双動平均量的な傾向戦略
- Bollinger Bands Trend Divergence に基づいた多レベル量的な取引戦略
- フィボナッチ0.7レベルトレンドブレークスルーに基づく定量的な取引戦略
- 多期フラクタルブレイクオーダーブロック 適応型取引戦略
- 移動平均のクロスオーバーに基づくリスク/報酬比最適化戦略
- ダイナミック・トレンドの認識のトレーディング戦略をフォローする適応傾向
- 境界を越えた動的範囲量的な取引戦略 ボリンジャー帯に基づく
- モメントベースのSMIクロスオーバー信号適応予測戦略
- 複数の移動平均クロスオーバー・シグナル 強化取引戦略
- Bollinger Bands と Woodies CCI を使った多指標フィルタリング取引戦略
- プルバック最適化システムを持つ多期指数移動平均のダイナミッククロス戦略
- ダイナミック・ムービング・メアージャー・クロスオーバー・トレンド 適応型リスク管理による戦略
- ストカスティックRSIをベースにした適応型取引戦略
- 動的ポジションスケーリングシステムを持つ多レベル機関オーダーフロー量的な戦略
- マルチEMA動的トレンドキャプチャ量的な取引戦略
- 固定ストップ・ロスの最適化モデルによる動的移動平均値とボリンジャー・バンドのクロス戦略
- RSIトレンド逆転取引戦略 ATRストップ損失と取引エリア制御
- オシレーターとダイナミックサポート/レジスタンスの取引戦略を持つマルチEMAクロス
- 複数のSMAとストーカスティックの組み合わせたトレンド
- 標準化されたロガリズムリターンに基づく適応動的取引戦略