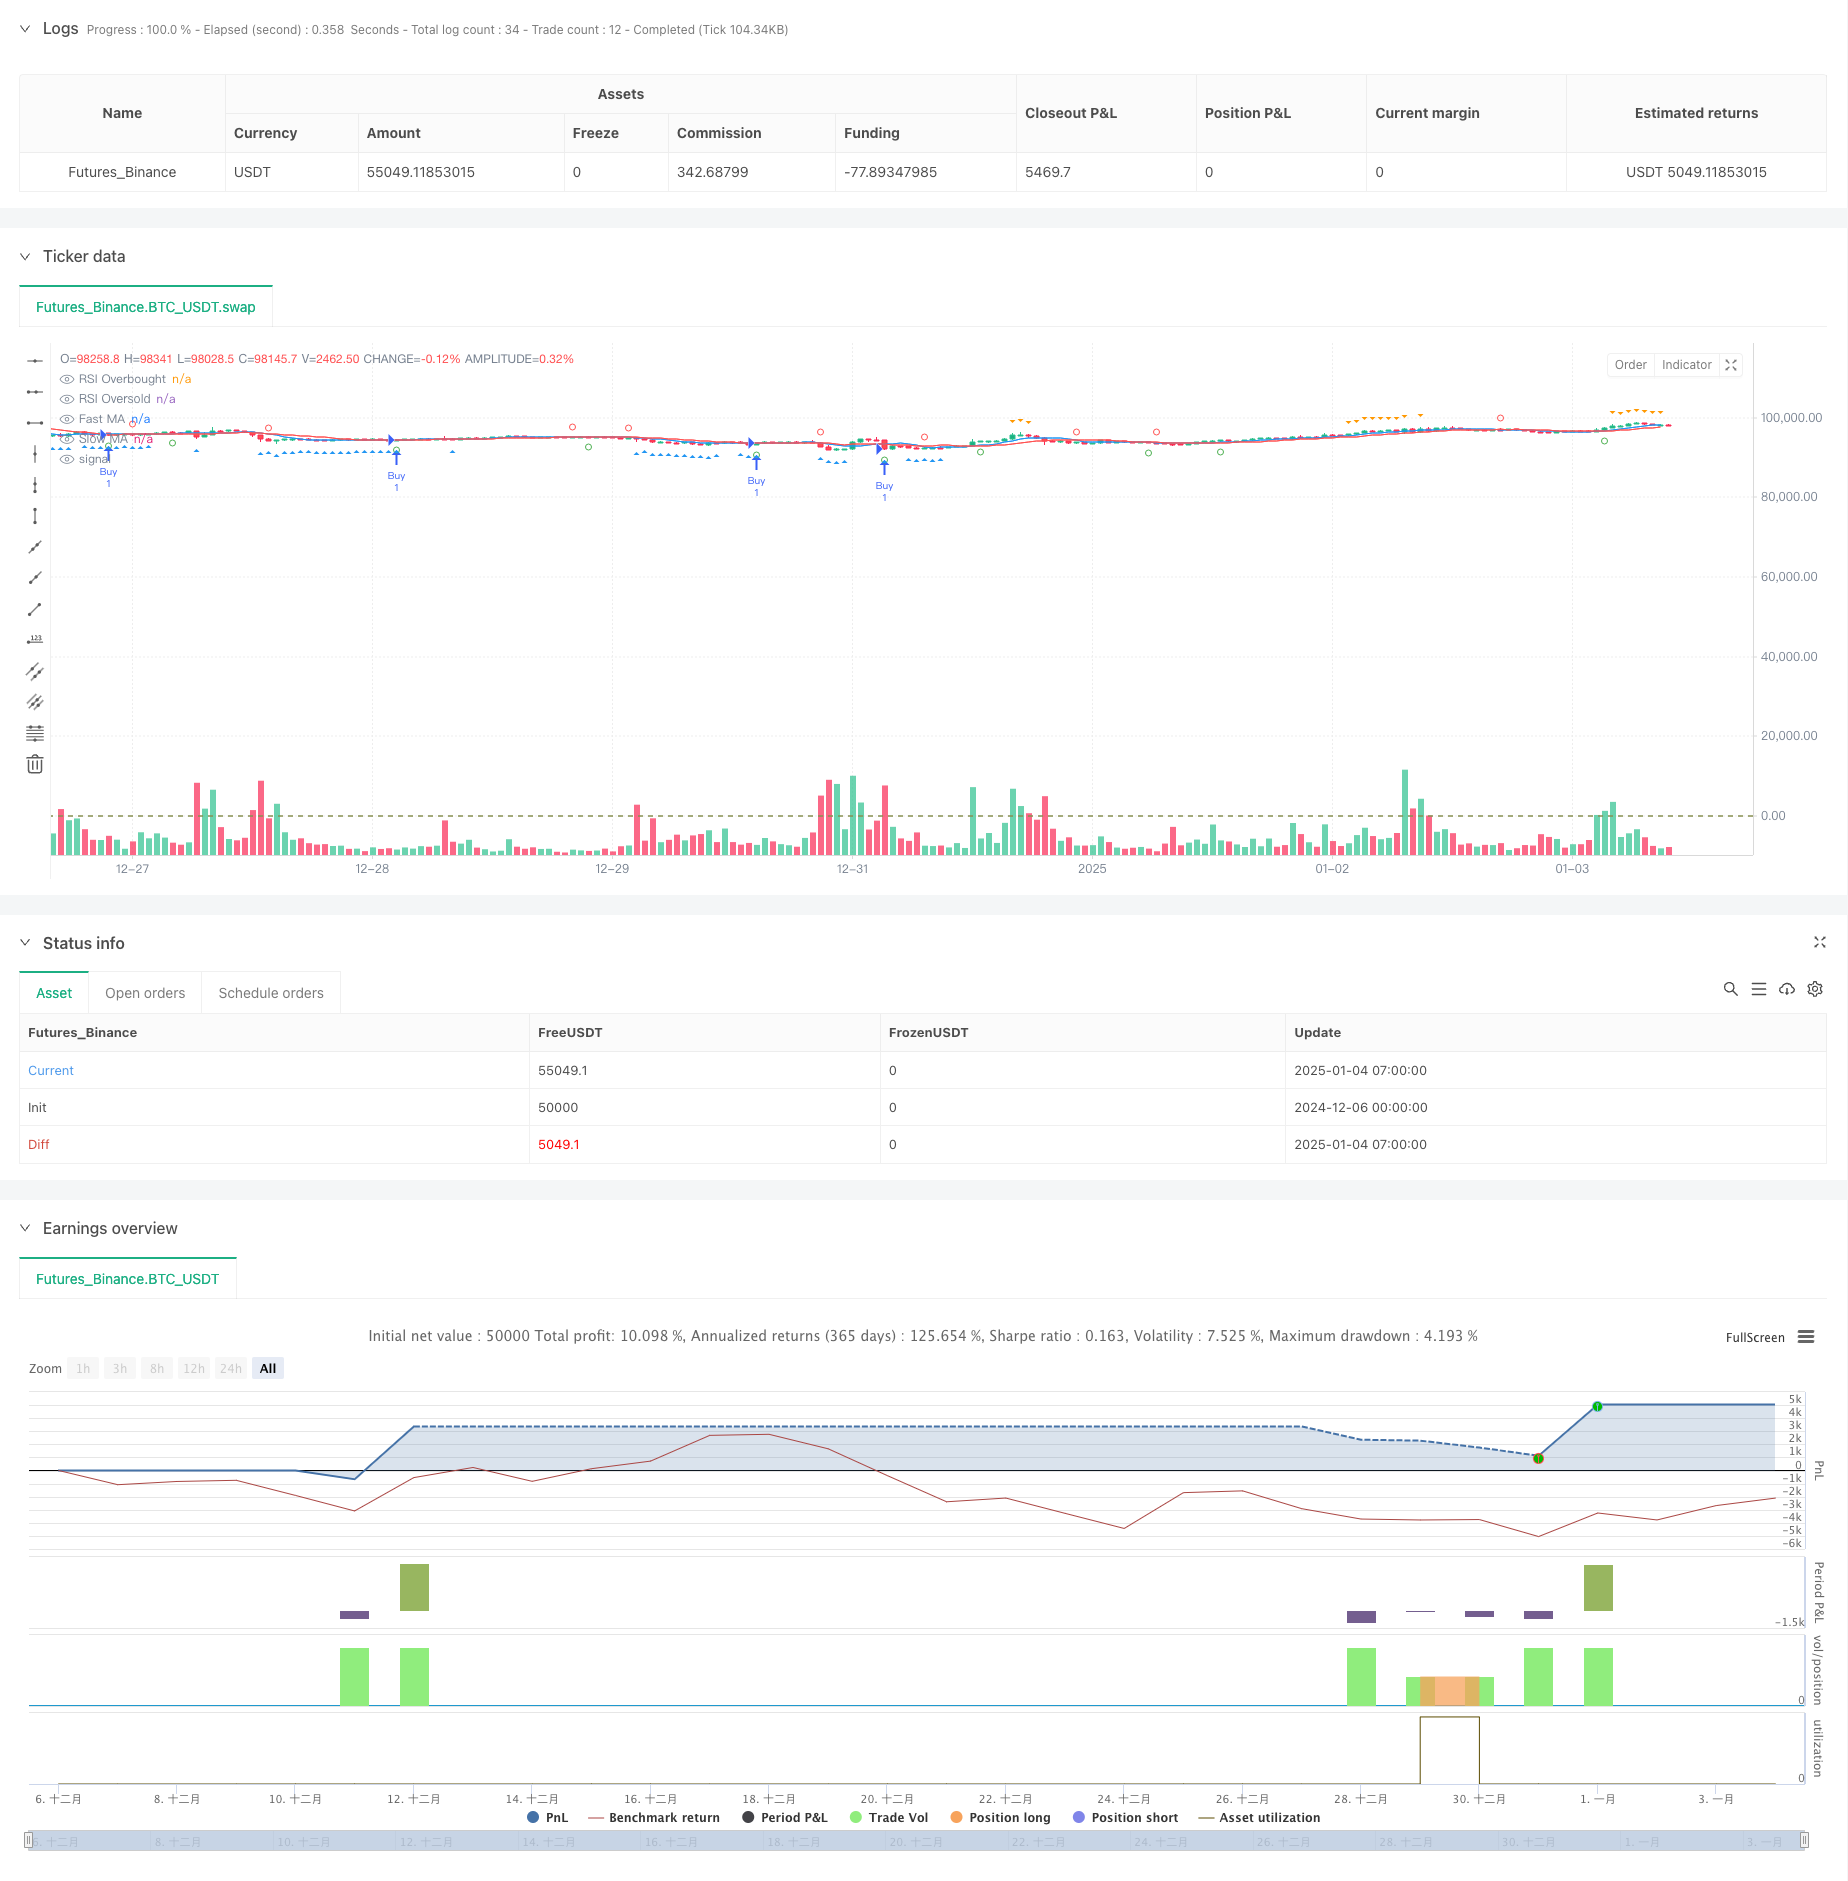
双動平均-RSI シネージオプション 定量取引戦略
作者: リン・ハーンチャオチャン, 日付: 2025-01-06 15:24:09タグ:RSIマルチSMATPSL

概要
この戦略は,移動平均クロスオーバーとRSI指標に基づいた定量的な取引システムで,主にオプション市場取引のために設計されています.この戦略は,リスク管理のための利益とストップロスのメカニズムを実装しながら,取引機会を決定するために,RSIオーバーバイト/オーバーセールレベルと組み合わせた,高速で遅い移動平均クロスオーバー信号を使用します.この戦略は5分間のタイムフレーム取引に最適化されています.
戦略の原則
この戦略は,2つの主要な技術指標を採用しています.移動平均値 (MA) と相対強度指数 (RSI).具体的には:
- 価格動向を把握するために 7 期間の 13 期間の単純な移動平均値 (SMA) を使用する
- 17 期間の RSI を使って,過買い/過売り条件を特定する.
- 速いMAが遅いMAを超え,RSIが43以下になると長い信号を生成する.
- 短信号を生成します. 速いMAが遅いMAを下回り,RSIが64を超えると.
- リスク管理のために 4%のメリットと 0.5%のストップ・ロスを実施する
戦略 の 利点
- 複数の確認メカニズム: より信頼性の高い取引信号のために,MAクロスオーバーとRSI指標を組み合わせます.
- 総合的なリスク管理: 固定金利率とストップ・ロスのリスクを効果的に制御する
- 高い適応性:パラメータは,異なる市場条件に柔軟に調整できます
- 視覚的サポート: 戦略は市場をよりよく理解するための明確なグラフィック指標を提供します
- 明確な運用規則: 明確な入出条件は主観的な判断への干渉を軽減する
戦略リスク
- 変動市場リスク: 範囲限定の市場で頻繁に誤った信号を生む可能性があります.
- 低流動性オプション市場における潜在的重大なスリップリスク
- パラメータ感度: 戦略の性能はパラメータ設定に敏感で,継続的な最適化が必要です.
- 市場環境による依存:非常に不安定な市場条件では,ストップ・ロスはタイミングが合わない可能性があります.
- システムリスク: 市場格差や重大イベントの際にストップ・ロスは失敗する可能性があります.
戦略の最適化方向
- 波動性指標を組み込む:決定システムにATRまたはボリンジャー帯を追加することを検討する
- パラメータ調整を最適化: 市場の状況に基づいて動的パラメータ調整メカニズムを開発
- 市場情緒フィルタリングを追加: 誤った信号をフィルタリングするためにボリューム指標を統合
- ストップ・ロスのメカニズムの改善: より良いリスク管理のためにトライルストップの実施を検討する
- 時間フィルタリングを追加:非効率な取引期間を避けるために取引時間窓を組み込む
概要
この戦略は,MAクロスオーバーとRSIインジケーターを組み合わせて比較的完全な取引システムを構築する.その強みは複数の信号の確認と包括的なリスク管理にある.一方で,戦略のパフォーマンスに対する市場の状況の影響に注意を払う必要があります.継続的な最適化と改善を通じて,戦略はオプション市場で安定したパフォーマンスの約束を示しています.トレーダーはライブ実装の前に徹底的なバックテストとパラメータ最適化を行うことをお勧めします.
/*backtest
start: 2024-12-06 00:00:00
end: 2025-01-04 08:00:00
period: 1h
basePeriod: 1h
exchanges: [{"eid":"Futures_Binance","currency":"BTC_USDT"}]
*/

//@version=5
strategy("MA Crossover with RSI Debugging", overlay=true)

// Inputs
fastLength = input.int(7, title="Fast MA Length", minval=1)
slowLength = input.int(13, title="Slow MA Length", minval=1)
rsiLength = input.int(17, title="RSI Length", minval=1)
rsiOverbought = input.int(64, title="RSI Overbought Level", minval=50, maxval=100)
rsiOversold = input.int(43, title="RSI Oversold Level", minval=0, maxval=50)
takeProfitPerc = input.float(4, title="Take Profit (%)", minval=0.1)
stopLossPerc = input.float(0.5, title="Stop Loss (%)", minval=0.1)

// Moving Averages
fastMA = ta.sma(close, fastLength)
slowMA = ta.sma(close, slowLength)

// RSI
rsi = ta.rsi(close, rsiLength)

// Entry Conditions
longCondition = ta.crossover(fastMA, slowMA) and rsi < rsiOversold
shortCondition = ta.crossunder(fastMA, slowMA) and rsi > rsiOverbought

// Plot Debugging Shapes
plotshape(ta.crossover(fastMA, slowMA), color=color.green, style=shape.circle, location=location.belowbar, title="Fast MA Crossover")
plotshape(ta.crossunder(fastMA, slowMA), color=color.red, style=shape.circle, location=location.abovebar, title="Fast MA Crossunder")

plotshape(rsi < rsiOversold, color=color.blue, style=shape.triangleup, location=location.belowbar, title="RSI Oversold")
plotshape(rsi > rsiOverbought, color=color.orange, style=shape.triangledown, location=location.abovebar, title="RSI Overbought")

// Entry and Exit Execution
if (longCondition)
    strategy.entry("Buy", strategy.long)

if (shortCondition)
    strategy.entry("Sell", strategy.short)

takeProfitPrice = strategy.position_avg_price * (1 + takeProfitPerc / 100)
stopLossPrice = strategy.position_avg_price * (1 - stopLossPerc / 100)

if (strategy.position_size > 0)
    strategy.exit("Exit Buy", from_entry="Buy", limit=takeProfitPrice, stop=stopLossPrice)

if (strategy.position_size < 0)
    strategy.exit("Exit Sell", from_entry="Sell", limit=takeProfitPrice, stop=stopLossPrice)

// Plot Moving Averages
plot(fastMA, color=color.blue, title="Fast MA")
plot(slowMA, color=color.red, title="Slow MA")

// RSI Levels
hline(rsiOverbought, "RSI Overbought", color=color.red)
hline(rsiOversold, "RSI Oversold", color=color.green)
関連性
- RSI トレンド・モメント・トラッキング・ストラテジーによる移動平均のクロスオーバー
- RSIと移動平均の組み合わせた定量取引戦略の傾向
- トレンドフィルターと例外出口のスムーズな移動平均ストップ・ロスト&テイク・プロフィート戦略
- 動的動向を追求する戦略 - 多指標統合動力分析システム
- トレンド・ブレイク・トレーディング・システム (TBMA戦略)
- ダイナミック・トライル・ストップ ダブル・ターゲット・ムービング・平均・クロスオーバー戦略
- ダイナミックな利益/損失管理システムによる4期間のSMA突破取引戦略
- アダプティブ・量子的取引戦略,ダブル・ムービング・平均クロスオーバーと,利益/ストップ・ロスを取る
- 調整可能なストップ・ロストとテイク・プロフィートを持つ二重移動平均クロスオーバー戦略
- 2つのタイムフレームストーカスティックモメンタム取引戦略
もっと
- 動的波動性調整トレンド 戦略をフォローする ATRストップ管理によるDI指標に基づく戦略
- ボリューム・パーセンチルベースのダイナミック・テイク・プロフィート・システムによるブル・ベア・パワー・トレーディング戦略
- Zスコア標準化線形信号量的な取引戦略
- 多パラメータストカスティック・インテリジェント・トレンド・トレーディング・戦略
- 複数のEMAと価格・ボリューム・モメント・トレード戦略を交差する
- 複数の期間の価格レベル ブレイクトレンド取引システム キー価格レベルに基づく
- 先進的なフィボナッチリトレースメント トレンドフォローおよび逆転取引戦略
- ATRベースのダイナミックストップ管理システムによる高度なEMAクロスオーバートレンドフォロー戦略
- 平均逆転 ボリンガー帯 合理的リターン信号付きの取引戦略
- 多期移動平均傾向 VWAPクロス戦略をフォローする
- アドバンスト・ウェーブトレンドとEMAのリボン・フュージョン・トレーディング戦略
- ボリンジャー・バンドス ブレイクモメント・トレード戦略
- 複数の指標の確率
値 モメント トレンド・トレード戦略 - 多期EMA傾向は,RSIの過買い/過売動的最適化戦略をフォローする
- 多期ダイナミック・シグナル統合 ICT スマート構造 突破戦略
- 相対的な強さとRSIに基づく戦略をフォローするダイナミックトレンド
- 多指標動的モメントクロス戦略
- 運動量と平均逆転を組み合わせた高周波定量戦略
- 動的ATR調整EMAクロスオーバー戦略
- 先進的な圧力逆転とキャンドルスタイク重複戦略