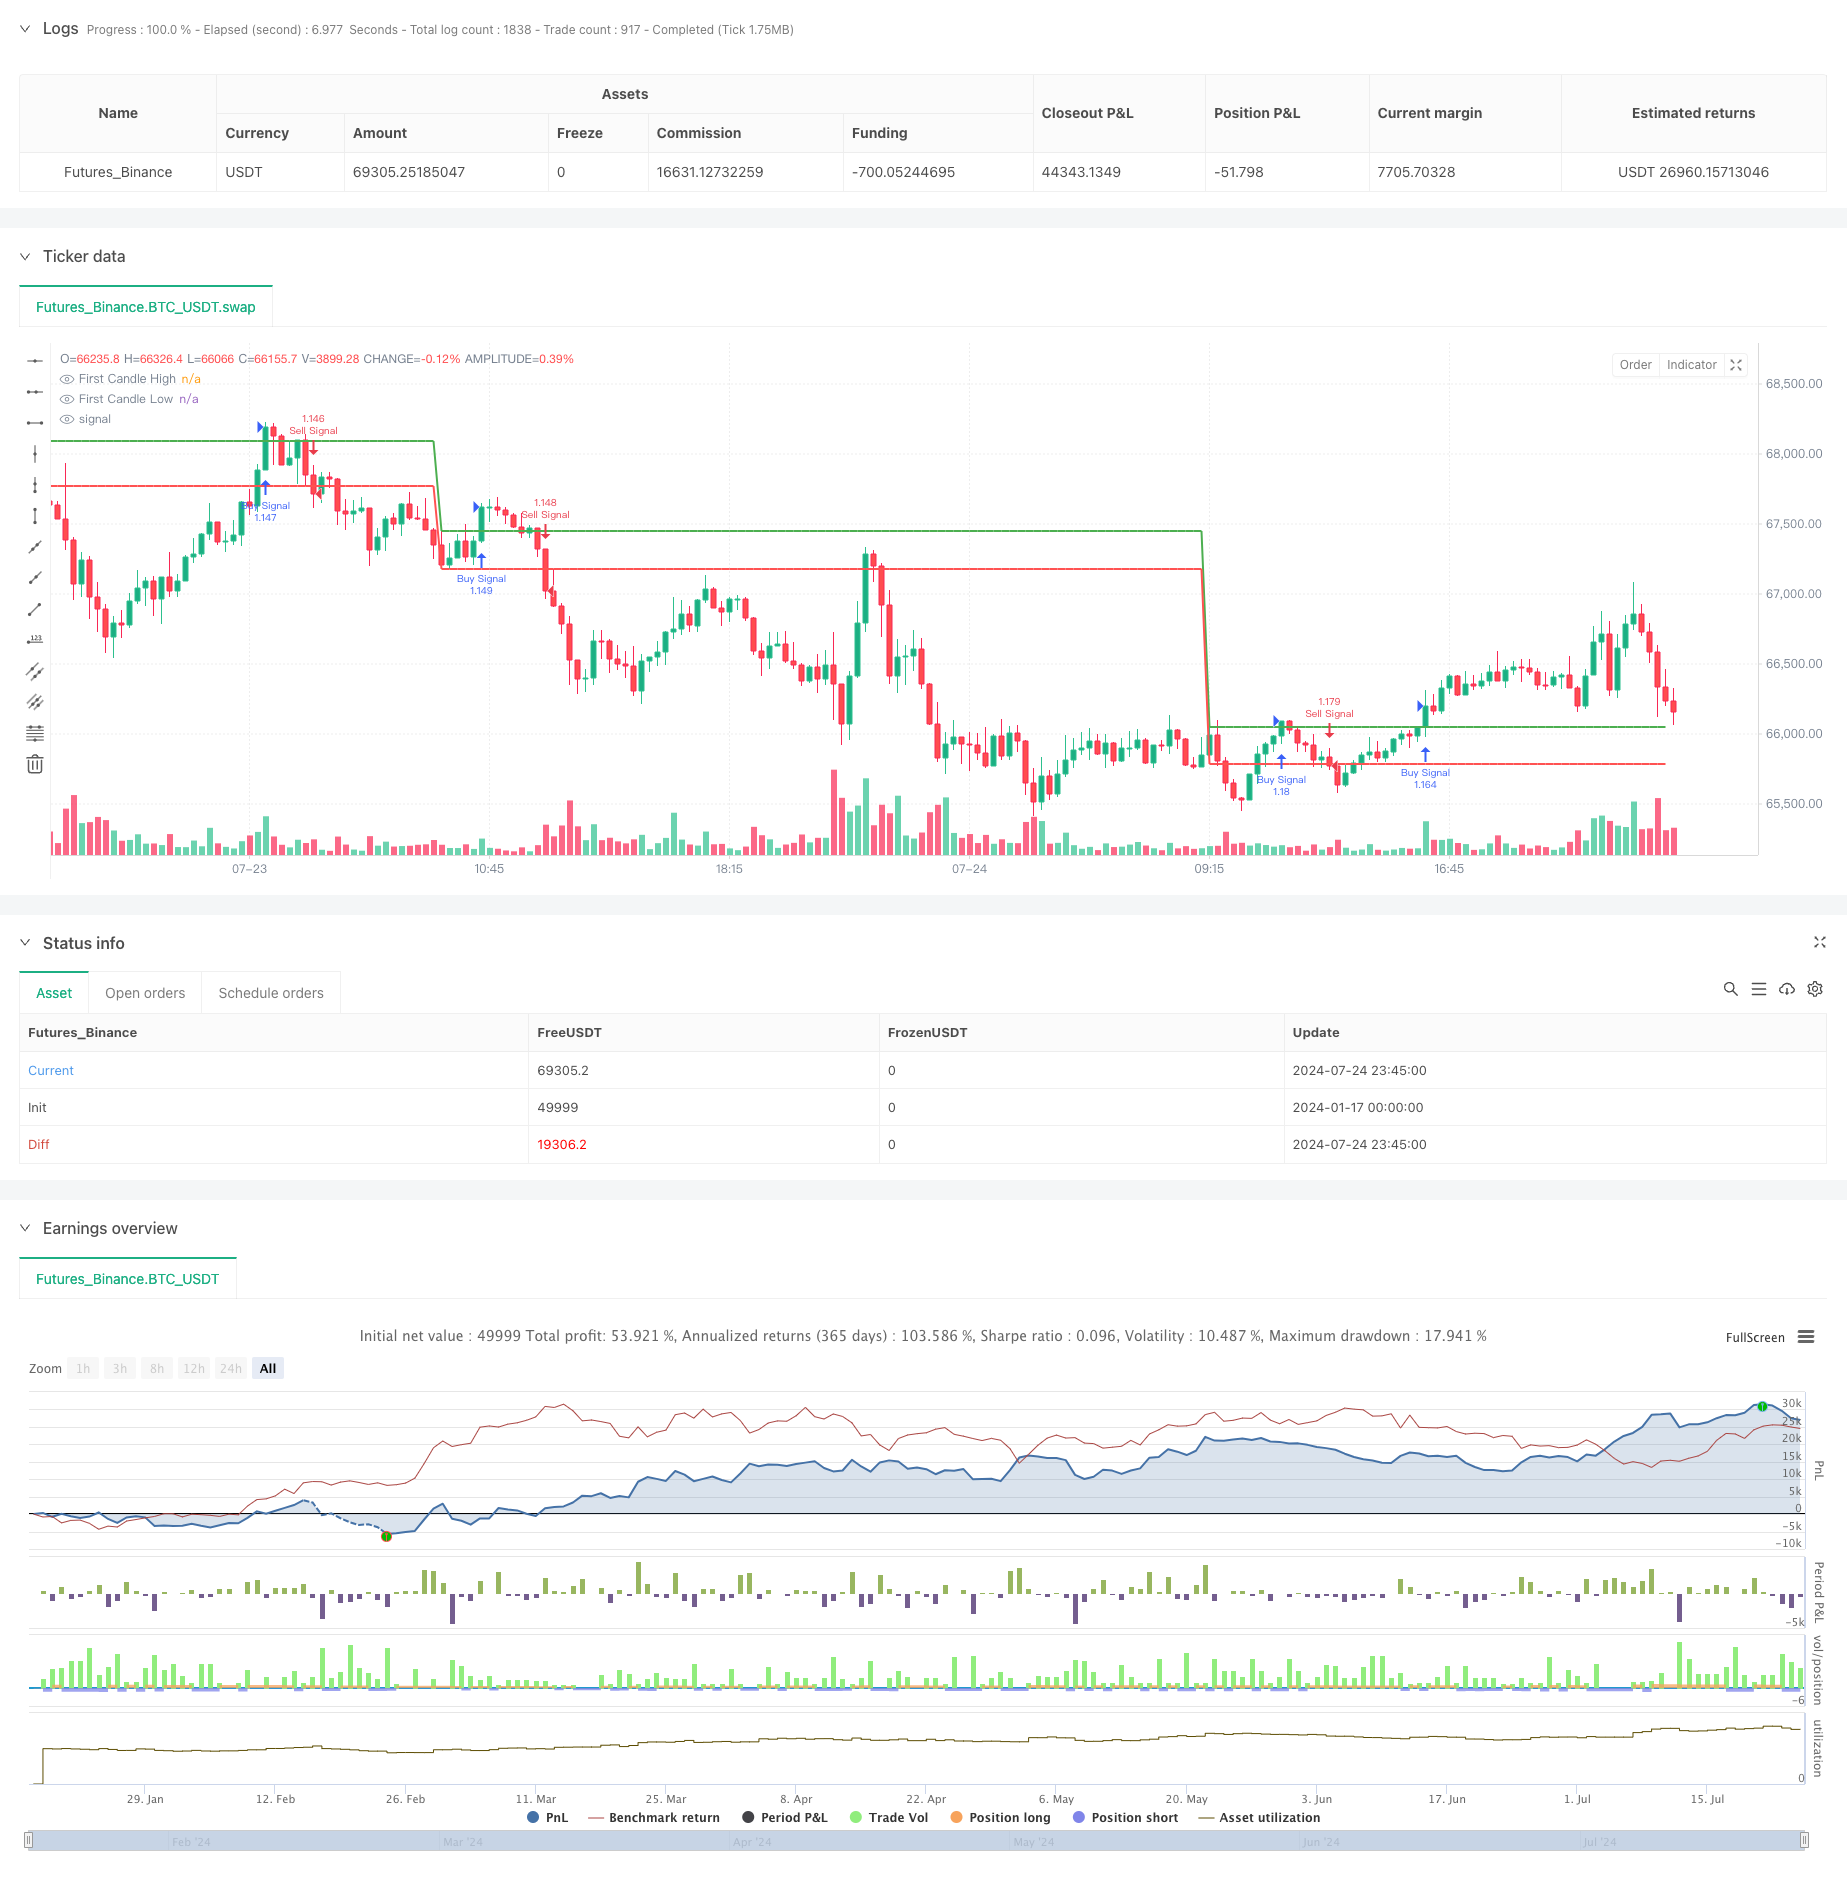
効率的な価格チャネル取引戦略 15分ブレイクベース
作者: リン・ハーンチャオチャン開催日:2025年1月17日 14:49:53タグ:マルチRSICCIATRFCHFCL

概要
この戦略は15分間のキャンドルスタックチャートに基づいたブレークアウト取引システムである.コアアイデアは,各取引日の最初の15分間のキャンドルの高低点を使用して価格チャネルを構築し,このチャネルの価格ブレークアウトを通じて市場のトレンドを把握することである.この戦略は,開業期間の価格変動範囲を分析することによって,イントラデイ取引のための明確なエントリー信号を提供します.
戦略の原則
この戦略は以下の基本原則に基づいて機能します. 1. タイム ウィンドウ ロック - この戦略は,通常重要な価格情報を含む9時15分に最初のキャンドルを捕獲することに焦点を当てています. 2. 価格チャネル構築 - 最初のキャンドルの高値と低値を使用して上値と下値を設定し,取引チャネルを形成する. 3. ブレイクシグナル生成 - 価格がチャネルの上を閉じる時,ロングシグナルと下を閉じる時,ショートシグナルを生成する. 4. 自動実行 - 感情的干渉を避けるためにプログラムコードを通じて完全に自動化された取引を実装する.
戦略 の 利点
- シンプルで直感的な - 明確な戦略論理,理解し実行しやすい,すべてのレベルのトレーダーに適しています.
- 高時間効率 - 営業時間中の高変動を標的にして市場の方向性を迅速に把握します.
- 制御可能なリスク - 定義された価格チャネルを通じてストップ・ロストとテイク・プロフィートの客観的な参照を提供します.
- 適性 - 戦略は,良い普遍性を持つ様々な取引手段に適用できます.
- 高自動化レベル - 完全なプログラム実装は,取引の客観性と実行効率を保証します.
戦略リスク
- 誤ったブレイクリスク - 市場では誤ったブレイクが発生し,誤った信号が発信される可能性があります.
- 波動性依存性 - 低波動性環境では戦略のパフォーマンスが不最適である可能性があります.
- 期間制限 - 特定の期間のみに適用され,他の時間帯で機会を逃す可能性があります.
- スリップ効果 - 変動が激しい市場では,大きなスリップが発生する可能性があります.
- テクニカル・ディペンデンス - 正確な実行のために安定したテクニカル・環境が必要です.
戦略の最適化方向
- 波動性フィルタリングを導入する - 波動性の低い環境でシグナルをフィルターするためにATRインジケーターを追加する.
- 入力のタイミングを最適化 - 突破の有効性を確認するためのボリューム指標を組み込む.
- トレンド 確認 を 追加 する - 信号 の 品質 を 向上 する ため に,移動 平均 の よう な トレンド 指標 を 含める.
- ダイナミックストップ・ロスの最適化 - 市場の変動に基づいてストップ・ロスのポジションを調整する.
- タイムウィンドウを改善する - 取引期間を最適化するために,異なるタイムウィンドウのパフォーマンスを研究する.
概要
この戦略は,開拓期価格ブレイクをモニタリングすることによってシンプルでも効果的な取引方法を提供します.その主な利点はシンプルな論理と明確な実行にありますが,トレーダーは偽ブレイクリスクと市場環境適応性を認識する必要があります.継続的な最適化とリスク管理の改善を通じて,戦略は実際の取引でより良いパフォーマンスを達成する可能性があります.成功の適用には,トレーダーは市場の特徴を深く理解し,リスク耐性に基づいて合理的な調整を行う必要があります.
/*backtest
start: 2024-01-17 00:00:00
end: 2024-07-25 00:00:00
period: 15m
basePeriod: 15m
exchanges: [{"eid":"Futures_Binance","currency":"BTC_USDT","balance":49999}]
*/

// This Pine Script™ code is subject to the terms of the Mozilla Public License 2.0 at https://mozilla.org/MPL/2.0/
// © OLYANGO
//@version=5
strategy("15 Min Breakout Strategy by https://x.com/iamgod43 (Yallappa) ", overlay=true, default_qty_type=strategy.percent_of_equity, default_qty_value=100)

// Define the start of backtest period
startDate = timestamp(2023, 1, 1, 0, 0)

// Ensure the script is run on a 15-minute chart
// if (timeframe.period != "15")
//     alert("Switch to a 15-minute chart for this strategy.", alert.freq_once_per_bar_close)

// Variables to store the first 15-minute candle's high and low
var float firstCandleHigh = na
var float firstCandleLow = na
var bool isFirstCandleCaptured = false

// Detect the first candle of the session
isFirstCandle = (hour == 9 and minute == 15)

// Reset first candle values for the new session
if isFirstCandle
    firstCandleHigh := high
    firstCandleLow := low
    isFirstCandleCaptured := true

// Check for breakout conditions
longCondition = isFirstCandleCaptured and close > firstCandleHigh
shortCondition = isFirstCandleCaptured and close < firstCandleLow

// Entry signals
if longCondition
    strategy.entry("Buy Signal", strategy.long)

if shortCondition
    strategy.entry("Sell Signal", strategy.short)

// Plot the first 15-minute candle high and low
plot(isFirstCandleCaptured ? firstCandleHigh : na, color=color.green, linewidth=2, title="First Candle High")
plot(isFirstCandleCaptured ? firstCandleLow : na, color=color.red, linewidth=2, title="First Candle Low")

// Backtesting start date logic
if time < startDate
    strategy.close_all("Pre-Backtest Period")
関連性
- ターンオーバー火曜日の戦略 (週末フィルター)
- RSI-ATR モメント・ボラティリティ コンビネード・トレーディング・ストラテジー
- 多レベルダイナミックトレンドフォローシステム
- 複数の指標を備えた インテリジェントピラミッド戦略
- 目標とストップ・ロスの最適化により強化されたブレークアウト戦略
- AlphaTradingBotの取引戦略
- 戦略をフォローする多指標の傾向
- 朝のろうそく 破裂と逆転戦略
- 動向フィルタリングによるトレンドフォローする取引戦略
- ダイナミック・ダブル・インディケーター・モメント・トレンド 定量戦略システム
もっと
- 流動性重量化された移動平均動力量クロスオーバー戦略
- 多指標シネージシストトレンド逆転量的な取引戦略
- 多チャネル動的サポート抵抗 ケルトナーチャネル戦略
- 機械学習 適応型スーパートレンド 定量的な取引戦略
- ダイナミック・ウェーブ・トレンドとフィボナッチ統合量的な取引戦略
- トレーディング戦略をフォローする波動性停止ベースのEMAトレンド
- ダイナミック・ボラティリティ・フィルターによるマルチ-EMAトレンドフォロー戦略
- 多指標量的な取引戦略をフォローする三重EMA傾向
- 年末トレンド モメンタム・トレード・ストラテジーの後 ((60日間のMAブレイク)
- RSI 過剰購入/過剰売却量的な取引戦略の多指標トレンド
- 過去のバックテストを伴う多時間枠のフェア・バリュー・ギャップ・ブレイクアウト戦略
- QQEの動的傾向 リスク管理量的な取引戦略
- 移動平均値とバー外パターンに基づく二重トレンド確認取引戦略
- スーパートレンドの三重強化戦略に続くダイナミックな傾向
- RSI ダイナミック・ブレイクアウト・リトレースメント・トレーディング・ストラテジー
- オプティマイズされた二重T3トレンド追跡戦略
- 多条件ドンチアンチャネルモメンタムブレイク戦略
- 多期技術指標 ダイナミック取引システム戦略
- 動的サポート抵抗とボリンガー帯 多指標クロス戦略
- 多次元 イチモク・クラウド 価格突破 トレンド確認 トレーディング戦略