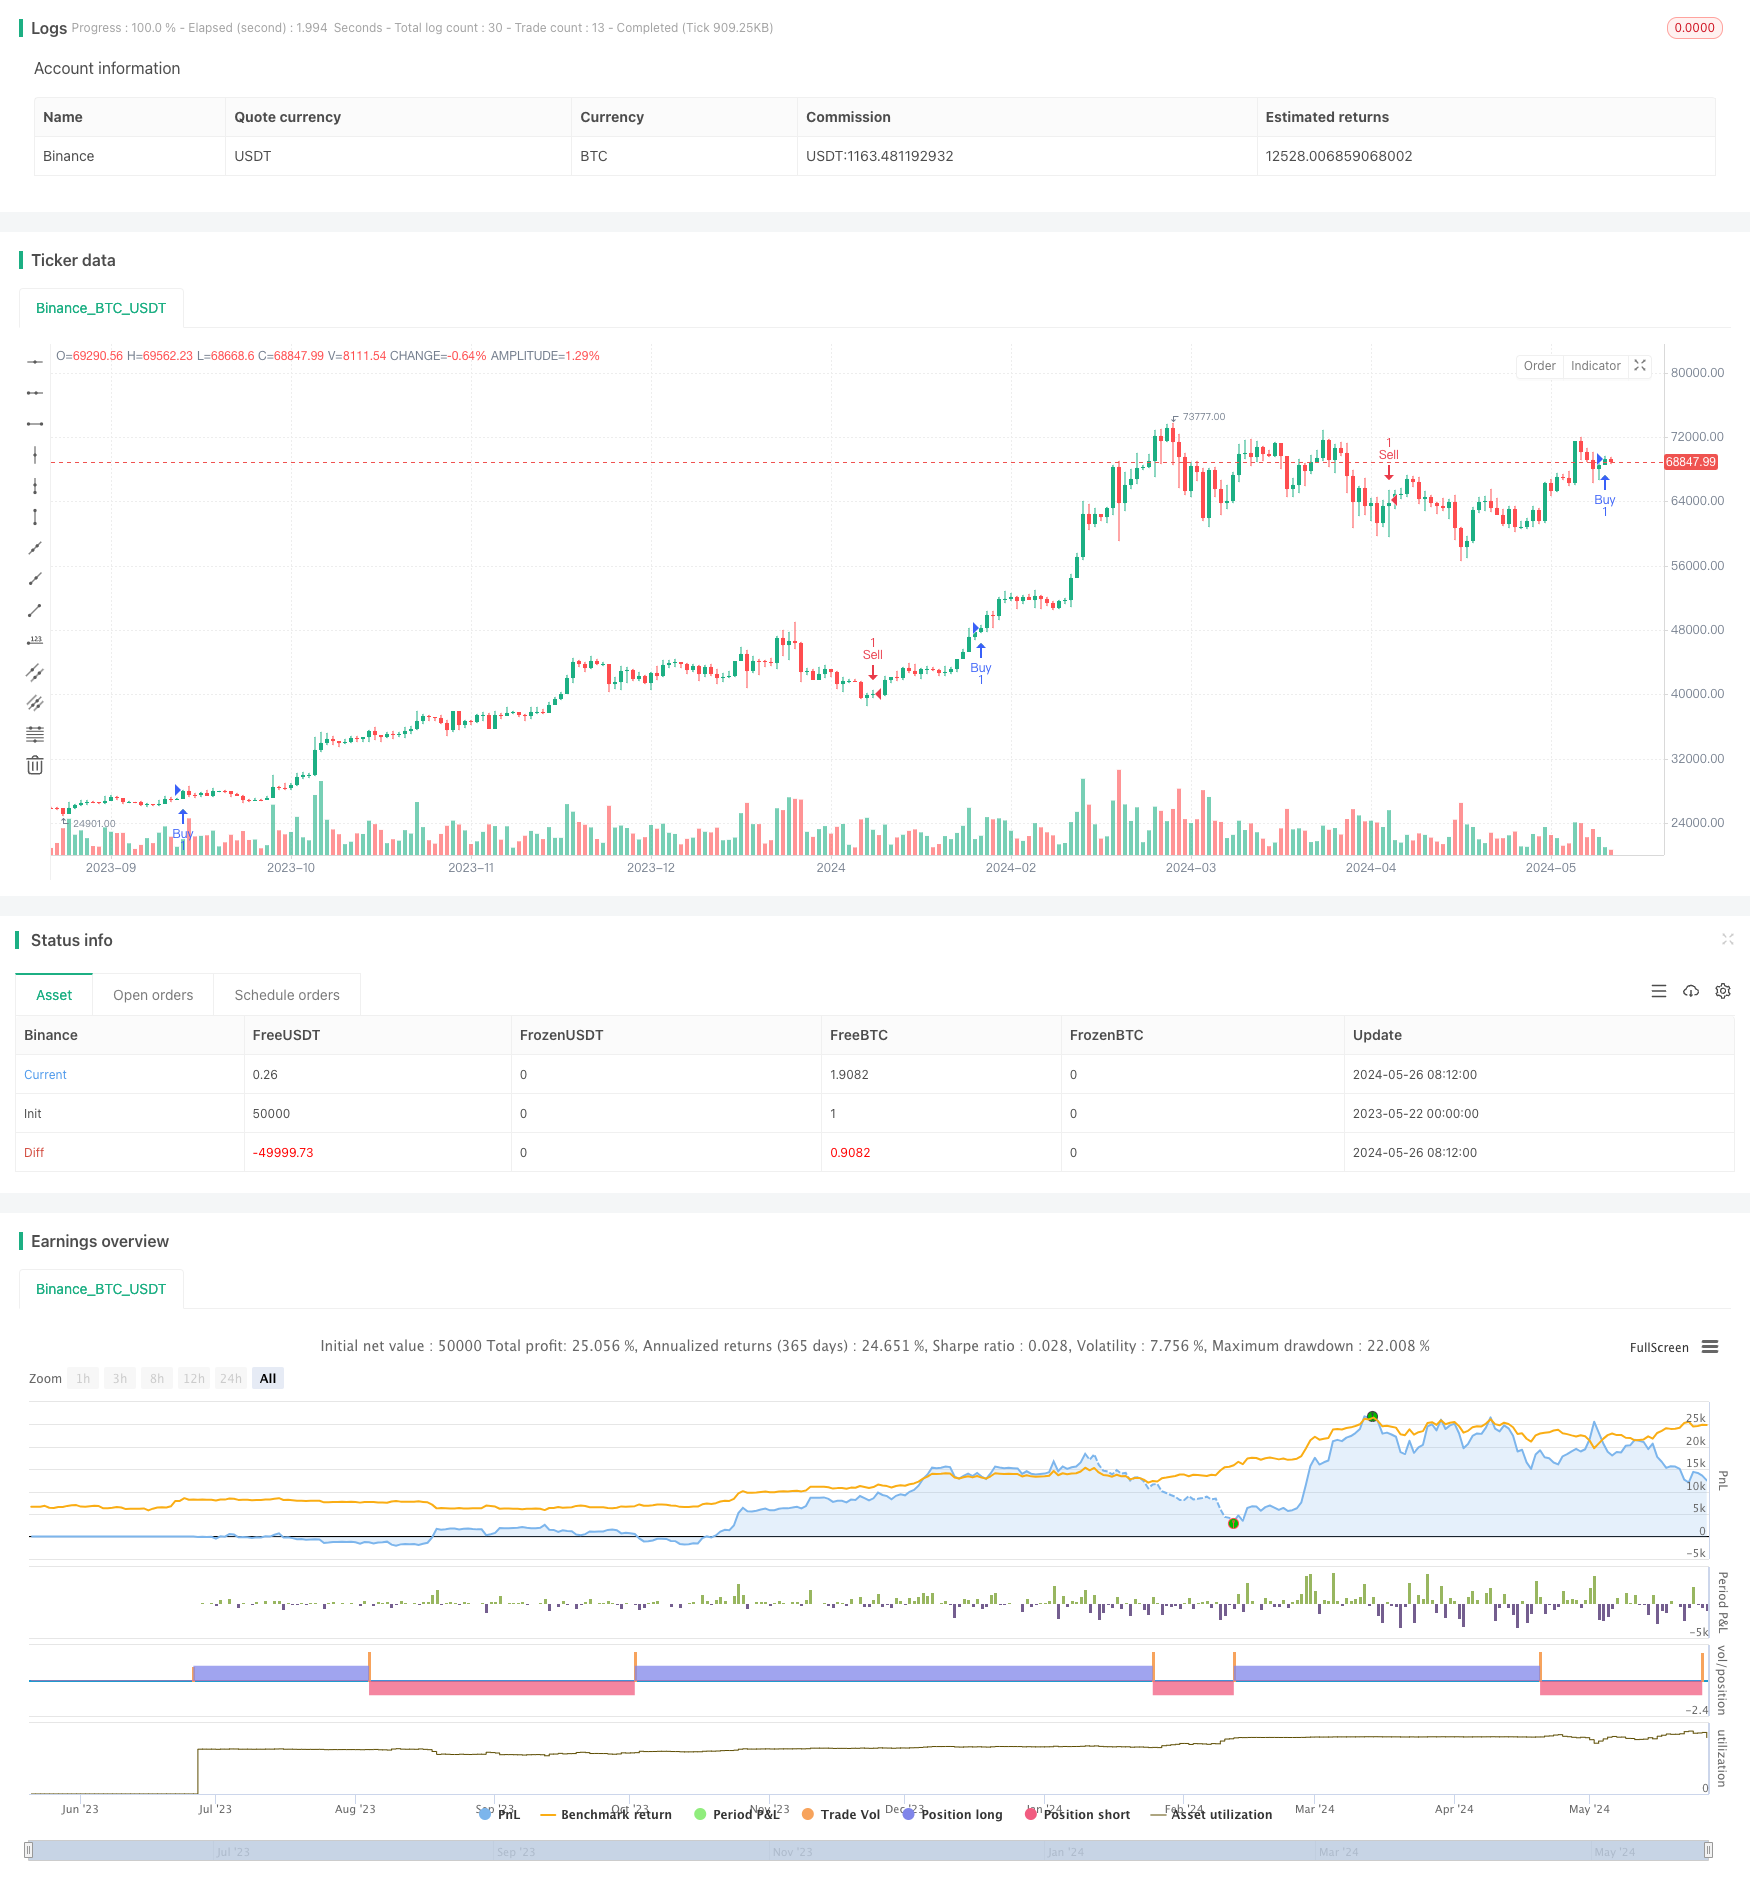
MA,SMA 이중 이동 평균 크로스오버 전략
저자:차오장, 날짜: 2024-05-28 10:53:02태그:MASMA

전반적인 설명
이 전략은 거래 신호를 생성하기 위해 서로 다른 기간을 가진 두 개의 이동 평균 (MA) 을 사용합니다. 단기 MA가 아래에서 장기 MA보다 높을 때 구매 신호를 생성합니다. 단기 MA가 위에서 장기 MA보다 낮을 때 판매 신호를 생성합니다. 이 전략의 주된 아이디어는 MA의 트렌드 추적 특성을 활용하고 거래 목적으로 MA 크로스오버를 통해 트렌드 변화를 포착하는 것입니다.
전략 원칙
- 서로 다른 기간을 가진 두 개의 이동 평균 (MA) 을 계산합니다: 단기 MA와 장기 MA.
- 단기 MA가 아래에서 장기 MA를 넘으면 잠재적인 상승 추세 형성을 나타내고 구매 신호를 생성합니다.
- 단기 MA가 상위로부터의 장기 MA 아래로 넘어가면 잠재적인 하향 트렌드 형성을 나타내고 판매 신호를 생성합니다.
- 구매 및 판매 신호에 기반한 거래: 구매 신호가 나타나면 긴 포지션을 열고 판매 신호가 나타나면 짧은 포지션을 열고
전략적 장점
- 단순함: 전략 논리는 명확하고 이해하기 쉽고 실행 가능합니다.
- 트렌드 추적: MA 크로스오버를 통해 트렌드 변화를 포착함으로써 전략은 다른 시장 트렌드에 잘 적응 할 수 있습니다.
- 매개 변수 유연성: 전략 성과를 최적화하기 위해 단기 및 장기 MAs의 기간 매개 변수를 다른 시장과 시간 프레임에 따라 조정할 수 있습니다.
전략 위험
- 불안한 시장: 불안한 시장에서 빈번한 MA 크로스오버는 많은 잘못된 신호로 이어질 수 있으며 이로 인해 더 많은 거래가 손실 될 수 있습니다.
- 트렌드 레이그: MAs는 지체 지표이기 때문에 트렌드 변화의 시작에서 전략은 약간의 이익을 놓칠 수 있습니다.
- 매개 변수 최적화: 다른 매개 변수 설정은 전략 성능에 크게 영향을 줄 수 있으며 매개 변수 최적화는 많은 양의 역사적 데이터와 컴퓨팅 자원을 필요로합니다.
전략 최적화 방향
- 트렌드 필터를 추가합니다. MA 크로스오버가 신호를 생성 한 후, 다른 트렌드 지표 (MACD, DMI 등) 는 일부 잘못된 신호를 필터링하기 위해 2차 확인을 위해 사용될 수 있습니다.
- 수익을 취하고 손실을 중지하는 최적화: 합리적으로 수익을 취하고 손실을 중지하는 수준을 설정하면 손실을 최소화하고 트렌드 지연의 경우 수익을 실행 할 수 있습니다.
- 동적 매개 변수 최적화: 현재 시장 특성에 적응하기 위해 다른 시장 조건에 따라 MA 기간 매개 변수를 동적으로 조정합니다.
- 다른 신호와 결합: 더 신뢰할 수 있는 거래 신호를 형성하기 위해 MA 크로스오버 신호를 다른 기술적 지표 (예를 들어 RSI, 볼링거 밴드 등) 와 결합합니다.
요약
이중 이동 평균 크로스오버 전략은 서로 다른 기간의 두 MAs의 크로스오버를 통해 트렌드 변화를 포착하는 간단하고 사용하기 쉬운 트렌드 추적 전략이다. 전략의 장점은 명확한 논리, 명시적인 신호 및 트렌딩 시장에 적합한 것입니다. 그러나 불안정한 시장에서 전략은 더 많은 잘못된 신호를 생성하고 거래를 잃을 수 있습니다. 따라서 실용적인 응용에서는 트렌드 필터를 추가하고 수익을 취하고 손실을 중지하는 최적화, 매개 변수를 동적으로 최적화하고 다른 신호와 결합하여 적응력과 안정성을 향상시킬 수 있습니다.
/*backtest
start: 2023-05-22 00:00:00
end: 2024-05-27 00:00:00
period: 1d
basePeriod: 1h
exchanges: [{"eid":"Binance","currency":"BTC_USDT"}]
*/

//@version=5
strategy("Combined Strategy", overlay=true)

// Moving Averages Length Inputs
short_length = input.int(20, "Short MA Length")
long_length = input.int(50, "Long MA Length")

// Moving Averages
ma_short = ta.sma(close, short_length)
ma_long = ta.sma(close, long_length)

// Buy Condition (Moving Average Crossover)
buy_condition = ta.crossover(ma_short, ma_long)
plotshape(series=buy_condition, style=shape.triangleup, location=location.belowbar, color=color.green, size=size.small)

// Sell Condition (Moving Average Crossover)
sell_condition = ta.crossunder(ma_short, ma_long)
plotshape(series=sell_condition, style=shape.triangledown, location=location.abovebar, color=color.red, size=size.small)

// Strategy Entry and Exit
if (buy_condition)
    strategy.entry("Buy", strategy.long)

if (sell_condition)
    strategy.entry("Sell", strategy.short)

// Debug statements
if (buy_condition)
    label.new(x=bar_index, y=low, text="Buy Signal", color=color.green, style=label.style_label_up)

if (sell_condition)
    label.new(x=bar_index, y=high, text="Sell Signal", color=color.red, style=label.style_label_down)
관련
- MA, SMA, MA 슬로프, 트래일링 스톱 손실, 재입구
- 동적 위치 이중 이동 평균 크로스오버 전략
- 이동 평균 크로스오버 전략
- 거래 전략에 따른 다중 이동 평균 트렌드
- 트렌드 포착 전략
- 다중 이동 평균 트렌드 거래 전략
- 이중 이동 평균 추진력 거래 전략: 시간 최적화 트렌드 추적 시스템
- 다중 이동 평균 및 스토카스틱 오시레이터 크로스오버 양적 전략
- 다중 취득 전략의 이동 평균 크로스오버
- 스토카스틱 오시레이터 및 스토카스틱 필터와 함께 이동 평균 크로스오버 전략
- 이중 이동 평균 크로스오버 전략
더 많은
- 피보나치 골든 하모니 브레이크아웃 전략
- 선형 회귀 기울기 (linear regression slope) 를 기반으로 한 동적 시장 체제 식별 전략
- 트렌드 역전 거래 전략
- EMA와 트렌드 라인 브레이크에 기초한 이중 이동 평균 RSI 모멘텀 전략
- 다이내믹 포지션 관리 일일 거래 전략
- BTC 기술 거래 전략 15분 차트
- 동적 포지션 사이징 단기 외환 거래 전략
- 고급 15 분 차트 거래 신호 전략
- PSAR 및 EMA 기반의 양적 거래 전략
- 표준편차 DEV 거래 전략 상대적 강도 지표 RSI 및 간단한 이동 평균 SMA를 기반으로
- 리스크/어워드 비율과 기술 분석에 기반한 황소 깃발 파업 전략
- 다중 요인 융합 전략
- 볼링거 밴드 + RSI + 멀티 MA 트렌드 전략
- QQE와 RSI를 기반으로 한 장기 단기 신호 전략
- 제로 라그 MACD 듀얼 크로스오버 거래 전략 - 단기 트렌드 캡처에 기반한 고주파 거래
- 평균 실제 범위 후속 정지 전략을 따르는 경향
- P&L 예측과 함께 SMC & EMA 전략
- 나다라야-워튼 앙벨로프 다중 확인 동적 스톱 로스 전략
- 동적 취득 볼링거 밴드 전략
- CCI + MA 크로스오버 풀백 구매 전략