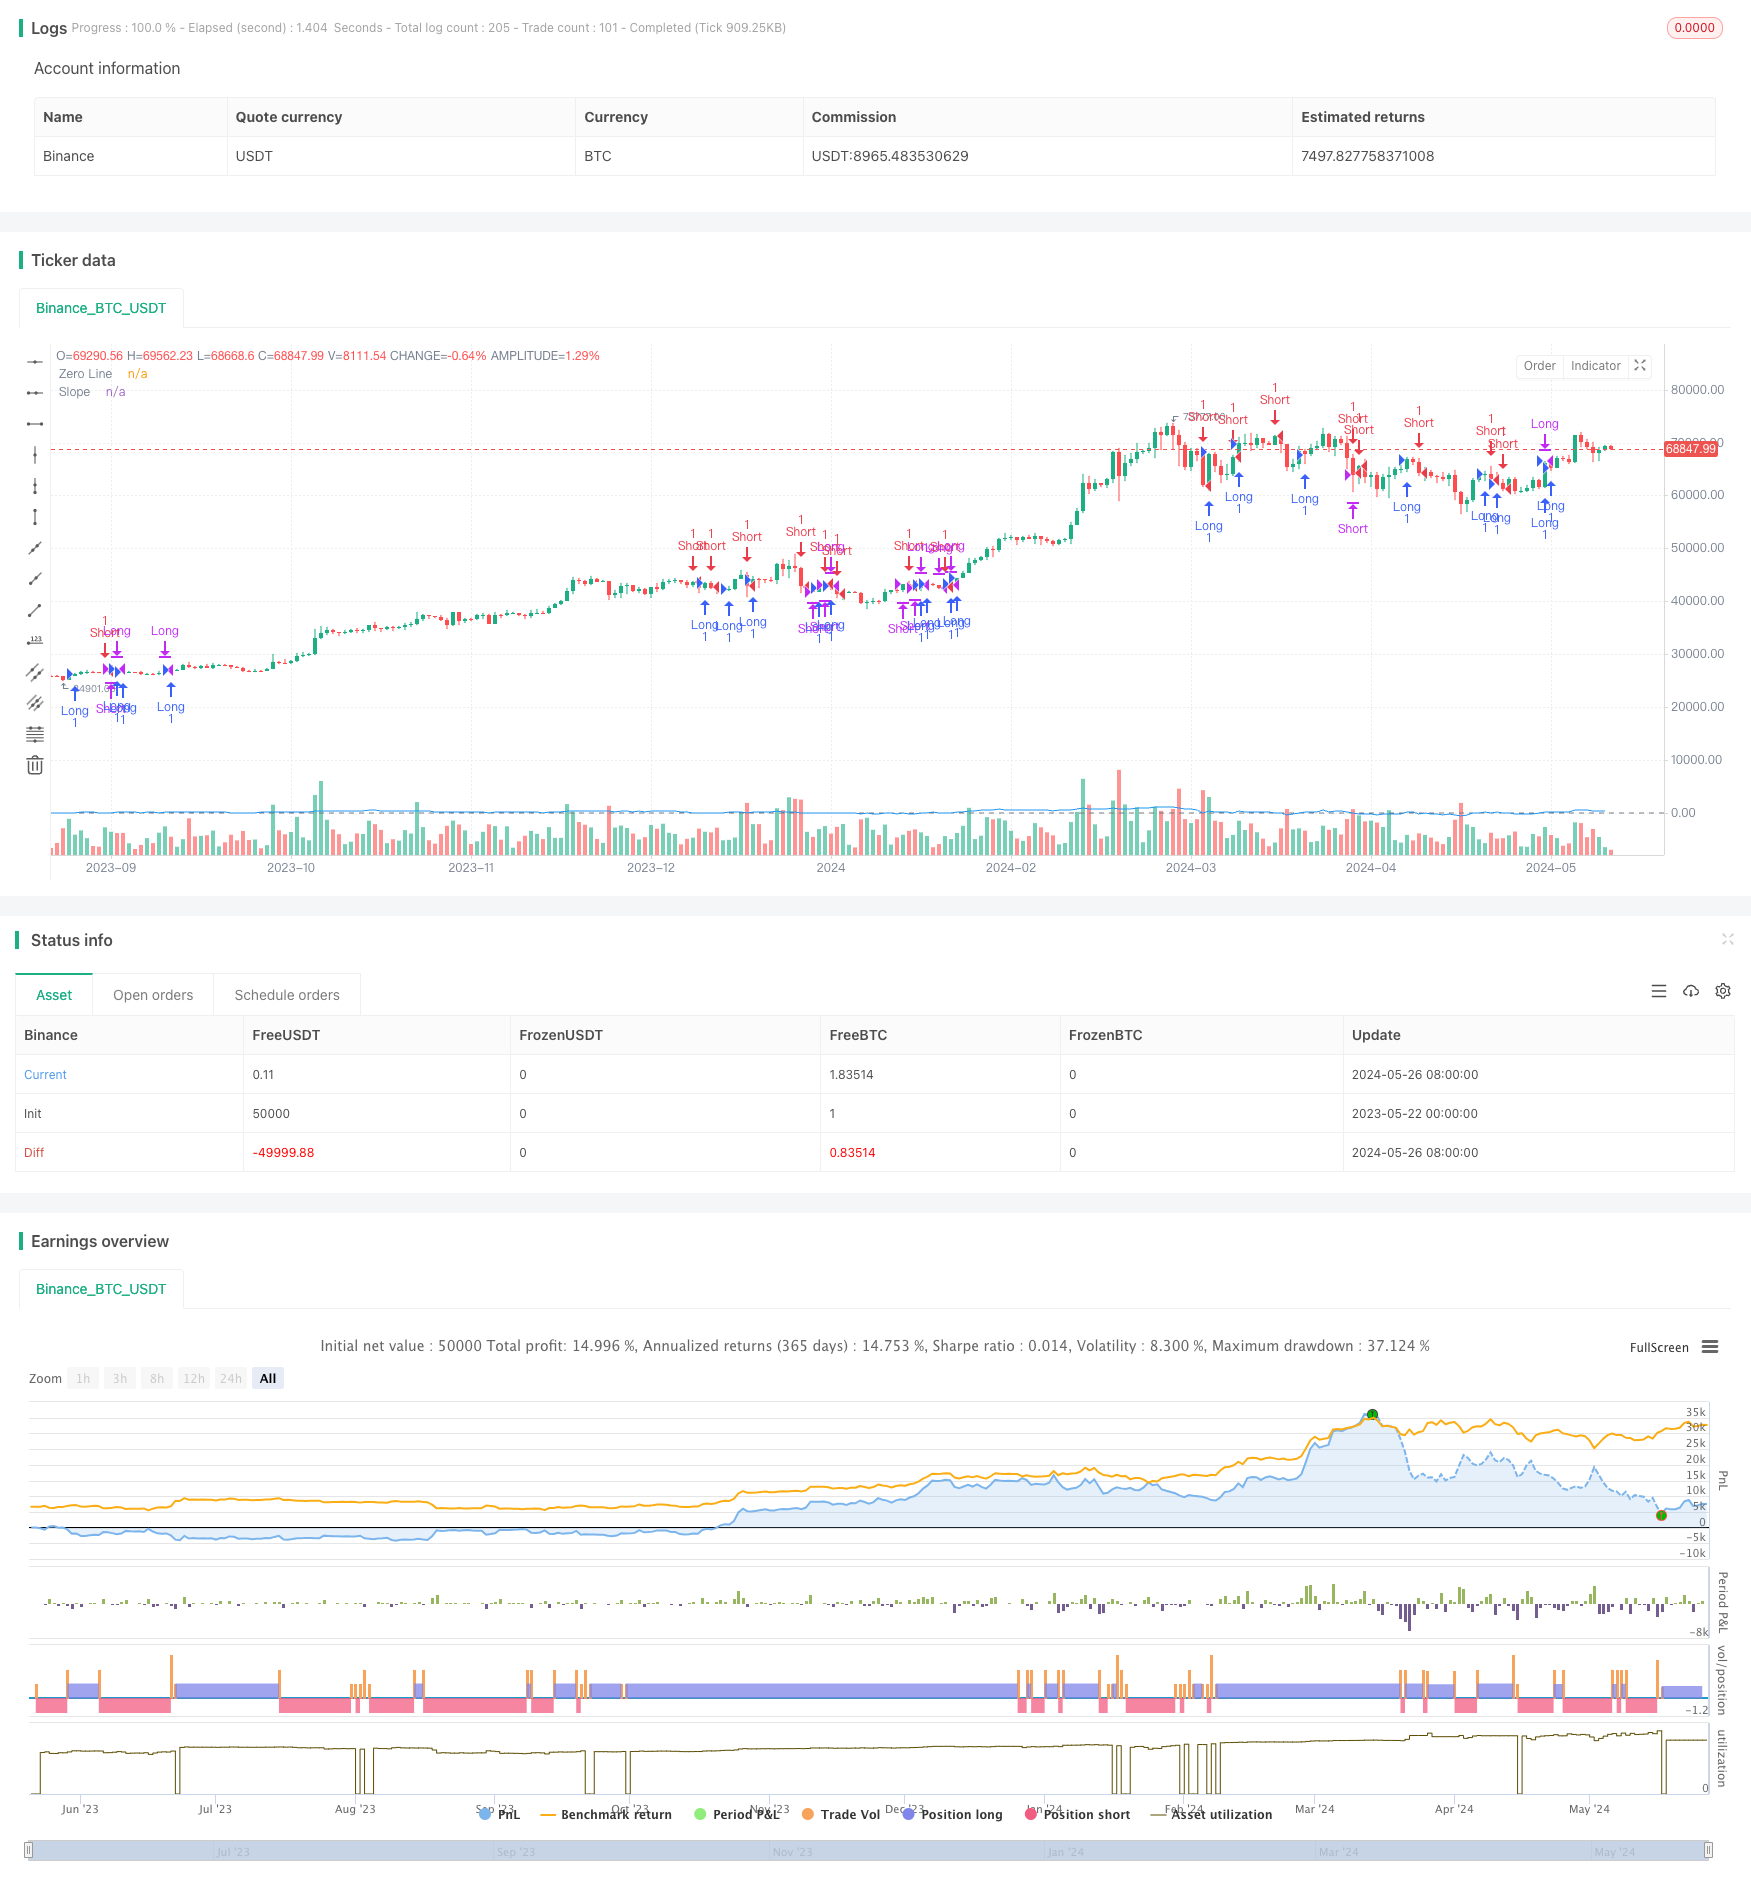
개요
이 전략은 선형 회귀의 기울기를 사용하여 시장의 다른 상태를 식별합니다. (승승 또는 하락). 수시 가격의 수시 회귀의 기울기를 계산하여 시장 추세의 방향과 강도를 측정 할 수 있습니다. 경사가 특정 하락보다 크면 시장은 낙관적이라고 간주되며 전략은 다단계 위치에 들어갑니다. 경사가 부정적인 하락보다 작으면 시장은 하락으로 간주되며 전략은 공백 위치에 들어갑니다.
전략 원칙
이 전략의 핵심 원칙은 시장 상태를 식별하기 위해 선형 회귀의 기울기를 사용하는 것입니다. 종전 가격에 대한 선형 회귀를 수행함으로써 최적의 조화 직선을 얻을 수 있습니다. 이 직선의 기울기는 해당 기간 동안의 가격의 전반적인 경향의 방향과 강도를 반영합니다.
전략적 이점
- 객관성: 이 전략은 수학적으로 계산된 기울기 값을 기반으로 시장 상태를 판단하여 주관적 판단의 영향을 피하고 의사결정의 객관성을 높인다.
- 적응성: 동적으로 기울기 절댓값을 조정하여, 이 전략은 다양한 시장 상황과 품종 특성에 적응할 수 있으며, 좋은 적응성을 갖는다.
- 트렌드 캡처: 이 전략은 시장의 주요 트렌드를 효과적으로 캡처하고, 트렌드가 명확할 때 더 나은 수익을 얻습니다.
- 간단하고 사용하기 쉬운: 전략 논리가 명확하고 계산이 간단하며 이해하기 쉽고 구현하기 쉽습니다.
전략적 위험
- 격동시장: 격동시장에서 가격이 자주 변동하고, 추세가 명확하지 않기 때문에, 이 전략은 높은 거래 비용과 잠재적인 손실로 이어지는 빈번한 거래 신호가 발생할 수 있습니다.
- 변수 민감성: 이 전략의 성능은 기울기 길이, SMA 길이 및 기울기 절벽과 같은 변수의 선택에 의존합니다. 다른 변수는 다른 결과를 초래할 수 있으므로 신중한 최적화가 필요합니다.
- 트렌드 회전: 트렌드 회전 지점 근처에서, 이 전략은 잘못된 신호가 발생할 수 있으며, 잠재적인 손실을 초래할 수 있다.
- 지연성: 이 전략은 일정 기간에 걸친 데이터에 기반하여 계산된 기울기가 있기 때문에, 약간의 지연성이 존재하며, 최고의 입시 시기를 놓칠 수 있다.
전략 최적화 방향
- 변수 최적화: 경사 길이, SMA 길이 및 경사 하락과 같은 변수를 최적화하여 다양한 시장 상황과 품종 특성에 맞게 전략의 안정성과 수익성을 향상시킵니다.
- 트렌드 필터: MACD, ADX 등과 같은 다른 트렌드 지표를 도입하여 트렌드를 2차 확인하고, 흔들리는 시장의 가짜 신호를 필터링한다.
- 손해 차단: 합리적인 손해 차단 및 중지 위치를 설정하고, 단일 거래의 위험과 수익을 제어하고, 전략의 위험 수익률을 향상시킵니다.
- 다중 시간 프레임 분석: 다른 시간 프레임의 기울기 신호, 예를 들어 일선과 4 시간 선과 결합하여 트렌드를 더 포괄적으로 판단하고 의사 결정의 정확성을 향상시킵니다.
요약하다
선형 회귀 기울기를 기반으로 한 동적 시장 상태 인식 전략은 가격의 선형 회귀 기울기를 계산하여 시장 상태를 판단하고 그에 따른 거래 결정을 내립니다. 이 전략의 논리는 명확하고 계산이 간단하며 시장의 주요 추세를 효과적으로 포착 할 수 있습니다. 그러나 불안한 시장에서 거래가 자주 발생할 수 있으며 파라미터 선택에 민감합니다. 파라미터 최적화, 트렌드 필터링, 스톱 손실 스톱 및 다중 시간 프레임 분석과 같은 방법을 통해 전략의 안정성과 수익성을 더욱 향상시킬 수 있습니다.
전략 소스 코드
/*backtest
start: 2023-05-22 00:00:00
end: 2024-05-27 00:00:00
period: 1d
basePeriod: 1h
exchanges: [{"eid":"Binance","currency":"BTC_USDT"}]
*/

// This Pine Script™ code is subject to the terms of the Mozilla Public License 2.0 at https://mozilla.org/MPL/2.0/
// © tmalvao
//@version=5
strategy("Minha estratégia", overlay=true, margin_long=100, margin_short=100)

// Função para calcular o slope (inclinação) com base na média móvel simples (SMA)
slope_length = input(20, title="Slope Length")
sma_length = input(50, title="SMA Length")
slope_threshold = input.float(0.1, title="Slope Threshold")

sma = ta.sma(close, sma_length)

// Calculando o slope (inclinação)
var float slope = na
if (not na(close[slope_length - 1]))
    slope := (close - close[slope_length]) / slope_length

// Identificação dos regimes de mercado com base no slope
bullish_market = slope > slope_threshold
bearish_market = slope < -slope_threshold

// Condições de entrada e saída para mercados bullish e bearish
if (bullish_market)
    strategy.entry("Long", strategy.long)

if (bearish_market)
    strategy.entry("Short", strategy.short)

// Saída das posições
exit_condition = ta.crossover(close, sma) or ta.crossunder(close, sma)
if (exit_condition)
    strategy.close("Long")
    strategy.close("Short")

// Exibir a inclinação em uma janela separada
slope_plot = plot(slope, title="Slope", color=color.blue)
hline(0, "Zero Line", color=color.gray)