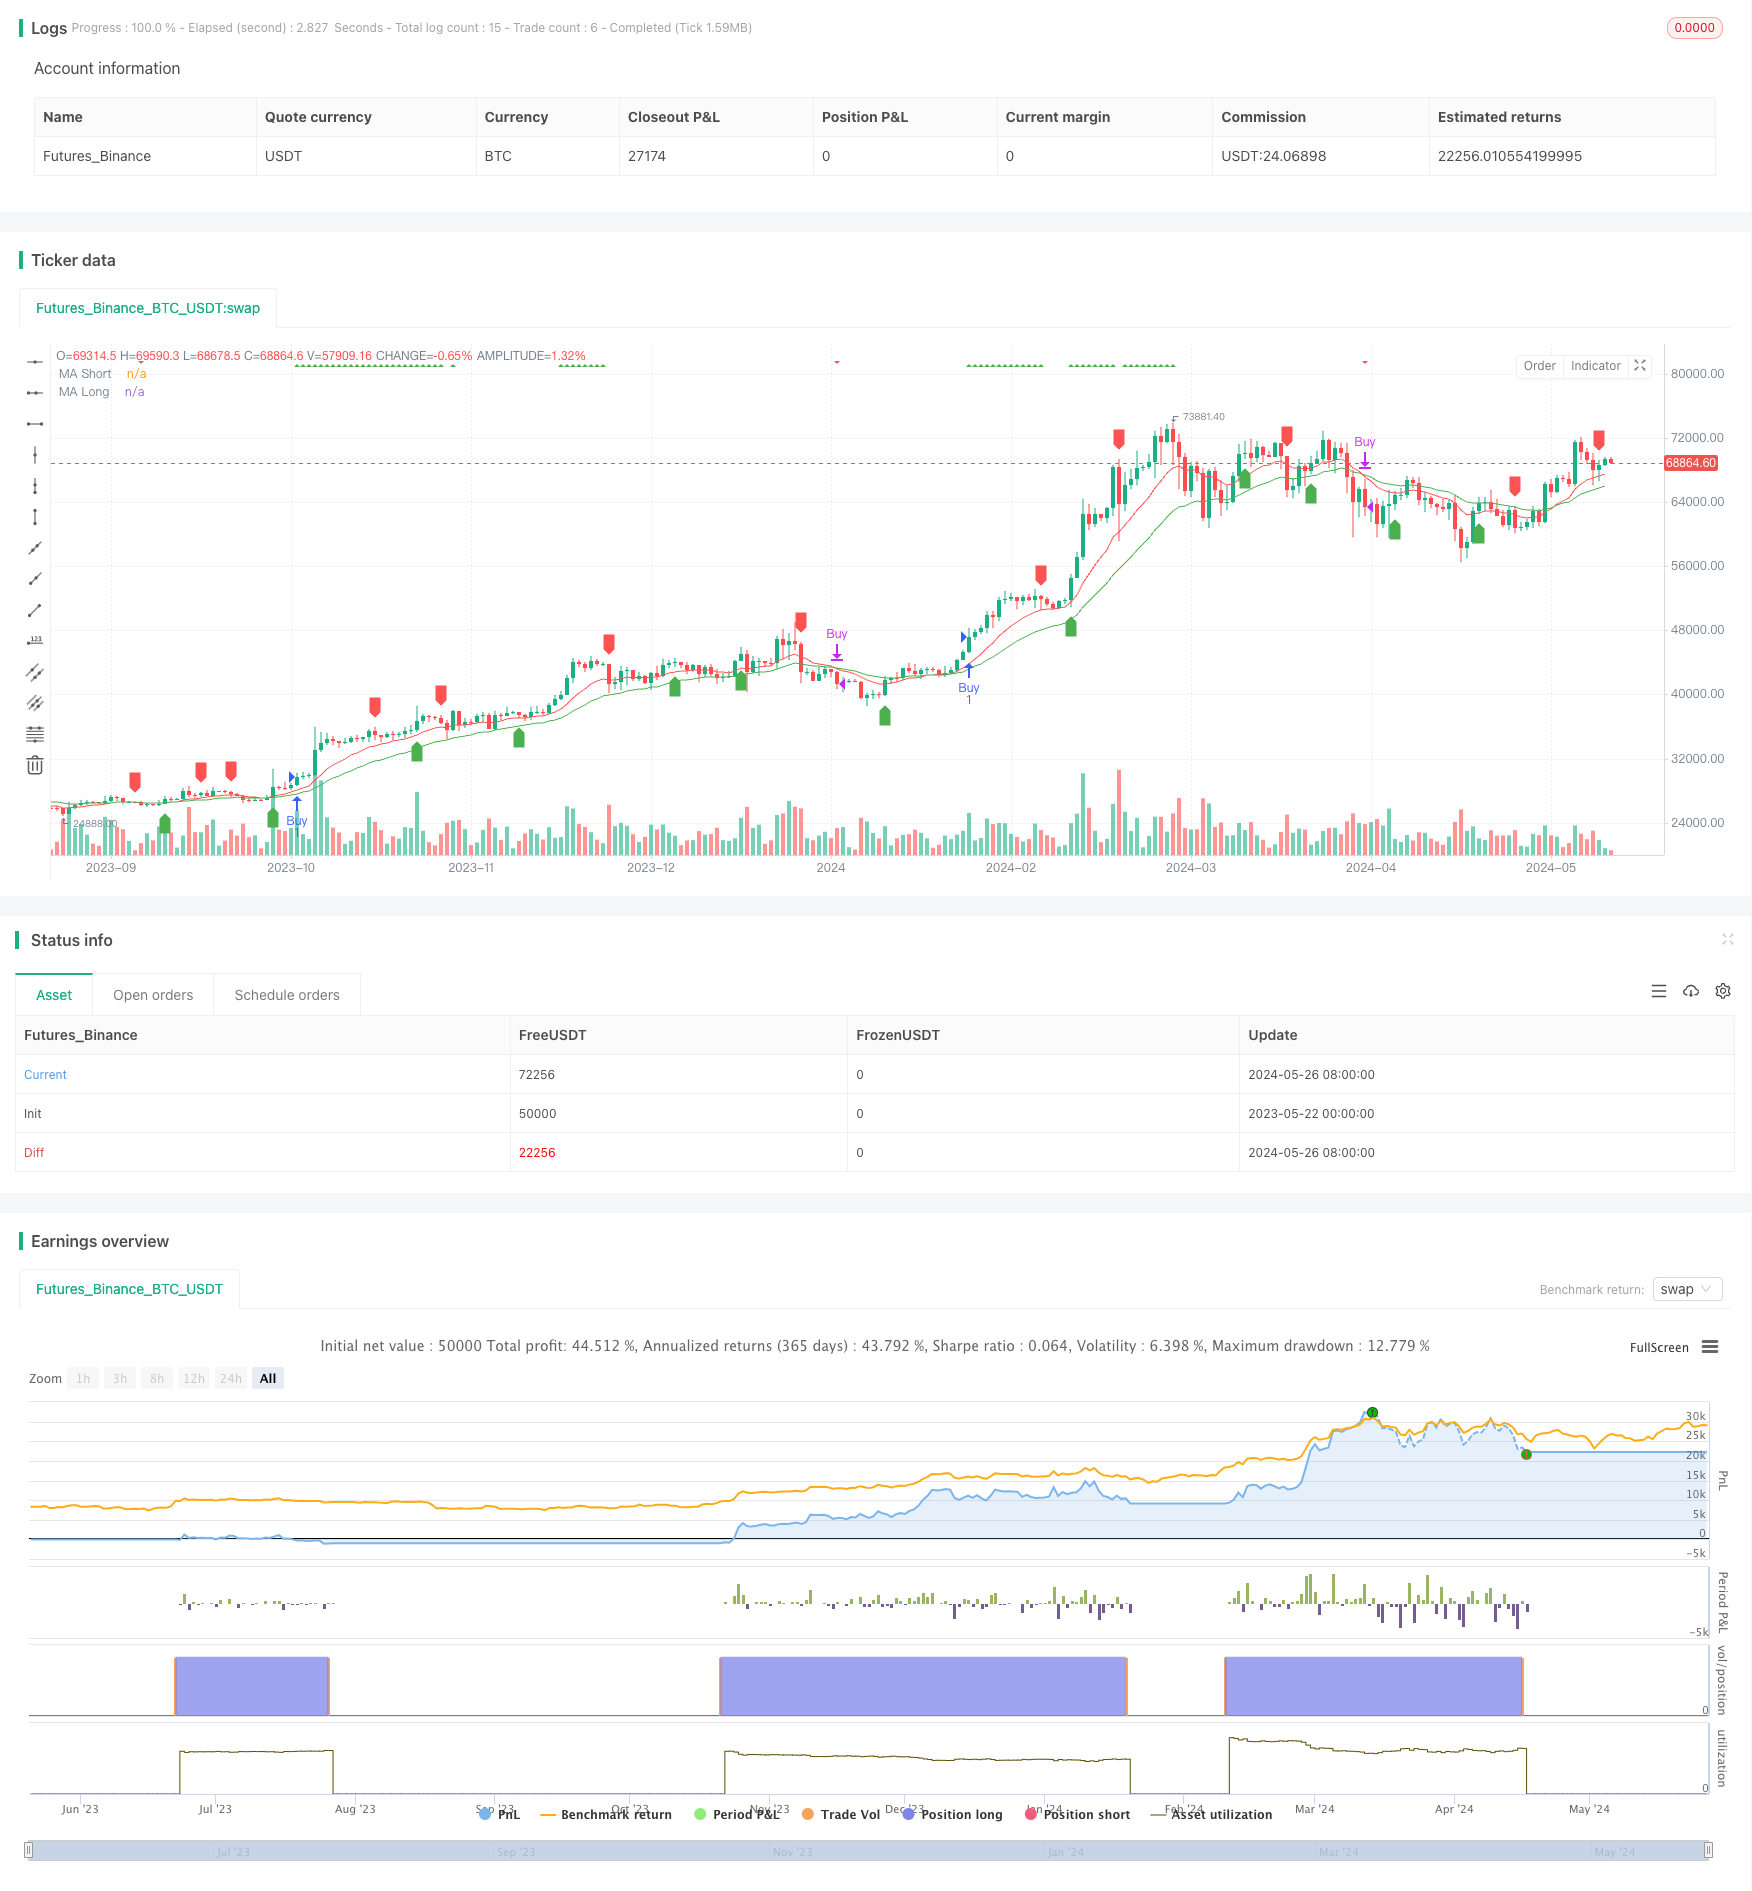
RSI와 MA 조합 전략
저자:차오장, 날짜: 2024-05-28 17:34:11태그:RSIMAEMASMAHMAWMASTOCHRSI

전반적인 설명
이 전략은 RSI 지표와 이동 평균 (MA) 을 결합하여 거래 신호를 생성합니다. RSI는 시장이 과소매 또는 과소매인지 결정하는 데 사용되며, MA는 가격 추세를 결정하는 데 사용됩니다. RSI가 과소매되고 가격이 MA보다 높을 때 구매 신호가 생성됩니다. RSI가 과소매되거나 MA가 죽음의 십자가를 생성 할 때 판매 신호가 생성됩니다. 또한 전략은 보조 판단으로 스토카스틱 RSI 지표 (StochRSI) 를 도입하고 StochRSI가 신호를 생성 할 때 표시가 표시됩니다.
전략 원칙
- RSI 지표 값을 계산하여 시장이 과소수 (> 70) 또는 과소수 (< 30) 를 결정합니다.
- EMA, SMA, HMA, WMA라는 네 가지 유형을 포함하는 사용자 지정 기간의 MA를 계산하고 매개 변수 설정을 기반으로 차트에 표시할지 여부를 결정합니다.
- RSI가 과잉 매입되고 마감 가격이 MA보다 높을 때 구매 신호가 생성됩니다. RSI가 과잉 판매되거나 MA가 죽음의 십자가를 생성하면 판매 신호가 생성됩니다.
- 보조 판단으로 StochRSI 지표를 소개합니다. StochRSI가 과잉 구매 (> 70) 또는 과잉 판매 (< 30) 될 때 차트에는 표시가 표시되지만 실제 거래 신호는 생성되지 않습니다.
전략적 장점
- 두 가지 고전적인 지표인 RSI와 MA의 유기적인 조합은 트렌드 움직임과 과소 구매/ 과소 판매 기회를 더 잘 파악할 수 있습니다.
- 허가 유형과 매개 변수는 매우 유연하게 자유롭게 설정할 수 있으며 다른 시장 특성에 따라 조정할 수 있습니다.
- 보조 판단으로 StochRSI 지표를 도입하면 거래 결정에 더 많은 참조가 제공됩니다.
- 코드 로직은 명확하고 읽기 쉽고 이해하기 쉽고 2차 개발입니다.
전략 위험
- RSI와 MA 모두 지체 지표이며 트렌드 반전 초기 단계에서 더 잘못된 신호를 생성 할 수 있습니다.
- 부적절한 매개 변수 설정은 신호가 너무 일찍 또는 너무 늦게 생성되어 전체 수익에 영향을 줄 수 있습니다.
- 스톱 로스 및 포지션 관리의 부족은 시장이 급격하게 변동할 때 더 큰 위험을 초래할 수 있습니다.
전략 최적화 방향
- 유동성 같은 더 많은 주요 지표를 도입하여 트렌드 변화를 미리 예측하십시오.
- 구매 및 판매 신호를 필터링합니다. 예를 들어 신호 정확성을 향상시키기 위해 RSI와 MA가 신호를 생성하는 동시에 특정 조건을 충족하도록 요구합니다.
- 단일 거래 위험과 전체 위험을 제어하기 위해 전략에 스톱 로스 및 포지션 관리 모듈을 추가합니다.
- 가장 좋은 매개 변수 조합을 찾기 위해 전략에 매개 변수 최적화를 수행합니다.
- 서로 다른 사이클 또는 여러 종류를 추가하여 서로 다른 종류 또는 사이클 사이의 연결 관계를 완전히 활용하는 것을 고려하십시오.
요약
이 전략은 RSI와 MA의 두 가지 고전적 지표를 결합함으로써 트렌드 움직임과 과소 구매/ 과소 판매 기회를 파악할 수 있다. 동시에, StochRSI 지표를 보조 판단으로 도입하고, 전체적인 아이디어는 간단하고 명확하다. 그러나, 전략은 또한 위험 통제 조치가 부족하고 신호 정확성을 개선해야 하는 것과 같은 몇 가지 단점도 있다. 앞으로 더 많은 지표를 도입하고, 신호 규칙을 최적화하고, 위험 제어 모듈을 추가하여 더 강력한 수익을 얻기 위해 전략을 개선할 수 있다.
/*backtest
start: 2023-05-22 00:00:00
end: 2024-05-27 00:00:00
period: 1d
basePeriod: 1h
exchanges: [{"eid":"Futures_Binance","currency":"BTC_USDT"}]
*/

//@version=5
strategy("RSI Strategy with Customizable MA and StochRSI Alert", overlay=true)

// กำหนดค่า RSI สำหรับการเปิดสัญญาณซื้อและขาย
rsiOverbought = input(70, title="RSI Overbought Level")
rsiOversold = input(30, title="RSI Oversold Level")

// เลือกชนิดของเส้นค่าเฉลี่ยเคลื่อนที่
maType = input.string("EMA", title="MA Type", options=["EMA", "SMA", "HMA", "WMA"])

// กำหนดค่าเส้นค่าเฉลี่ยเคลื่อนที่
maShortLength = input(12, title="MA Short Length")
maLongLength = input(26, title="MA Long Length")

// เลือกการแสดงผลของเส้นค่าเฉลี่ยเคลื่อนที่
showShortMA = input(true, title="Show Short Moving Average")
showLongMA = input(true, title="Show Long Moving Average")

// ฟังก์ชันสำหรับเลือกชนิดของเส้นค่าเฉลี่ยเคลื่อนที่
f_ma(src, length, type) =>
    switch type
        "SMA" => ta.sma(src, length)
        "EMA" => ta.ema(src, length)
        "HMA" => ta.hma(src, length)
        "WMA" => ta.wma(src, length)

// คำนวณค่าเส้นค่าเฉลี่ยเคลื่อนที่
maShort = showShortMA ? f_ma(close, maShortLength, maType) : na
maLong = showLongMA ? f_ma(close, maLongLength, maType) : na

// คำนวณค่า RSI
rsiValue = ta.rsi(close, 14)

// สร้างสัญญาณซื้อและขาย
buySignal = (rsiValue > rsiOverbought and ((showShortMA and showLongMA and close > maShort and maShort > maLong) or (showShortMA and not showLongMA and close > maShort) or (showLongMA and not showShortMA and close > maLong)))
sellSignal = (showShortMA and showLongMA and ta.crossover(maLong, maShort)) or (showShortMA and not showLongMA and ta.crossover(maShort, close)) or (showLongMA and not showShortMA and ta.crossover(maLong, close))

// แสดงค่าเส้นค่าเฉลี่ยเคลื่อนที่บนกราฟ
plot(maShort, color=color.red, title="MA Short")
plot(maLong, color=color.green, title="MA Long")

// คำนวณค่า Stochastic RSI
smoothK = 3
smoothD = 3
RSIlen = 14
STOlen = 14
SRsrc = close
OSlevel = 30
OBlevel = 70

rsi1 = ta.rsi(SRsrc, RSIlen)
k = ta.sma(ta.stoch(rsi1, rsi1, rsi1, STOlen), smoothK)
d = ta.sma(k, smoothD)

stochRSIOverbought = OBlevel
stochRSIOversold = OSlevel

stochRSIBuyAlert = ta.crossover(k, stochRSIOversold)
stochRSISellAlert = ta.crossunder(k, stochRSIOverbought)

// สร้างคำสั่งซื้อและขายเมื่อมีสัญญาณจาก RSI และ MA เท่านั้น
if (buySignal)
    strategy.entry("Buy", strategy.long)
if (sellSignal)
    strategy.close("Buy")

// แสดงสัญญาณเตือนจาก Stochastic RSI บนกราฟ
plotshape(series=stochRSIBuyAlert, location=location.belowbar, color=color.green, style=shape.labelup, title="StochRSI Buy Alert")
plotshape(series=stochRSISellAlert, location=location.abovebar, color=color.red, style=shape.labeldown, title="StochRSI Sell Alert")

// แสดงสัญญาณซื้อและขายจาก RSI และ MA บนกราฟ
plotshape(series=buySignal, location=location.top, color=color.green, style=shape.triangleup, title="RSI>70")
plotshape(series=sellSignal, location=location.top, color=color.red, style=shape.triangledown, title="MA crossoverDown")
관련
- 고급 유연한 다기간 이동평균 크로스오버 전략
- 고급 양적 거래 전략 RSI 분산 및 이동 평균을 결합
- 이치모쿠 클라우드 브레이크오웃 및 스톱-러스 시스템과 함께 전략에 따른 다기술 지표 트렌드
- 이중 동적 지표 최적화 전략
- 레드K 모멘텀 바
- 적응형 다중 이동 평균 크로스오버 동적 거래 전략
- 거래 전략에 따른 다기술 지표 트렌드
- 동적 이중 이동 평균 크로스오버 양적 거래 전략
- 이동 평균 필터 (HBTS) 를 가진 역사적인 파격 트렌드 시스템
- 다중 시간 프레임 EMA 크로스 높은 수익률 트렌드 전략 (첨단)
더 많은
- 이치모쿠 쿠모 거래 전략
- 동적 ATR Stop Loss and Take Profit 이동 평균 크로스오버 전략
- EMA 트렌드 모멘텀 촛불 패턴 전략
- G 채널 트렌드 탐지 전략
- 트레일링 스톱 로스 전략과 이동 평균 크로스오버
- 동적 취득 및 스톱 로스 (Stop Loss) 를 가진 EMA 크로스오버 거래 전략
- 볼링거 밴드 및 EMA 트렌드 다음 전략
- 웨이브트렌드 오시레이터 디버전스 전략
- 변동성 및 선형 회귀에 기반한 장기 단기 시장 체제 최적화 전략
- 하이브리드 바이노미얼 Z-스코어 양적 전략
- EMA 모멘텀 거래 전략
- FVG 모멘텀 스칼핑 전략
- ATR 및 EMA 기반의 동적 취득 및 손실 중지 적응 전략
- 브레이크오웃 및 주파수 필터 (장만) 로 트렌드를 따라가기
- 피보나치 골든 하모니 브레이크아웃 전략
- 선형 회귀 기울기 (linear regression slope) 를 기반으로 한 동적 시장 체제 식별 전략
- 트렌드 역전 거래 전략
- EMA와 트렌드 라인 브레이크에 기초한 이중 이동 평균 RSI 모멘텀 전략
- 다이내믹 포지션 관리 일일 거래 전략
- BTC 기술 거래 전략 15분 차트