资源加载中... loading...

EMA Trend Momentum Candlestick Pattern Strategy

Author: ChaoZhang, Date: 2024-05-29 17:11:14
Tags: EMAAO

img

Overview

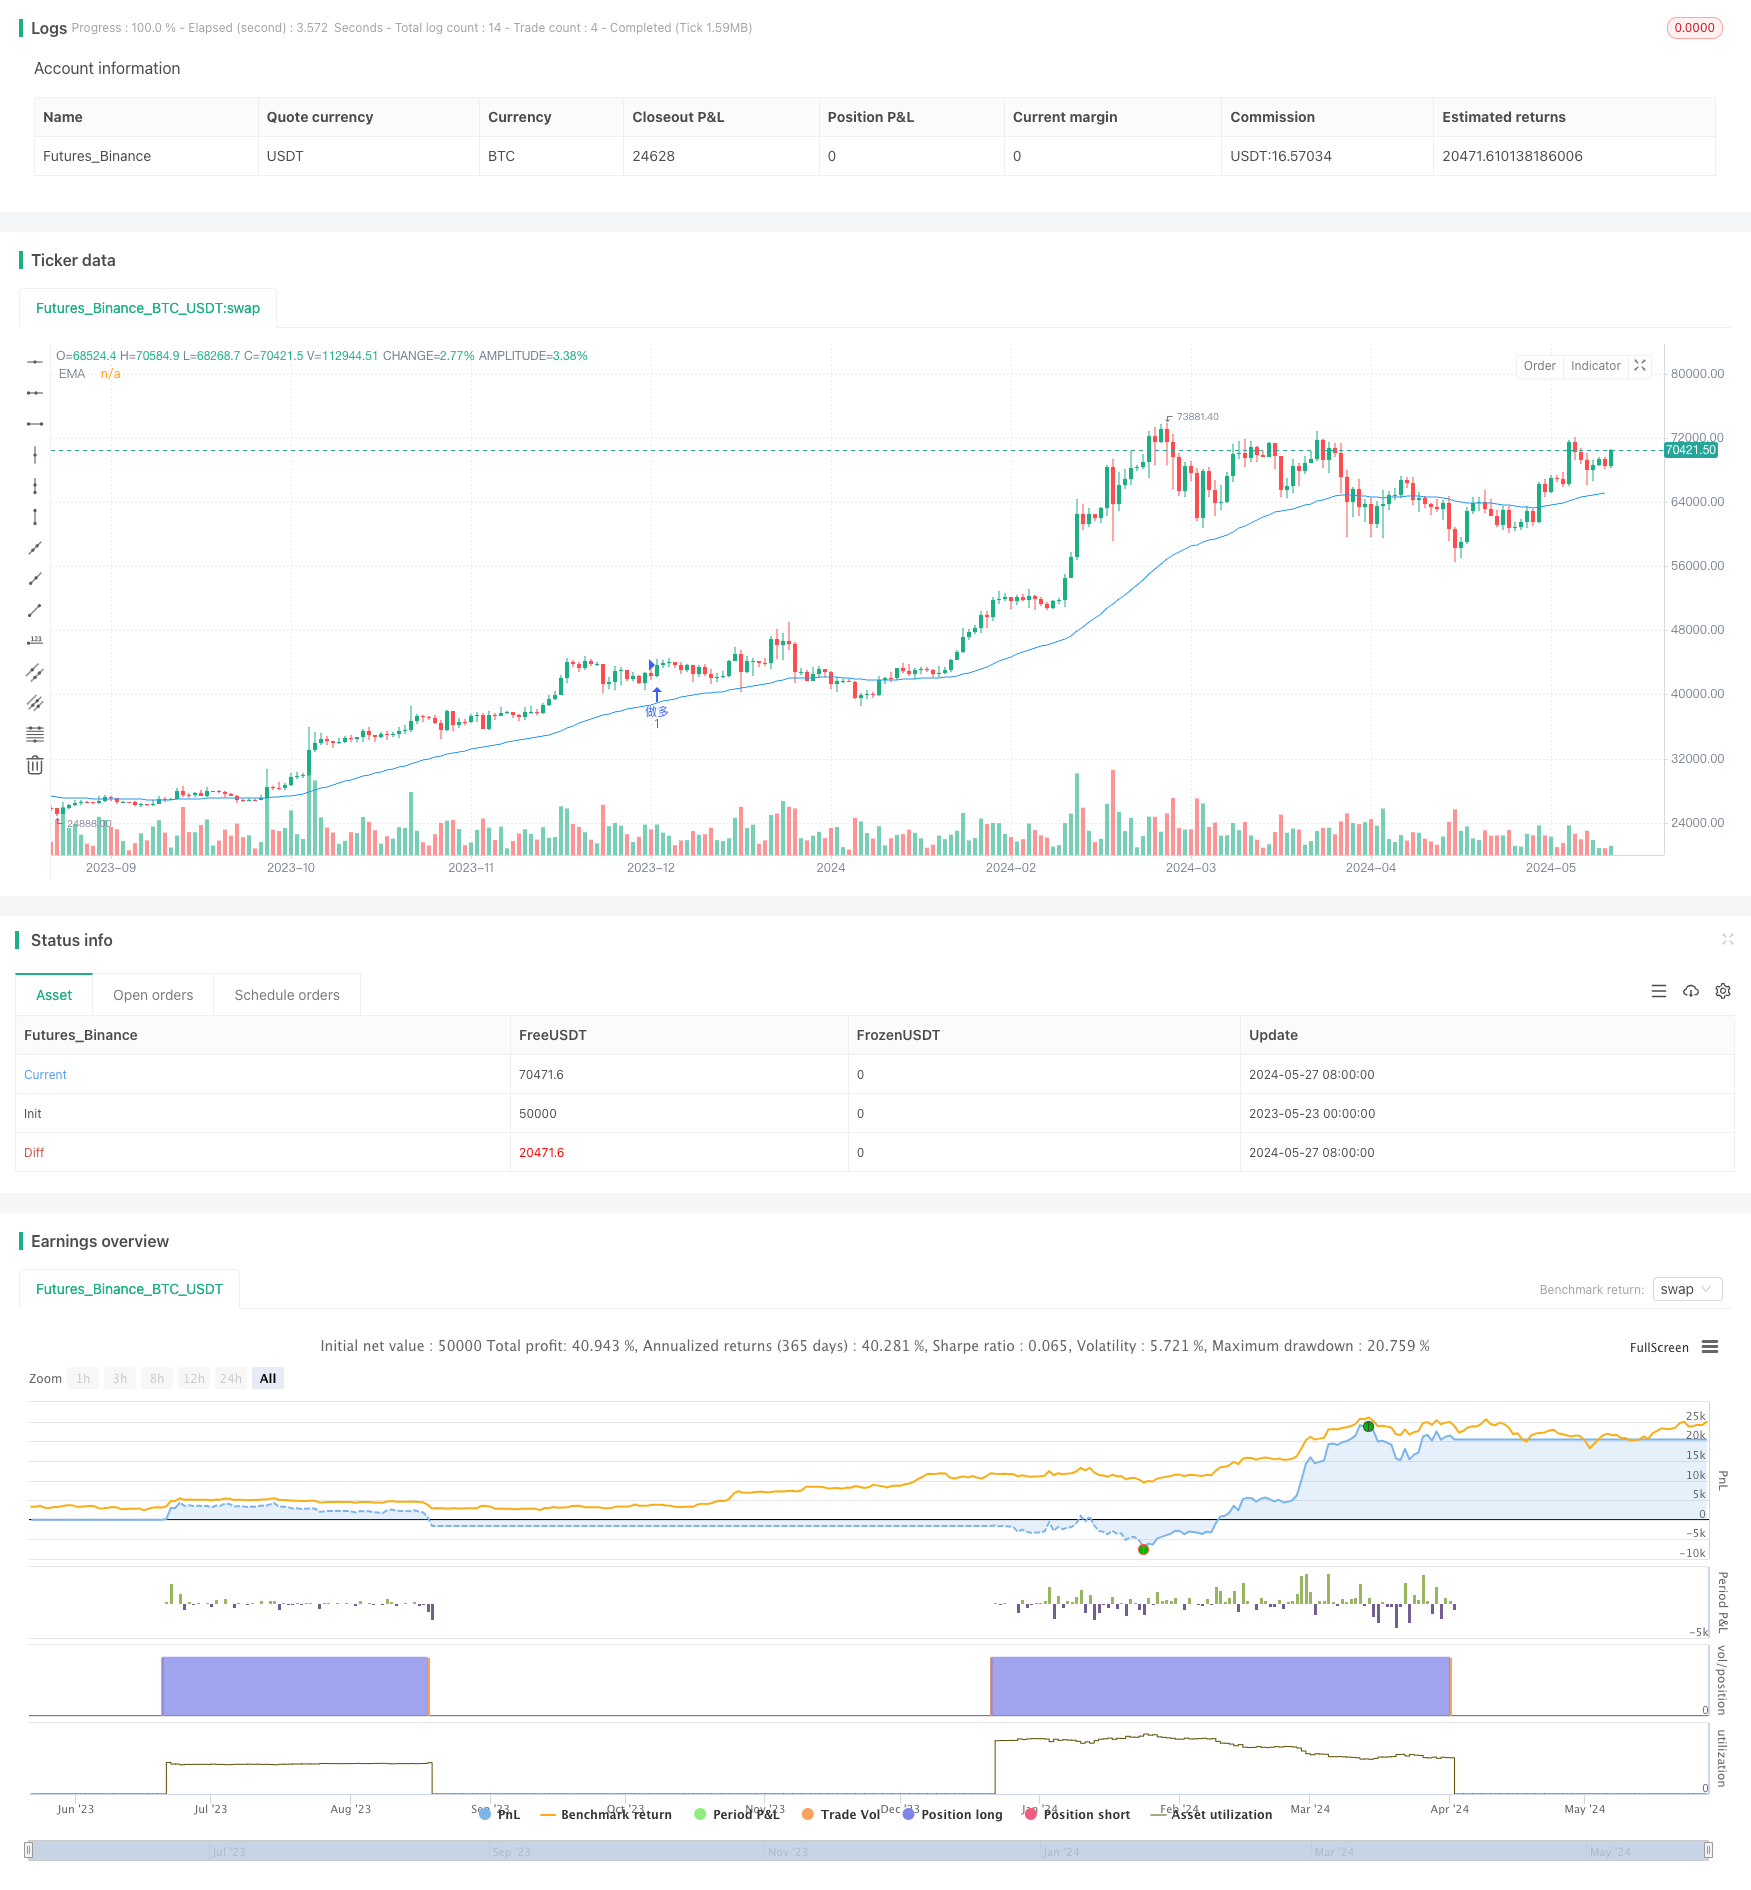
This strategy uses the Exponential Moving Average (EMA) and Awesome Oscillator (AO) to determine the market trend direction and utilizes candlestick patterns to confirm buy signals. When the EMA indicates an upward market trend, the AO is positive, and a bullish engulfing pattern appears, the strategy generates a buy signal. This strategy only takes long positions and does not short sell. Additionally, the strategy sets a stop-loss point to manage risk.

Strategy Principle

The core principle of this strategy is to use the EMA and AO indicators to determine the market trend direction and utilize candlestick patterns to confirm buy signals. Specifically:

  1. Calculate the EMA for a specified period. When the market price is above the EMA, it is considered an upward trend.
  2. Calculate the AO indicator. When the AO is positive, it is considered an upward market trend.
  3. Determine if a bullish engulfing pattern appears, i.e., the current candle closes higher than it opens, the previous candle closes lower than it opens, the current candle opens lower than the previous candle’s close, and the current candle closes higher than the previous candle’s high.
  4. When all three conditions above are met simultaneously, a buy signal is generated.
  5. Set a stop-loss point. When the market price falls below the stop-loss point, the position is closed to stop loss.

Strategy Advantages

  1. By using both the EMA and AO indicators to determine the trend, false signals can be effectively filtered out, improving the accuracy of the strategy.
  2. Utilizing candlestick patterns to confirm buy signals allows for capturing good entry points while confirming the trend.
  3. Setting a stop-loss point can effectively control strategy risk and avoid significant drawdowns.
  4. The strategy logic is clear and easy to understand and implement.

Strategy Risks

  1. This strategy is only suitable for trending markets and may generate many false signals in sideways markets.
  2. The choice of strategy parameters has a significant impact on strategy performance, and different parameters may lead to different results.
  3. The setting of the stop-loss point may cause the strategy to close positions prematurely, missing subsequent upward movements.
  4. This strategy only takes long positions and does not short sell, which may result in significant opportunity costs during downward trends.

Strategy Optimization Directions

  1. Consider adding more technical indicators, such as RSI and MACD, to further confirm trends and signals.
  2. Optimize the stop-loss strategy, such as using trailing stop-loss or tracking stop-loss, to better control risk.
  3. Introduce a position sizing strategy to adjust position sizes based on the strength of market trends and signal quality.
  4. Consider adding a short-selling mechanism to adapt to different market conditions.

Summary

This strategy uses EMA, AO, and candlestick patterns to determine trends and generate trading signals. It has the characteristics of clear logic and easy implementation. At the same time, the strategy sets a stop-loss point to control risk. However, this strategy also has some limitations, such as only being suitable for trending markets and being sensitive to parameter selection. In the future, the strategy’s performance can be further improved by adding more technical indicators, optimizing the stop-loss strategy, introducing position sizing, and other methods.


/*backtest
start: 2023-05-23 00:00:00
end: 2024-05-28 00:00:00
period: 1d
basePeriod: 1h
exchanges: [{"eid":"Futures_Binance","currency":"BTC_USDT"}]
*/

//@version=5
strategy("EMA & K-Pattern Trend Trading (Long Only)", overlay=true)

// 输入参数
emaLength = input.int(50, title="EMA长度")
aoShortLength = input.int(5, title="AO短期长度")
aoLongLength = input.int(34, title="AO长期长度")
stopLossPct = input.float(2, title="止损百分比") / 100  // 止损百分比

// 计算EMA和AO指标
ema = ta.ema(close, emaLength)
ao = ta.sma(high, aoShortLength) - ta.sma(low, aoLongLength)

// 定义趋势方向
isBullish = close > ema

// 定义K线形态
bullishK = close > open and close[1] < open[1] and open < close[1] and close > high[1] // 看涨吞没形态

// 定义买入信号
longCondition = bullishK and isBullish and ao > 0

// 绘制EMA
plot(ema, title="EMA", color=color.blue)

// 计算止损点
stopLossLevelLong = close * (1 - stopLossPct)

// 策略执行并标注信号
if (longCondition)
    strategy.entry("做多", strategy.long)
    label.new(bar_index, high, text="买入", style=label.style_label_up, color=color.green, textcolor=color.white)
    strategy.exit("止损", from_entry="做多", stop=stopLossLevelLong)

Related

More