개요
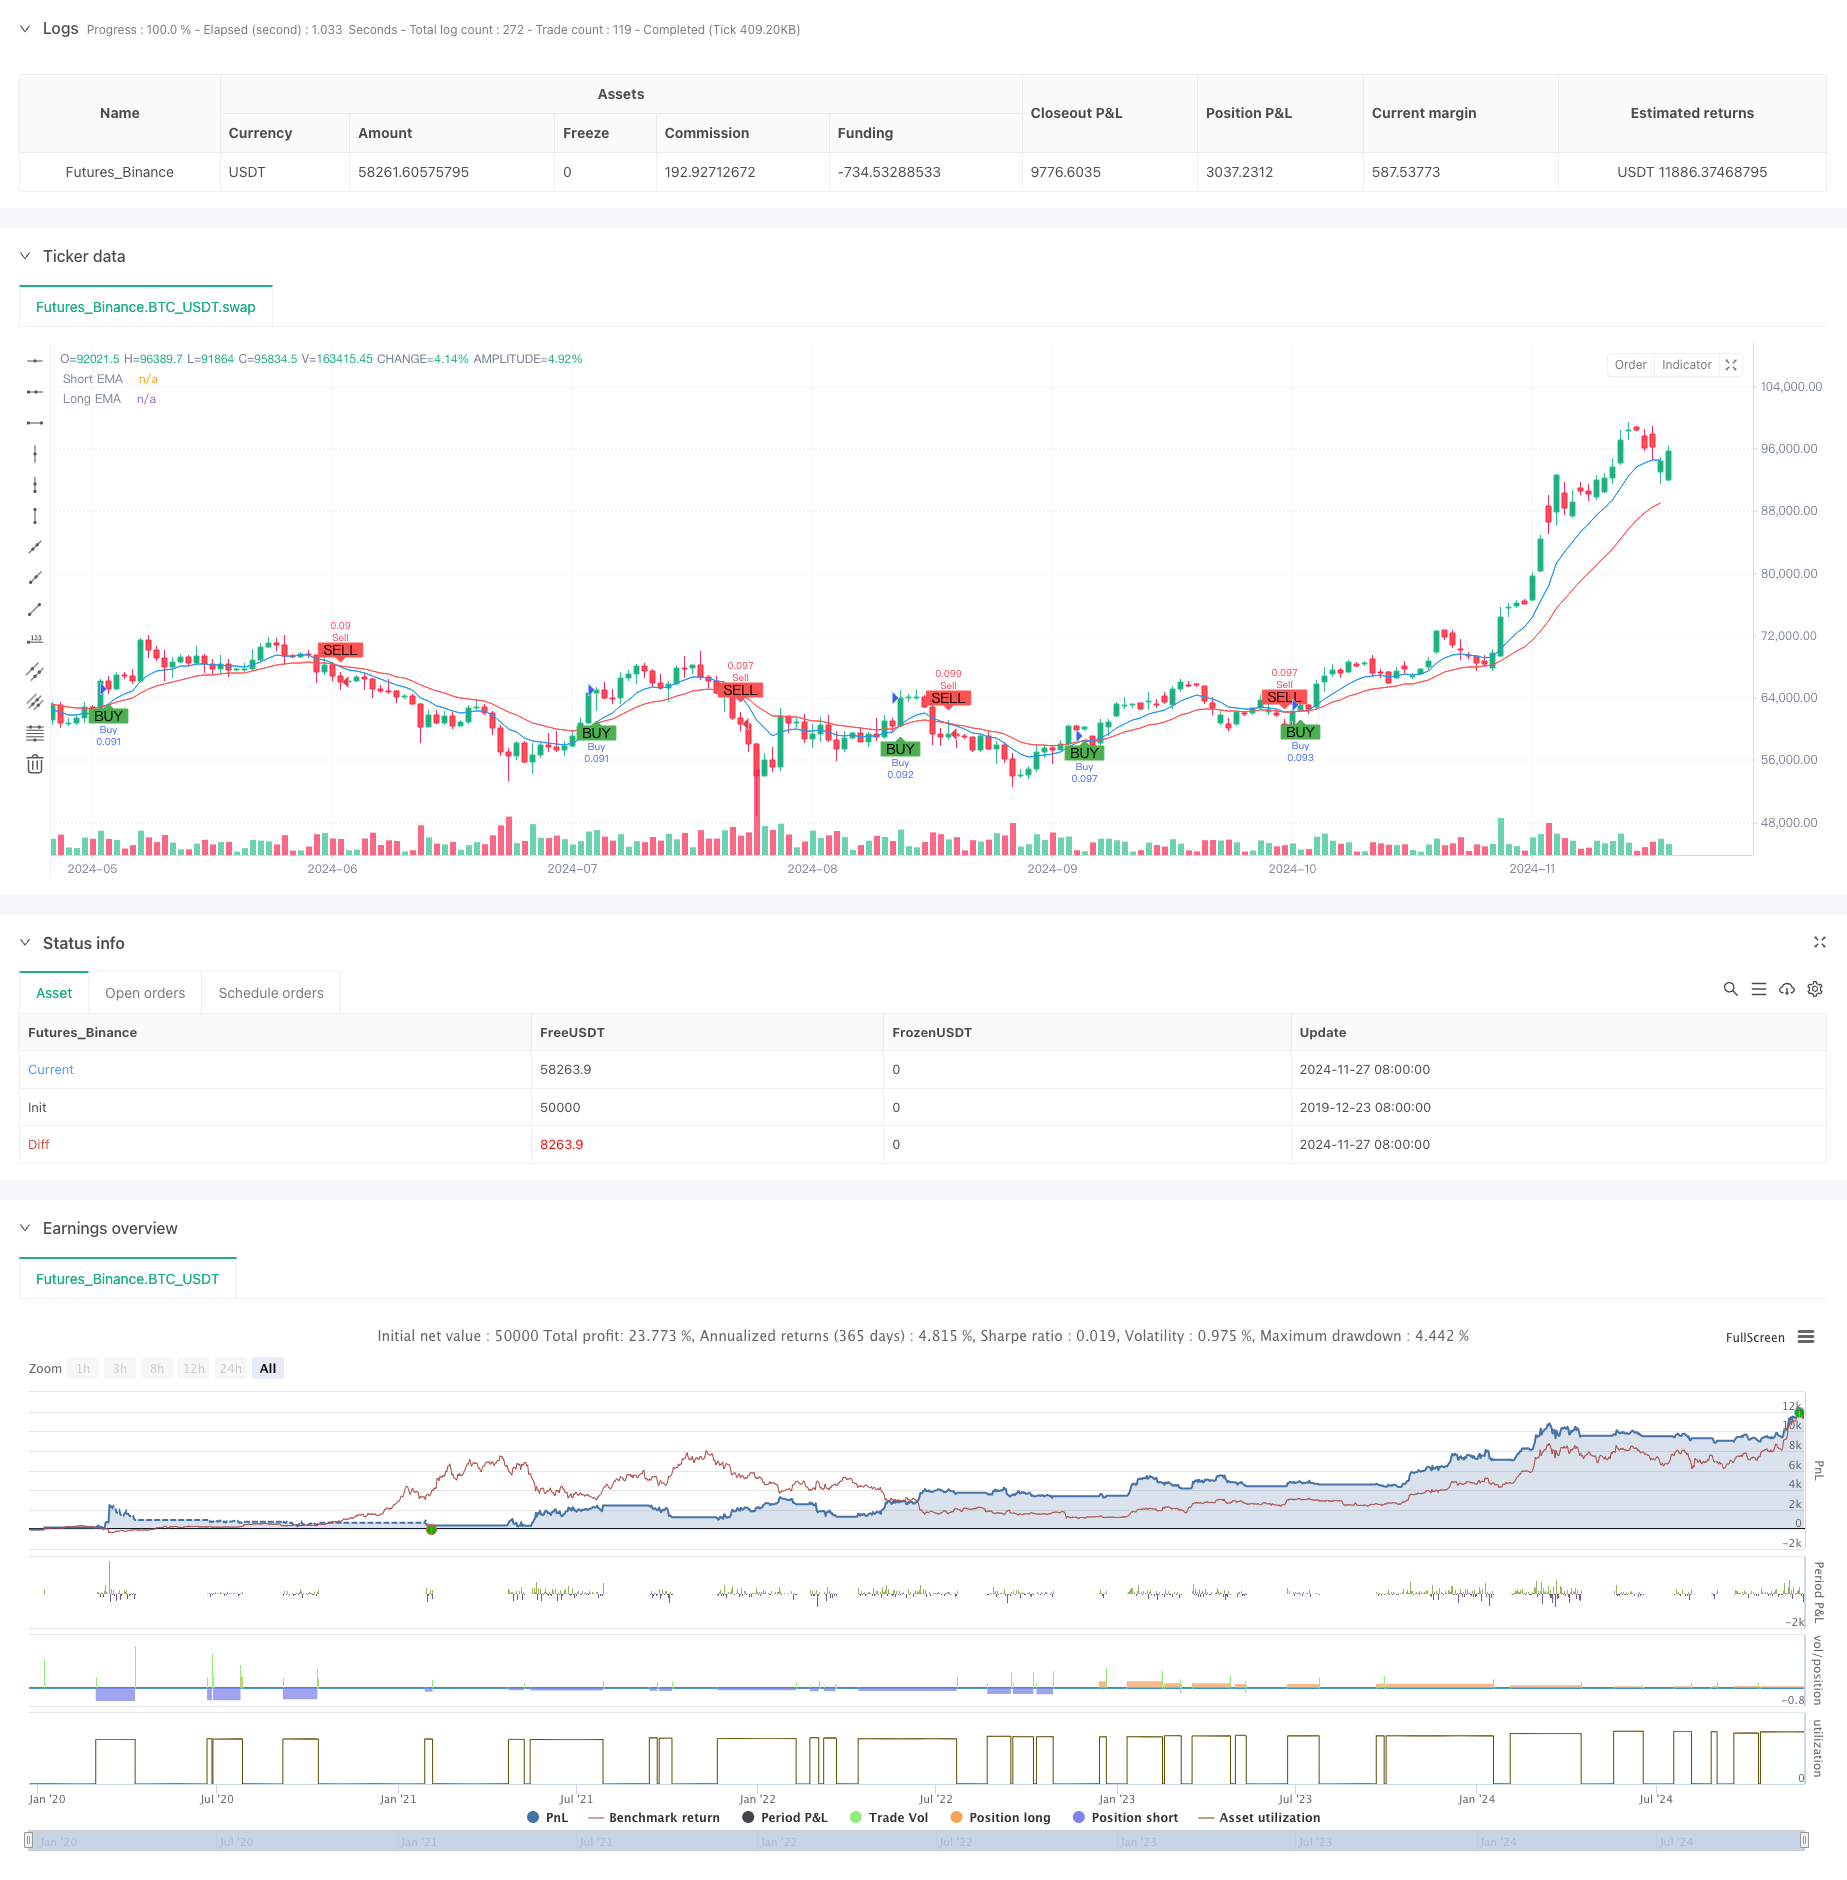
이 전략은 쌍평평선 교차와 RSI 지표가 결합된 단기 거래 시스템이다. 전략은 9주기 및 21주기 지수 이동 평균 ((EMA) 를 트렌드 판단 근거로 사용하고, 상대적으로 강한 지표 ((RSI) 를 동력 확인 도구로 결합하여 고정된 스톱로스 및 스톱을 설정하여 위험 관리를 구현한다. 이 전략은 주로 5분 수준의 짧은 라인 거래에 적용되며, 특히 변동성이 높은 시장 환경에 적합하다.
전략 원칙
이 전략의 핵심 논리는 두 가지 기술 지표의 상호 작용에 기초한다. 첫째, 9주기 EMA와 21주기 EMA의 교차를 통해 시장의 경향 방향을 결정한다. 단기 EMA가 상향으로 장기 EMA를 통과하면 상승 추세가 확립된다. 단기 EMA가 하향으로 장기 EMA를 통과하면 하향 추세가 확립된다. 둘째, RSI 지표를 사용하여 동력을 확인하고 RSI가 초과 판매 영역에 있는지 여부를 판단하여 거래 신호를 교차한다.
전략적 이점
- 신호 명확성: 평행선 교차와 RSI 확인의 이중 필터링 메커니즘을 통해 가짜 신호를 효과적으로 줄일 수 있다.
- 위험 조절: 고정 비율의 스톱로스 스 설정을 사용하여 각 거래의 위험 예상이 명확하고 제어 할 수 있습니다.
- 자동화 수준: 전략 논리가 명확하고, 매개 변수가 조정 가능하며, 자동화 거래가 가능합니다.
- 적응력: 전략은 다양한 시장 환경에 적응할 수 있으며, 특히 추세가 뚜렷한 시장에서 잘 작동합니다.
- 간단한 운영: 입출입 조건이 명확하여 거래자가 실행하고 추적할 수 있습니다.
전략적 위험
- 흔들림 시장 위험: 가로판 흔들림 시장에서 빈번한 가짜 신호가 발생하여 연속적인 정지 손실이 발생할 수 있다.
- 슬라이드 리스크: 5분 주기의 짧은 라인 거래에서 큰 슬라이드 리스크가 발생할 수 있습니다.
- 고정된 손실 위험: 고정된 퍼센트 손실을 사용하는 것은 모든 시장 환경에 적합하지 않을 수 있으며, 특히 변동성이 높은 시장에서 너무 밀도가 높을 수 있습니다.
- 시스템적 위험: 시장에서 중요한 사건이 발생했을 때 고정된 스톱로즈는 자금을 효과적으로 보호하지 못할 수 있다.
전략 최적화 방향
- 동적 중지 최적화: ATR 지표에 따라 동적으로 중지 거리를 조정하여 시장의 변동 특성에 더 적합하게 중지 할 수 있습니다.
- 시간 필터: 거래 시간 필터를 추가하여 급격한 변동이나 유동성이 부족한 시간을 피하십시오.
- 트렌드 강도 확인: 트렌드 강도를 확인하기 위해 ADX 지표를 추가할 수 있으며, 트렌드가 명확한 경우에만 거래한다.
- 포지션 관리 최적화: 시장의 변동성과 계좌 순가동성에 따라 포지션 크기를 조정할 수 있다.
- 시장 환경 인식: 시장 환경 판단 메커니즘을 추가하여 다른 시장 조건에 따라 다른 파라미터 설정을 사용합니다.
요약하다
이 전략은 평평선 교차와 RSI 지표를 결합하여 비교적 완전한 단선 거래 시스템을 구축한다. 이 전략의 장점은 신호의 명확성과 위험의 통제 가능성에 있다. 그러나 또한 최적화를 필요로 하는 공간이 있다. 동적 중단, 시간 필터 등의 메커니즘을 추가함으로써 전략의 안정성과 수익성을 더욱 향상시킬 수 있다.
전략 소스 코드
/*backtest
start: 2019-12-23 08:00:00
end: 2024-11-28 08:00:00
period: 1d
basePeriod: 1d
exchanges: [{"eid":"Futures_Binance","currency":"BTC_USDT"}]
*/

//@version=5
strategy("abo 3llash - EMA + RSI Strategy", overlay=true, default_qty_type=strategy.percent_of_equity, default_qty_value=10)

// Parameters
emaShortLength = input.int(9, title="Short EMA Length")
emaLongLength = input.int(21, title="Long EMA Length")
rsiLength = input.int(14, title="RSI Length")
rsiOverbought = input.int(70, title="RSI Overbought Level")
rsiOversold = input.int(30, title="RSI Oversold Level")
stopLossPercent = input.float(1, title="Stop Loss Percentage") / 100
takeProfitPercent = input.float(2, title="Take Profit Percentage") / 100

// Calculating EMAs and RSI
emaShort = ta.ema(close, emaShortLength)
emaLong = ta.ema(close, emaLongLength)
rsi = ta.rsi(close, rsiLength)

// Buy and Sell Conditions
buyCondition = ta.crossover(emaShort, emaLong) and rsi < rsiOverbought
sellCondition = ta.crossunder(emaShort, emaLong) and rsi > rsiOversold

// Plotting the EMAs
plot(emaShort, title="Short EMA", color=color.blue)
plot(emaLong, title="Long EMA", color=color.red)

// Generating buy and sell signals on the chart
plotshape(series=buyCondition, title="Buy Signal", location=location.belowbar, color=color.green, style=shape.labelup, text="BUY")
plotshape(series=sellCondition, title="Sell Signal", location=location.abovebar, color=color.red, style=shape.labeldown, text="SELL")

// Strategy Execution
if (buyCondition)
    strategy.entry("Buy", strategy.long)
    // Set Stop Loss and Take Profit for Buy
    stopLossLevel = close * (1 - stopLossPercent)
    takeProfitLevel = close * (1 + takeProfitPercent)
    strategy.exit("Take Profit/Stop Loss", from_entry="Buy", stop=stopLossLevel, limit=takeProfitLevel)

if (sellCondition)
    strategy.entry("Sell", strategy.short)
    // Set Stop Loss and Take Profit for Sell
    stopLossLevel = close * (1 + stopLossPercent)
    takeProfitLevel = close * (1 - takeProfitPercent)
    strategy.exit("Take Profit/Stop Loss", from_entry="Sell", stop=stopLossLevel, limit=takeProfitLevel)