RSI 모멘텀 전략으로 삼각형 브레이크업
저자:차오장, 날짜: 2024-12-05 16:19:31태그:RSI

전반적인 설명
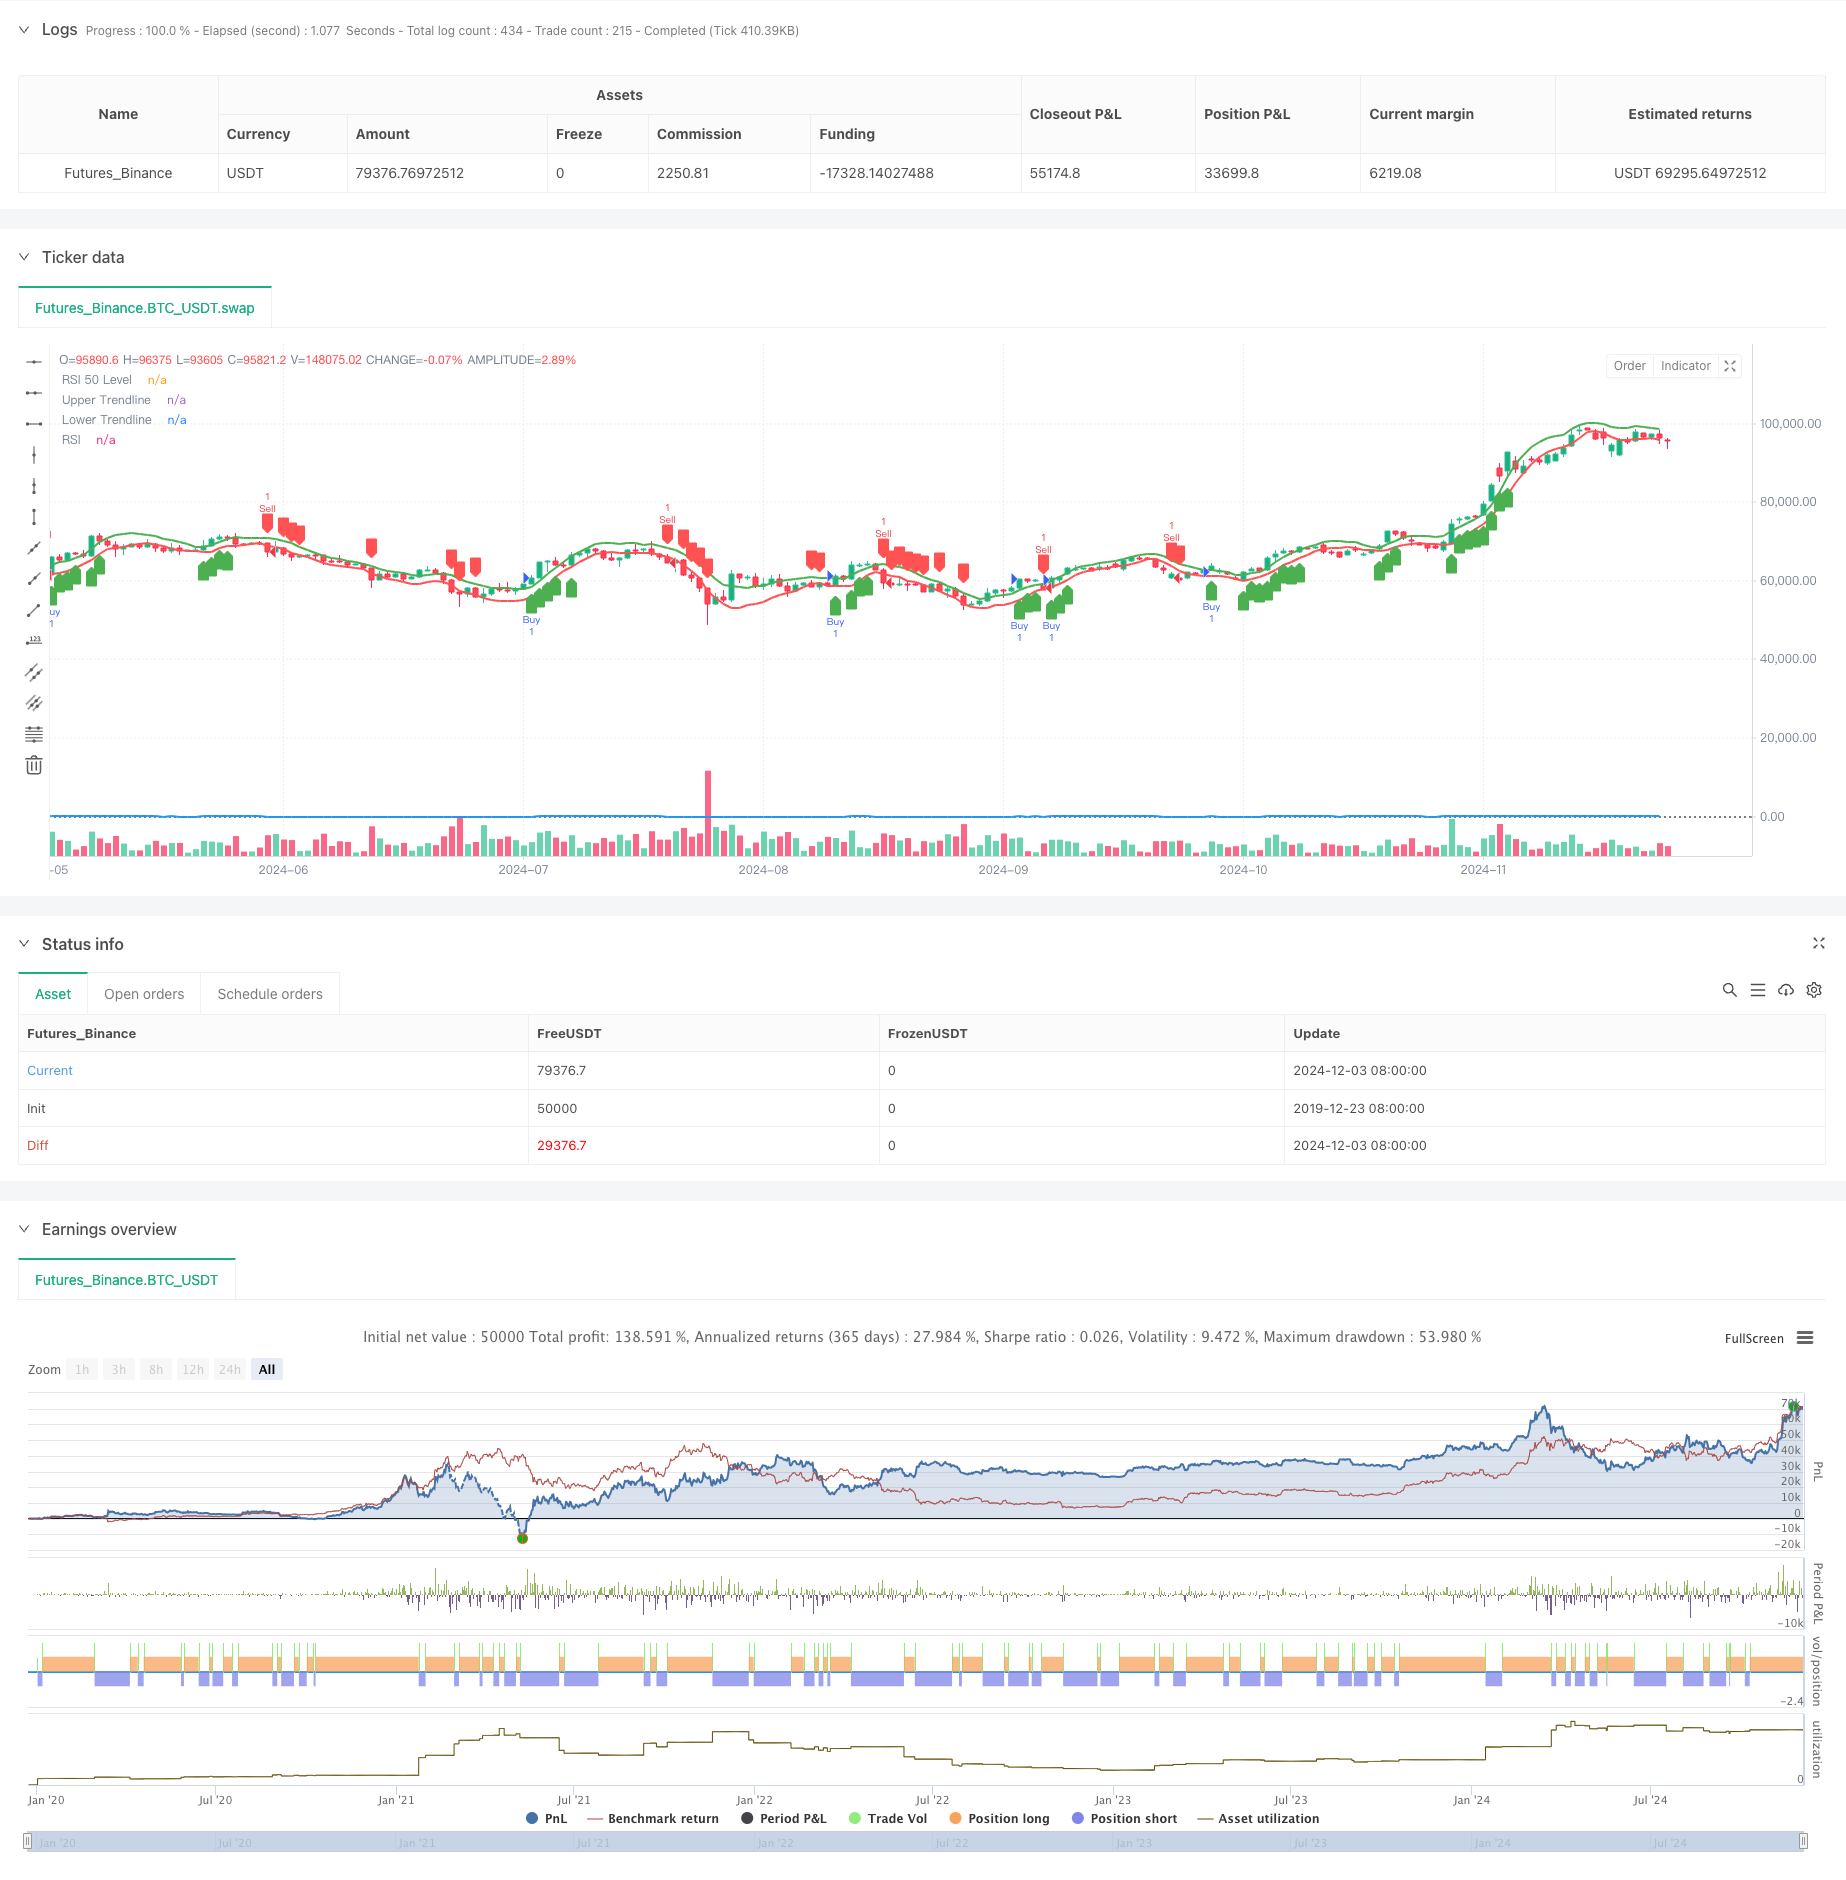
이 전략은 가격 패턴과 기술 지표를 결합한 양적 거래 시스템이다. 주로 삼각형 패턴 브레이크오웃을 식별하고 RSI 모멘텀을 사용하여 거래를 확인한다. 전략은 상위와 하위 트렌드 라인을 구성하기 위해 선형 회귀를 사용하여 가격 브레이크오웃과 RSI 포지션을 통해 거래 신호를 결정하여 패턴과 모멘텀 분석의 유기적인 조합을 달성한다.
전략 원칙
핵심 논리는 삼각형 패턴 인식 및 RSI 모멘텀 확인이라는 두 가지 주요 구성 요소로 구성됩니다. 첫째, 최근 N 기간의 최고와 최저를 계산하기 위해 선형 회귀를 사용하여 삼각형을 형성하기 위해 상위 및 하위 트렌드 라인을 구성합니다. 가격이 상위 트렌드 라인을 넘어서 RSI가 50 이상이면 구매 신호를 유발합니다. 가격이 하위 트렌드 라인을 넘어서 RSI가 50 미만일 때 판매 신호를 유발합니다. 전략은 삼각형 길이와 RSI 기간에 대한 조정 가능한 매개 변수를 갖추고 있으며 강력한 적응력을 제공합니다.
전략적 장점
- 명확한 구조: 전략은 패턴 분석과 추진력 분석을 유기적으로 결합하여 이중 확인을 통해 거래 신뢰성을 향상시킵니다.
- 유연한 매개 변수: 조정 가능한 삼각형 길이와 RSI 기간 매개 변수를 제공하여 다른 시장 특성에 대한 최적화를 촉진합니다.
- 강력한 시각화: 그래프에 트렌드 라인과 거래 신호를 명확하게 표시하여 전략 모니터링 및 백테스팅 분석을 촉진합니다.
- 통제된 위험: 거짓 파업의 위험을 효과적으로 줄이기 위해 RSI를 필터로 사용합니다.
전략 위험
- 불안한 시장에서 빈번한 거래를 생성하여 거래 비용을 증가시킬 수 있습니다.
- 역사적인 데이터에 기초한 트렌드 라인 계산은 빠르게 변동적인 시장에서 뒤쳐질 수 있습니다.
- RSI 지표는 특정 시장 조건에서 잘못된 신호를 생성할 수 있습니다.
- 이 전략에는 스톱 로스 메커니즘이 없기 때문에 극심한 시장 변동성 (extreme market volatility) 에서 상당한 손실을 초래할 수 있습니다.
전략 최적화 방향
- 스톱 로스 메커니즘 도입: 위험 통제를 위해 고정 또는 후속 스톱 로스를 추가하는 것이 좋습니다.
- 입력 타이밍을 최적화: 브레이크오웃 신호 신뢰성을 향상시키기 위해 볼륨 확인을 추가하는 것을 고려하십시오.
- 신호 필터링을 향상시킵니다. 다양한 시장에서 빈번한 거래를 피하기 위해 트렌드 필터를 추가 할 수 있습니다.
- 동적 매개 변수 최적화: 시장 변동성에 따라 동적으로 삼각형 길이와 RSI 문턱을 조정하는 것을 제안합니다.
결론
RSI 모멘텀 전략과 함께 삼각형 브레이크아웃은 완전하고 논리적으로 명확한 양적 거래 시스템입니다. 패턴과 모멘텀의 이중 확인 메커니즘을 통해 거래 신호 신뢰성을 효과적으로 향상시킵니다. 특정 위험이 존재하지만 전략은 합리적인 매개 변수 최적화 및 위험 통제 조치를 통해 좋은 실용적 가치를 가지고 있습니다. 거래자는 라이브 거래 전에 특정 시장 특성에 따라 철저한 매개 변수 최적화 및 백테스팅 검증을 수행하는 것이 좋습니다.
/*backtest
start: 2019-12-23 08:00:00
end: 2024-12-04 00:00:00
period: 1d
basePeriod: 1d
exchanges: [{"eid":"Futures_Binance","currency":"BTC_USDT"}]
*/

//@version=5
strategy("Triangle Breakout with RSI", overlay=true)

// Input parameters
len = input.int(15, title="Triangle Length")
rsiPeriod = input.int(14, title="RSI Period")
rsiThresholdBuy = input.int(50, title="RSI Threshold for Buy")
rsiThresholdSell = input.int(50, title="RSI Threshold for Sell")

// Calculate the RSI
rsi = ta.rsi(close, rsiPeriod)

// Calculate highest high and lowest low for triangle pattern
highLevel = ta.highest(high, len)
lowLevel = ta.lowest(low, len)

// Create trendlines for the triangle
upperTrend = ta.linreg(high, len, 0)
lowerTrend = ta.linreg(low, len, 0)

// Plot the trendlines on the chart
plot(upperTrend, color=color.green, linewidth=2, title="Upper Trendline")
plot(lowerTrend, color=color.red, linewidth=2, title="Lower Trendline")

// Detect breakout conditions
breakoutUp = close > upperTrend
breakoutDown = close < lowerTrend

// Confirm breakout with RSI
buyCondition = breakoutUp and rsi > rsiThresholdBuy
sellCondition = breakoutDown and rsi < rsiThresholdSell

// Plot breakout signals with confirmation from RSI
plotshape(series=buyCondition, title="Buy Signal", location=location.belowbar, color=color.green, style=shape.labelup, size=size.small)
plotshape(series=sellCondition, title="Sell Signal", location=location.abovebar, color=color.red, style=shape.labeldown, size=size.small)

// Strategy: Buy when triangle breaks upwards and RSI is above 50; Sell when triangle breaks downwards and RSI is below 50
if (buyCondition)
    strategy.entry("Buy", strategy.long)

if (sellCondition)
    strategy.entry("Sell", strategy.short)

// Plot RSI on the bottom pane
hline(50, "RSI 50 Level", color=color.gray, linestyle=hline.style_dotted)
plot(rsi, color=color.blue, linewidth=2, title="RSI")
관련
- 동적 듀얼 인디케이터 모멘텀 트렌드 양적 전략 시스템
- 이중 이동 평균-RSI 다 신호 트렌드 거래 전략
- 최적화된 내일 거래 전략을 위해 RSI 모멘텀 지표와 결합된 동적 EMA 시스템
- 다기술 지표 크로스오버 동력 추세 전략
- 동적 스톱 로스 조정 코끼리 바 트렌드 전략에 따라
- 피라미딩 포지션 관리 시스템과 함께 두 기간 RSI 트렌드 모멘텀 전략
- 다중 이동 평균 크로스오버와 함께 동적 RSI 양적 거래 전략
- 동적 트렌드 RSI 지표 교차 전략
- 분량 가격 촛불 패턴 거래 전략과 함께 다차원 KNN 알고리즘
- 적응형 다중 전략 동적 전환 시스템: 트렌드 추종 및 범위 오스실레이션을 결합하는 양적 거래 전략
- 고급 다중 지표 다차원 트렌드 크로스 양적 전략
더 많은
- 듀얼 타임프레임 동적 지원 거래 시스템
- 전략에 따른 다기간 이동평균 및 RSI 모멘텀 크로스 트렌드
- 금융자산 MFI 기반 과잉판매구역 출구 및 신호 평균화 시스템
- 모멘텀 인디케이터와 멀티 EMA 크로스오버 거래 전략
- MACD-KDJ 결합된 마틴게일 피라미딩 양적 거래 전략
- 다중 패턴 인식 및 SR 레벨 거래 전략
- G 채널 및 EMA 트렌드 필터 거래 시스템
- 동적 스톱 로스 다 기간 RSI 트렌드 전략
- 동적 이중 이동 평균 돌파구 거래 시스템
- 다중 지표 크로스오버 모멘텀 트렌드 최적화 된 영업 및 중단 손실 시스템으로 전략을 따르는 것
- 5개의 EMA RSI 트렌드를 따르는 동적 채널 거래 시스템
- 전략에 따른 적응형 가중 추세 (VIDYA 다중 지표 시스템)
- 증강된 이중 회전점 반전 거래 전략
- AO 다층 양적 트렌드 강화 전략
- DPO-EMA 트렌드 크로스오버 양적 전략 연구
- 스마트 리스크 관리와 함께 EMA-MACD 고주파 수치 전략
- 리스크 관리 시스템과 함께 멀티 EMA 트렌드 모멘텀 거래 전략
- 이동 평균 필터 (HBTS) 를 가진 역사적인 파격 트렌드 시스템
- 포지션 스케일링과 함께 멀티-RSI-EMA 모멘텀 헤딩 전략
- 동적 이중 EMA 크로스오버 양적 거래 전략