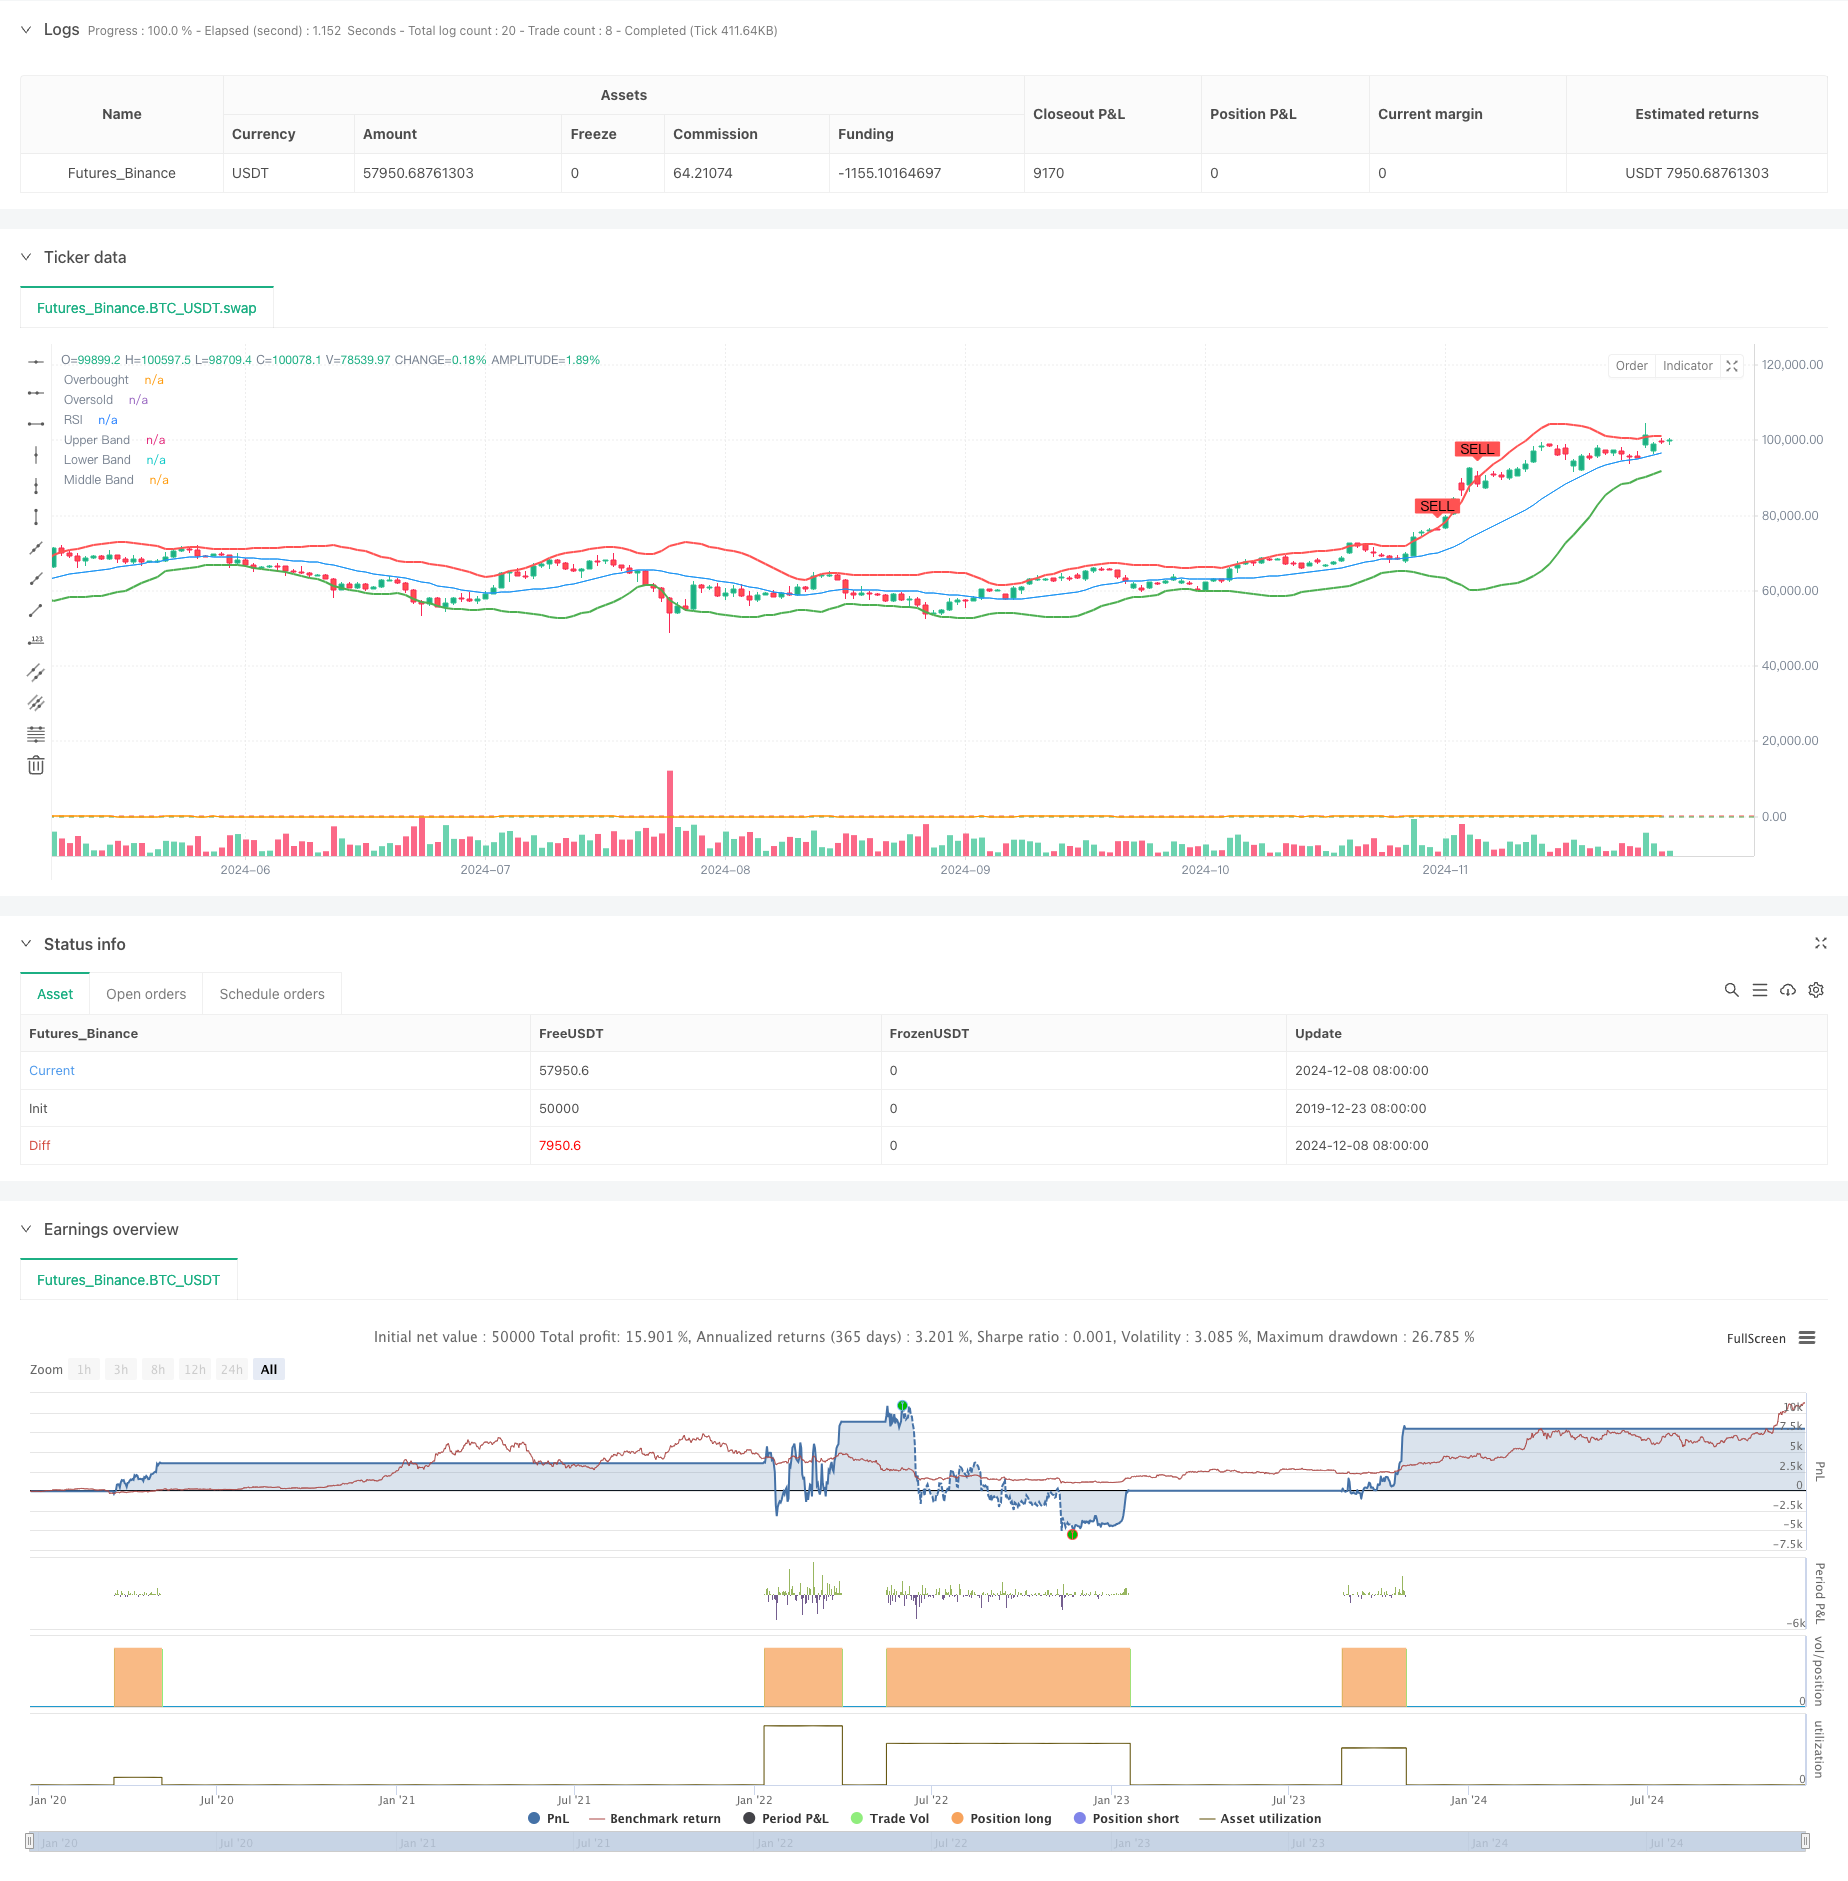
볼링거 밴드 및 RSI 결합 동적 거래 전략
저자:차오장, 날짜: 2024-12-11 11:21:54태그:BBRSISMASD

전반적인 설명
이 전략은 볼링거 밴드와 상대적 강도 지수 (RSI) 를 결합한 적응형 거래 시스템이다. 이 전략은 시장 추세와 변동성을 파악하기 위해 볼링거 밴드
전략 원칙
이 전략의 핵심은 RSI 지표와 연동하여 볼링거 밴드 (Bollinger Bands) 상위, 중위, 하위 대역을 통해 시장 변동성 기회를 포착하는 것입니다. 볼링거 밴드는 상위 및 하위 대역에 대한 2 개의 표준 편차와 함께 20 기간 이동 평균을 기반으로합니다. RSI는 70을 과잉 구매 수준과 30을 과잉 판매 수준으로 14 기간 계산을 사용합니다. 가격이 하위 대역에 닿고 RSI가 과잉 판매 영역에있을 때 구매 신호가 생성됩니다. 가격이 상위 대역에 닿고 RSI가 과잉 구매 영역에있을 때 판매 신호가 발생합니다. 이 이중 확인 메커니즘은 잘못된 신호를 효과적으로 감소시킵니다.
전략적 장점
- 높은 적응력: 볼링거 밴드는 시장 변동성에 따라 거래 범위를 자동으로 조정하여 다른 시장 환경에 적응합니다.
- 신뢰할 수 있는 신호: 볼링거 밴드 (Bollinger Band) 와 RSI를 통한 이중 확인 메커니즘은 잘못된 신호를 크게 감소시킵니다.
- 리스크 제어: 볼링거 밴드
표준편차 계산은 동적 리스크 통제를 제공합니다. - 시각 명확성: 전략은 이해하기 쉽고 실행하기 위해 명확한 시각 신호를 제공합니다.
- 유연한 매개 변수: 주요 매개 변수는 다른 시장 특성에 따라 조정할 수 있습니다.
전략 위험
- 시장을 가로질러 발생하는 위험: 범위를 경계하는 시장에서 빈번한 잘못된 파업 신호를 유발할 수 있습니다.
- 지연 위험: 이동 평균 및 RSI 지표는 고유 한 지연을 가지고 있습니다.
- 매개 변수 민감도: 다른 매개 변수 설정은 전략 성능에 상당한 변화를 초래할 수 있습니다.
- 시장 환경 의존성: 트렌딩 시장에서 더 좋은 성과를 내고, 다양한 시장에서 저조한 성과를 낼 수 있습니다.
전략 최적화 방향
- 트렌드 필터를 도입하십시오: 장기 이동 평균 또는 트렌드 지표를 추가하여 거래 방향을 필터하십시오.
- 동적 매개 변수 조정: 시장 변동성에 따라 볼링거 밴드 및 RSI 매개 변수를 자동으로 조정합니다.
- 부피 확인 추가: 신호 시스템에 부피 분석을 통합합니다.
- 스톱 로스를 최적화: ATR 스톱이나 퍼센티트 트레일링 스톱과 같은 동적 스톱 로스 메커니즘을 도입합니다.
- 시간 필터를 추가하십시오: 불리한 기간 동안 거래를 피하기 위해 시장 시간 특성을 고려하십시오.
요약
이 전략은 볼링거 밴드 (Bollinger Bands) 와 RSI (RSI) 를 결합하여 비교적 완전한 거래 시스템을 구축한다. 이 전략의 강점은 시장 변동에 적응하고 신뢰할 수있는 거래 신호를 제공하는 능력에 있다. 그러나 전략 성능에 대한 시장 환경의 영향에 주의가 필요하다. 제안된 최적화 방향에 의해 전략의 안정성과 신뢰성이 더욱 향상될 수 있다. 실제 응용에서는 거래자가 특정 시장 특성에 따라 매개 변수를 조정하고 거래 결정을 위해 다른 기술 분석 도구와 결합하는 것이 좋습니다.
/*backtest
start: 2019-12-23 08:00:00
end: 2024-12-09 08:00:00
period: 1d
basePeriod: 1d
exchanges: [{"eid":"Futures_Binance","currency":"BTC_USDT"}]
*/

//@version=5
strategy("Bollinger Bands and RSI Strategy with Buy/Sell Signals", overlay=true)

// Input settings
bb_length = input.int(20, title="Bollinger Bands Length", minval=1)
bb_mult = input.float(2.0, title="Bollinger Bands Multiplier", minval=0.1)
rsi_length = input.int(14, title="RSI Length", minval=1)
rsi_overbought = input.int(70, title="RSI Overbought Level", minval=50)
rsi_oversold = input.int(30, title="RSI Oversold Level", minval=1)

// Bollinger Bands calculation
basis = ta.sma(close, bb_length)
dev = bb_mult * ta.stdev(close, bb_length)
upper_band = basis + dev
lower_band = basis - dev

// RSI calculation
rsi = ta.rsi(close, rsi_length)

// Buy signal: Price touches lower Bollinger Band and RSI is oversold
buy_signal = ta.crossover(close, lower_band) and rsi < rsi_oversold

// Sell signal: Price touches upper Bollinger Band and RSI is overbought
sell_signal = ta.crossunder(close, upper_band) and rsi > rsi_overbought

// Execute orders
if (buy_signal)
    strategy.entry("Buy", strategy.long)
if (sell_signal)
    strategy.close("Buy")

// Plotting Bollinger Bands and RSI
plot(upper_band, color=color.red, linewidth=2, title="Upper Band")
plot(lower_band, color=color.green, linewidth=2, title="Lower Band")
plot(basis, color=color.blue, linewidth=1, title="Middle Band")
hline(rsi_overbought, "Overbought", color=color.red, linestyle=hline.style_dashed)
hline(rsi_oversold, "Oversold", color=color.green, linestyle=hline.style_dashed)
plot(rsi, "RSI", color=color.orange)

// Add Buy/Sell signals on the chart
plotshape(series=buy_signal, title="Buy Signal", location=location.belowbar, color=color.green, style=shape.labelup, text="BUY")
plotshape(series=sell_signal, title="Sell Signal", location=location.abovebar, color=color.red, style=shape.labeldown, text="SELL")
- 볼링거 밴드 및 RSI 결합 거래 전략
- 적응적인 볼링거 밴드 역동적 포지션 관리 전략
- 볼링거 밴드 및 RSI 크로스오버 거래 전략
- 보린저 밴드 및 RSI 통합을 통해 향상된 평균 역전 전략
- 양적 전략에 따른 볼링거 밴드 동력 추세
- 다기술 지표 동적 적응 거래 전략 (MTDAT)
- 볼링거 대역은 동적 지원과 함께 반전 거래 전략을 의미합니다
- 볼링거 밴드 브레이크업 양적 거래 전략
- 볼링거 밴드 정확한 크로스오버 양적 전략
- 볼링거 밴드 모멘텀 역전 양적 전략
- 일일 범위 파업 단방향 거래 전략
- SMA-RSI-MACD 다중 지표 동적 한도 주문 거래 전략
- EMA/SMA 트렌드 추종 스윙 거래 전략 결합 된 볼륨 필터 및 비율 취득/손실 정지 시스템
- VWAP 표준 오차 평균 역전 거래 전략
- 동적 가격대 브레이크업 거래 전략 지원 및 저항 양적 시스템
- 다중 지표 트렌드 모멘텀 크로스오버 양적 전략
- 리스크-보상 타겟팅 전략과 함께 고급 동적 후속 정지
- 선진 단장 동적 트렌드 라인 브레이크 전략
- 볼링거 밴드 및 ATR를 기반으로 한 다단계 지능형 동적 트레일링 스톱 전략
- 동적 이중 EMA 크로스오버 전략
- RSI-ATR 모멘텀 변동성 결합 거래 전략
- 이중 EMA 트렌드 추후 전략과 제한 구매 입점
- 멀티 전략 기술 분석 거래 시스템
- 다중 시간 프레임 결합 된 촛불 패턴 인식 거래 전략
- 트리플 볼링거 밴드는 양적 거래 전략에 따라 트렌드를 감지합니다.
- 볼링거 밴드와 RSI를 기반으로 한 다차원 동적 브레이크오프 거래 시스템
- RSI 평균 반전 브레이크업 전략
- 이중 EMA 크로스오버 모멘텀 트렌드 전략
- 다단계 ATR 거래 전략
- 듀얼 타임프레임 동적 지원 거래 시스템