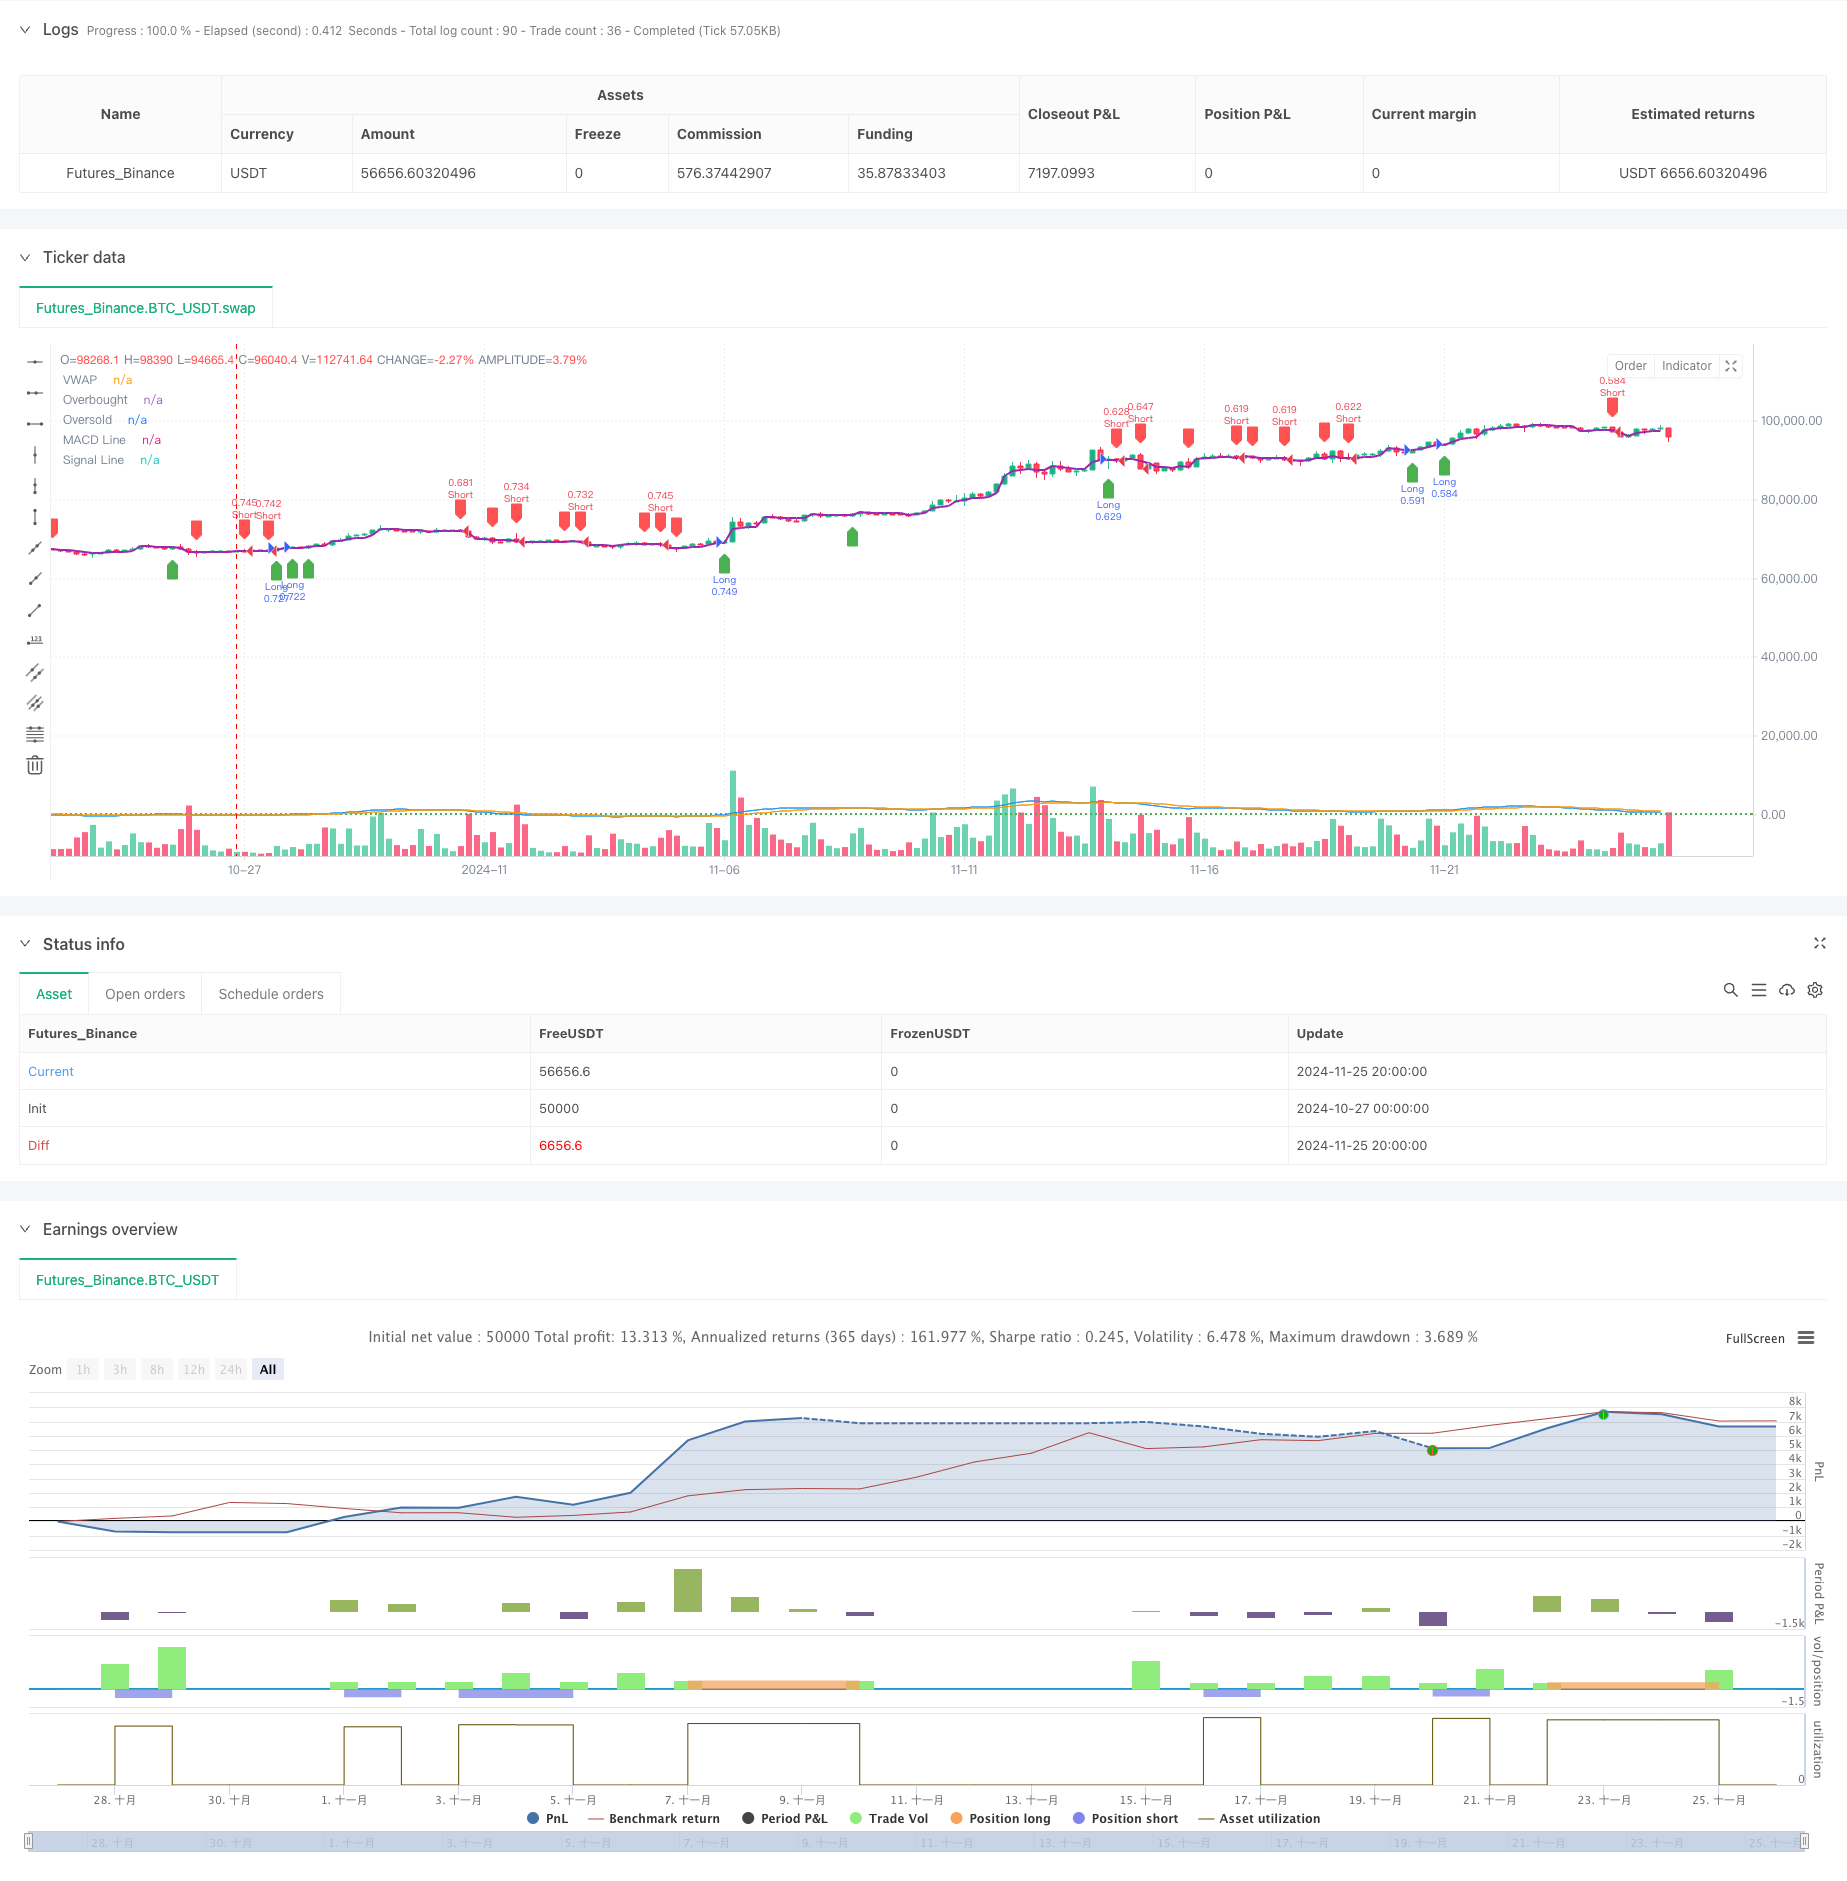
VWAP-MACD-RSI Strategi Perdagangan Kuantitatif Berbilang Faktor
Penulis:ChaoZhang, Tarikh: 2024-11-27 16:11:00Tag:VWAPMACDRSITPSL

Ringkasan
Ini adalah strategi dagangan kuantitatif berdasarkan tiga penunjuk teknikal: VWAP, MACD, dan RSI. Strategi ini mengenal pasti peluang dagangan dengan menggabungkan isyarat dari Harga Purata Berat Volume (VWAP), Divergensi Convergensi Purata Bergerak (MACD), dan Indeks Kekuatan Relatif (RSI).
Prinsip Strategi
Logik teras berdasarkan analisis komprehensif tiga penunjuk utama:
- VWAP berfungsi sebagai garis rujukan trend utama, dengan persilangan harga menunjukkan perubahan trend yang berpotensi
- Histogram MACD mengesahkan kekuatan trend dan arah, dengan nilai positif menunjukkan trend menaik dan nilai negatif menunjukkan trend menurun
- RSI mengenal pasti keadaan pasaran yang terlalu banyak dibeli atau terlalu banyak dijual untuk mengelakkan memasuki tahap yang melampau
Syarat pembelian memerlukan:
- Harga melintasi di atas VWAP
- Histogram MACD positif
- RSI di bawah tahap overbought
Syarat jualan memerlukan:
- Harga menyeberang di bawah VWAP
- Histogram MACD negatif
- RSI di atas paras oversold
Kelebihan Strategi
- Penanda teknikal berbilang penanda silang meningkatkan kebolehpercayaan isyarat
- VWAP menggabungkan faktor jumlah untuk analisis kedalaman pasaran yang lebih baik
- RSI menapis keadaan pasaran yang melampau, mengurangkan risiko pecah palsu
- Keuntungan berasaskan peratusan dan stop loss menyesuaikan diri dengan julat harga yang berbeza
- Ukuran kedudukan berdasarkan ekuiti akaun membolehkan pengurusan kedudukan dinamik
- Logik strategi yang jelas, mudah difahami dan dikekalkan
Risiko Strategi
- Pasaran yang bergelombang boleh menghasilkan perdagangan yang kerap, meningkatkan kos urus niaga
- Pelbagai penunjuk boleh menyebabkan isyarat tertunda, mempengaruhi masa kemasukan
- Peratusan tetap mengambil keuntungan dan berhenti kerugian mungkin tidak sesuai dengan semua keadaan pasaran
- Kekurangan pertimbangan turun naik boleh meningkatkan risiko semasa tempoh turun naik yang tinggi
- Kekurangan penapisan kekuatan trend boleh menghasilkan isyarat berlebihan dalam trend lemah
Arahan Pengoptimuman Strategi
- Memperkenalkan ATR untuk pelarasan dinamik tahap mengambil keuntungan dan berhenti kerugian
- Tambah penapis kekuatan trend untuk mengurangkan isyarat palsu di pasaran bergolak
- Mengoptimumkan tetapan tempoh VWAP, mempertimbangkan gabungan beberapa tempoh VWAP
- Melaksanakan mekanisme pengesahan jumlah untuk meningkatkan kebolehpercayaan isyarat pecah
- Pertimbangkan untuk menambah penapis masa untuk mengelakkan perdagangan semasa tempoh kecairan yang rendah
- Melaksanakan mekanisme saiz kedudukan dinamik berdasarkan keadaan pasaran
Ringkasan
Strategi ini membina sistem dagangan yang agak lengkap dengan menggabungkan tiga penunjuk teknikal klasik: VWAP, MACD, dan RSI. Reka bentuk menekankan kebolehpercayaan isyarat dan pengurusan risiko melalui penanda silang pelbagai penanda untuk meningkatkan kualiti dagangan. Walaupun terdapat aspek yang memerlukan pengoptimuman, kerangka keseluruhan adalah baik dan menawarkan skalabiliti yang baik.
/*backtest
start: 2024-10-27 00:00:00
end: 2024-11-26 00:00:00
period: 4h
basePeriod: 4h
exchanges: [{"eid":"Futures_Binance","currency":"BTC_USDT"}]
*/

//@version=5
strategy("pbs", overlay=true, default_qty_type=strategy.percent_of_equity, default_qty_value=100)

// Input for take-profit and stop-loss
takeProfitPercent = input.float(0.5, title="Take Profit (%)", step=0.1) / 100
stopLossPercent = input.float(0.25, title="Stop Loss (%)", step=0.1) / 100


macdFastLength = input.int(12, title="MACD Fast Length")
macdSlowLength = input.int(26, title="MACD Slow Length")
macdSignalLength = input.int(9, title="MACD Signal Length")


rsiLength = input.int(14, title="RSI Length")
rsiOverbought = input.int(70, title="RSI Overbought Level", step=1)
rsiOversold = input.int(30, title="RSI Oversold Level", step=1)


vwap = ta.vwap(close)


[macdLine, signalLine, _] = ta.macd(close, macdFastLength, macdSlowLength, macdSignalLength)
macdHistogram = macdLine - signalLine

rsi = ta.rsi(close, rsiLength)


plot(vwap, color=color.purple, linewidth=2, title="VWAP")
hline(rsiOverbought, "Overbought", color=color.red, linestyle=hline.style_dotted)
hline(rsiOversold, "Oversold", color=color.green, linestyle=hline.style_dotted)
plot(macdLine, color=color.blue, title="MACD Line")
plot(signalLine, color=color.orange, title="Signal Line")

// Buy Condition
longCondition = ta.crossover(close, vwap) and macdHistogram > 0 and rsi < rsiOverbought

// Sell Condition
shortCondition = ta.crossunder(close, vwap) and macdHistogram < 0 and rsi > rsiOversold

// Execute trades based on conditions
if (longCondition)
    strategy.entry("Long", strategy.long)
    strategy.exit("Take Profit/Stop Loss", "Long", limit=close * (1 + takeProfitPercent), stop=close * (1 - stopLossPercent))

if (shortCondition)
    strategy.entry("Short", strategy.short)
    strategy.exit("Take Profit/Stop Loss", "Short", limit=close * (1 - takeProfitPercent), stop=close * (1 + stopLossPercent))

// Plot Buy/Sell Signals
plotshape(series=longCondition, location=location.belowbar, color=color.green, style=shape.labelup, title="Buy Signal")
plotshape(series=shortCondition, location=location.abovebar, color=color.red, style=shape.labeldown, title="Sell Signal")
- Strategi Perdagangan Crossover Multi-EMA dengan Penunjuk Momentum
- Strategi Kecerdasan Pembalikan Trend Multi-Indikator yang Ditingkatkan
- Trend Indikator Multi-Teknik Berikutan Strategi Dagangan
- Strategi Dagangan Momentum Crossover Multi-Indikator dengan Sistem Amalan Keuntungan dan Hentikan Kerugian yang Dioptimumkan
- Trend Multi-Indikator Berikutan Pilihan Perdagangan EMA Cross Strategy
- Sistem Dagangan Mengikut Trend Multi-Timeframe dengan Integrasi ATR dan MACD
- Sistem Analisis Strategi Anomali Jumaat Emas Berbilang Dimensi
- Strategi DCA dinamik berasaskan jumlah
- Strategi Pembalikan Titik RSI Rendah
- Strategi Dagangan berasaskan RSI dengan mengambil keuntungan berasaskan peratusan dan menghentikan kerugian
- Strategi Pengecualian Standar Berganda Bollinger Bands Momentum Breakout
- Retracement Fibonacci Jangka Masa Lanjutan dengan Sistem Dagangan Breakout Tinggi-Rendah
- RSI Strategi Dagangan Momentum Tahap Keluar Dinamik
- Pengesanan trend silang pelbagai penunjuk dan strategi dagangan adaptif gabungan jumlah-harga
- Pergerakan purata berganda yang maju mengikut trend sistem dagangan
- Strategi Pengambilan Keuntungan yang Berkualiti
- Trend Pelbagai Jangka Masa Mengikut Strategi dengan Pengurusan Volatiliti ATR
- Sistem Strategi Purata Kos Dinamik Berdasarkan Bollinger Bands dan RSI
- Multi-SMA Support Level False Breakout Strategy dengan Sistem Stop-Loss ATR
- EMA Crossover Strategy dengan Stop Loss dan mengambil Sistem Pengoptimuman Keuntungan
- Triple Moving Average Trend Following and Momentum Integration Strategi Dagangan Kuantitatif
- Z-Score dan Supertrend Berasaskan Strategi Dagangan Dinamis: Sistem Pemindahan Pendek Panjang
- Bollinger Breakout adaptif dengan Sistem Strategi Kuantitatif Purata Bergerak
- Sistem Dagangan Stop-Loss Beradaptasi yang dioptimumkan AI dengan integrasi pelbagai penunjuk teknikal
- Crossover purata bergerak berbilang tempoh dengan sistem analisis jumlah
- Dual Moving Average Momentum Tracking Strategi Kuantitatif
- Strategi Crossover Purata Bergerak Berganda dengan Stop-Loss dan Take-Profit yang Sesuai
- Trend penyesuaian Mengikut Strategi Berdasarkan Osilator Momentum
- PVT-EMA Trend Crossover Volume-Price Strategi
- Sistem Dagangan Kuantitatif Multi-Periode Dynamic Crossover MACD-EMA