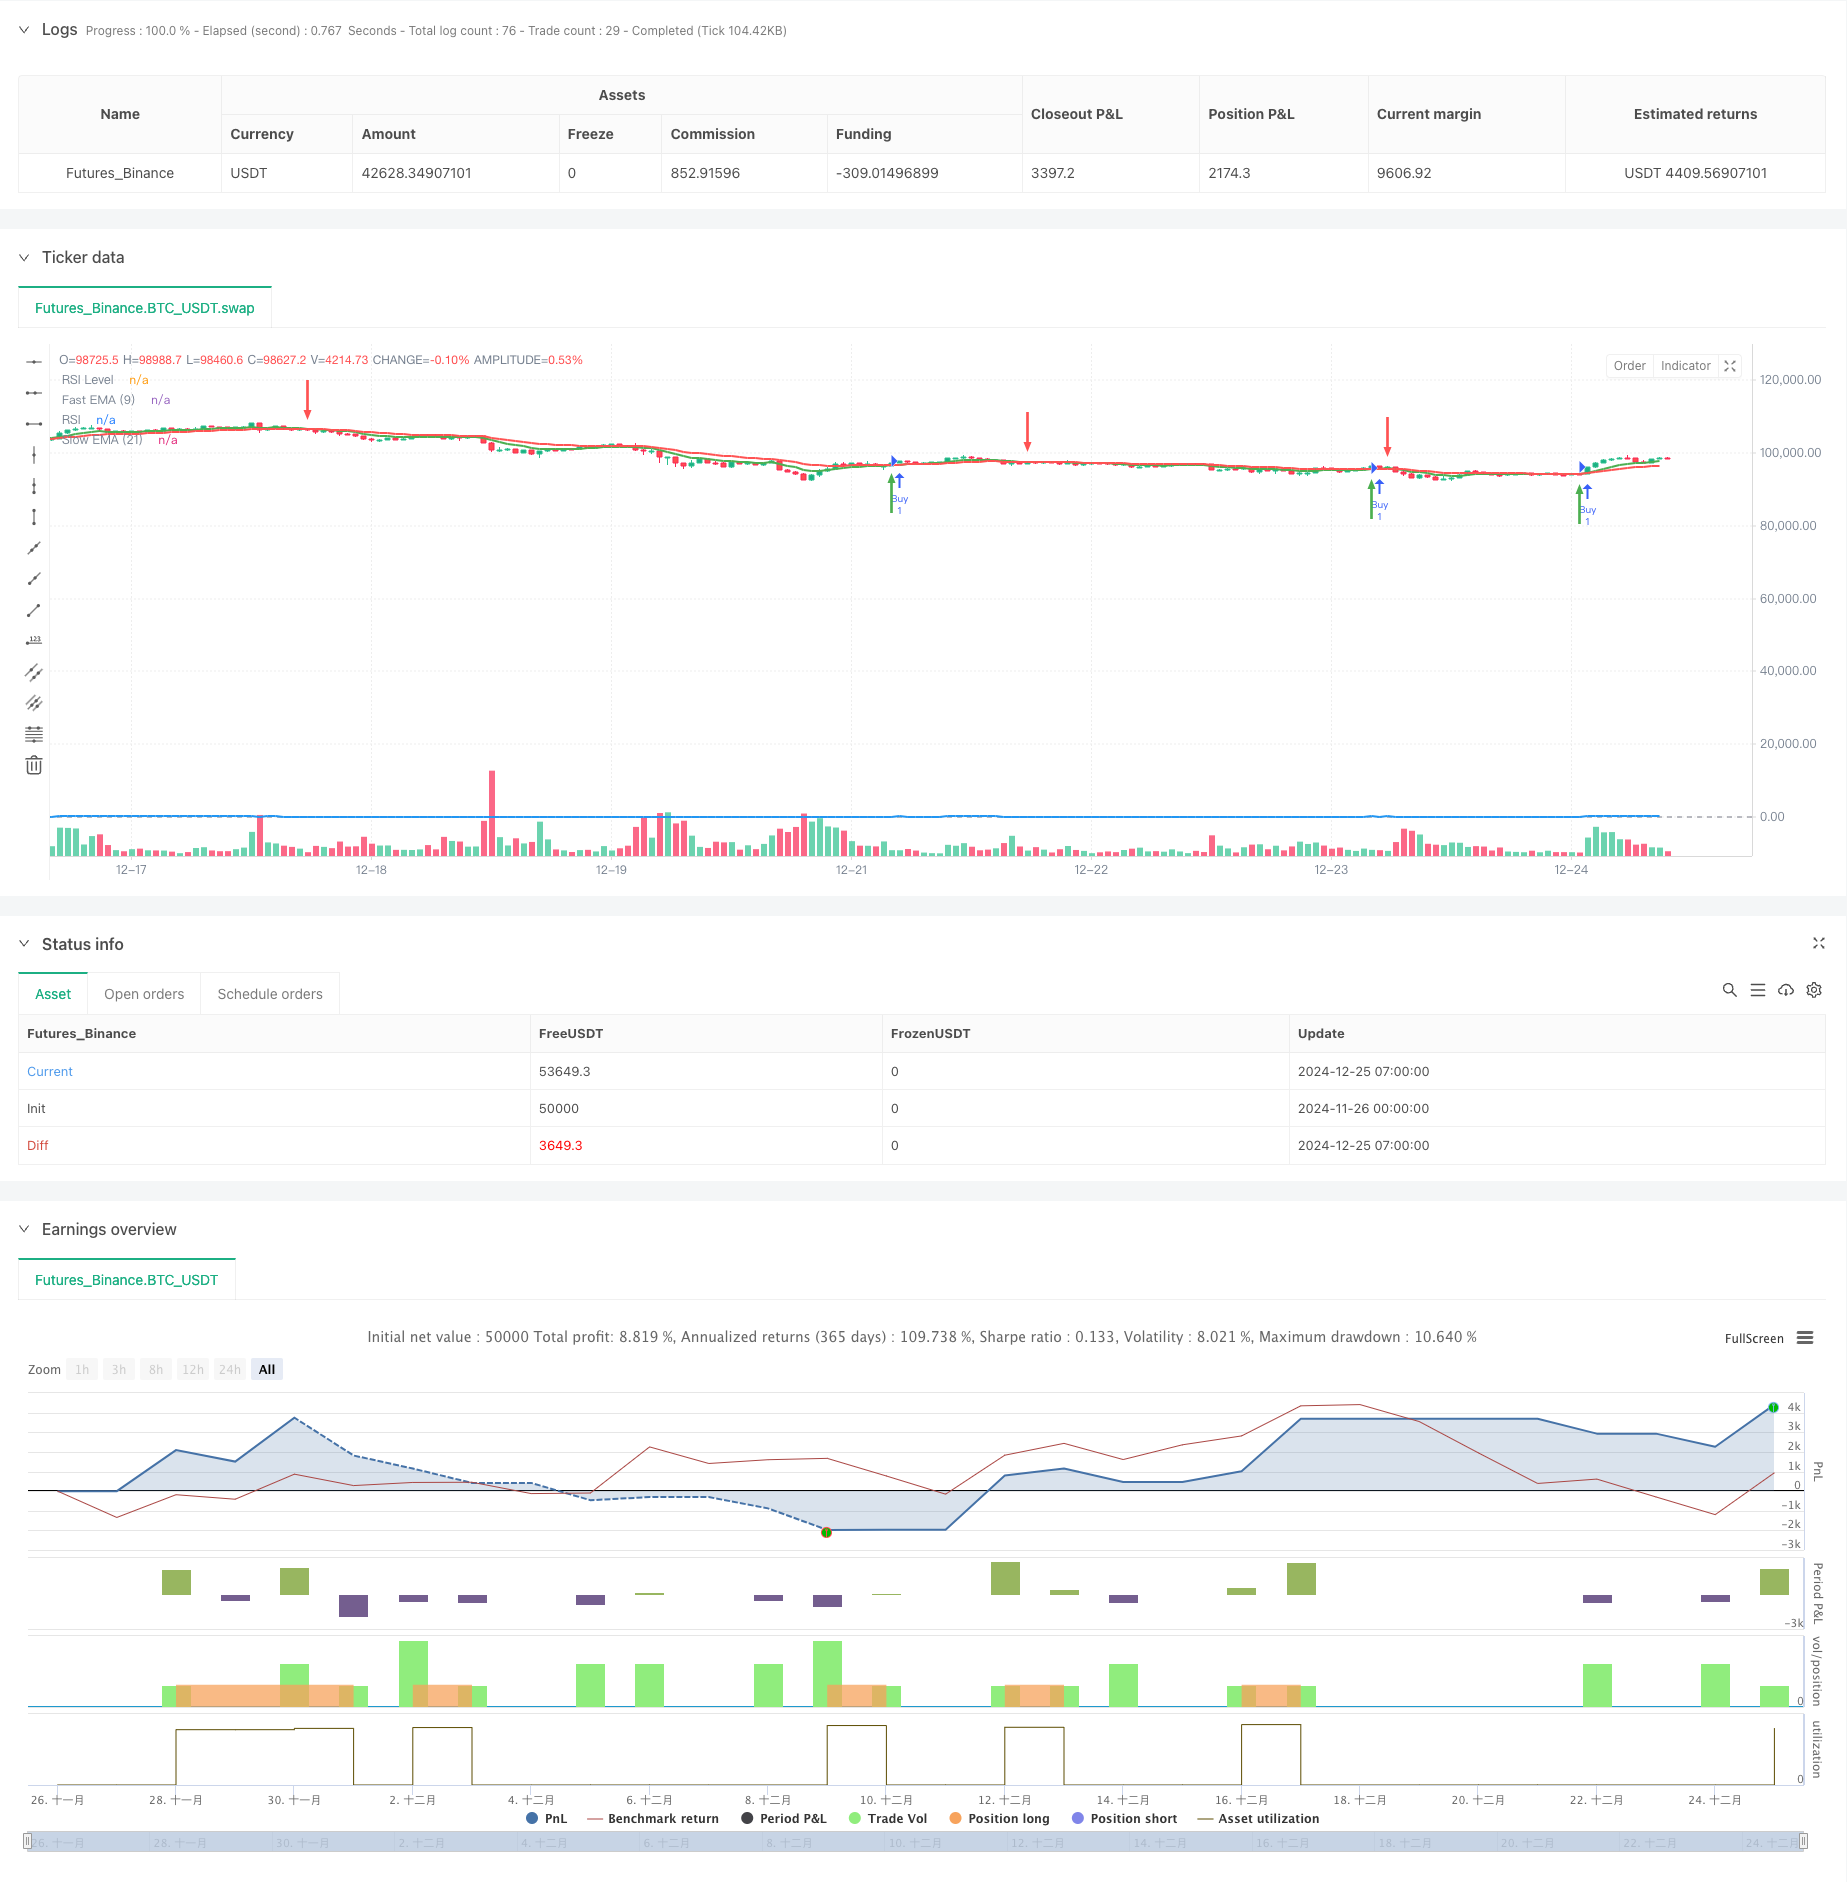
Gambaran keseluruhan
Strategi ini adalah sistem perdagangan berbalik arah yang menggabungkan purata bergerak indeks ((EMA) dan penunjuk yang agak lemah ((RSI)). Melalui isyarat silang 9 kitaran dan 21 kitaran EMA, pengesahan penembusan RSI pada tahap 50, memberikan peniaga dengan titik perubahan trend yang tepat. Sistem ini direka bentuk mekanisme kawalan risiko yang lengkap, termasuk nisbah stop loss tetap, yang dapat mengawal pengunduran secara berkesan.
Prinsip Strategi
Logik teras strategi ini adalah berdasarkan persilangan EMA cepat (siklus 9) dengan EMA perlahan (siklus 21) dan menggunakan indikator RSI untuk pengesahan momentum. Apabila EMA cepat naik melalui EMA perlahan, dan RSI lebih besar daripada 50, sistem mengeluarkan banyak isyarat; apabila EMA cepat turun melalui EMA perlahan, dan RSI lebih kecil daripada 50, sistem mengeluarkan isyarat kedudukan rata.
Kelebihan Strategik
- Mekanisme pengesahan dua: pengesahan EMA dan pengesahan RSI digabungkan untuk mengurangkan kemungkinan isyarat palsu
- Visual yang jelas: menggunakan anak panah hijau dan merah untuk menandakan titik jual beli, isyarat dagangan jelas
- Pengurusan risiko yang sempurna: fungsi henti-henti terbina dalam yang dapat menyesuaikan nisbah risiko-keuntungan secara fleksibel mengikut turun naik pasaran
- Kebolehsuaian: parameter teras boleh disesuaikan untuk menyesuaikan diri dengan keadaan pasaran dan jenis perdagangan yang berbeza
- Kesederhanaan pelaksanaan: Peraturan perdagangan jelas, sesuai untuk pelaksanaan sistem perdagangan automatik
Risiko Strategik
- Pasaran horizontal kurang berkesan: Isyarat palsu mungkin berlaku dalam keadaan bergolak
- Risiko ketinggalan: purata bergerak mempunyai ketinggalan dan mungkin terlepas peluang masuk yang terbaik
- Kesalahan RSI: Dalam keadaan yang melampau, RSI mungkin menghasilkan isyarat yang salah
- Sensitiviti parameter: keadaan pasaran yang berbeza mungkin memerlukan penyesuaian parameter, meningkatkan kos penyelenggaraan strategi Penyelesaian: Disyorkan untuk digunakan dalam keadaan pasaran yang jelas trend, boleh menyaring kadar turun naik dengan menambah indikator ATR, dan digabungkan dengan penilaian trend jangka masa yang lebih lama.
Arah pengoptimuman strategi
- Memperkenalkan penapis turun naik: disyorkan untuk menambah indikator ATR dan menghentikan perdagangan dalam persekitaran turun naik yang rendah
- Mengoptimumkan hentian hentian: boleh dipertimbangkan untuk menggunakan hentian dinamik, seperti hentian pengesanan atau tetapan hentian berdasarkan ATR
- Menambah penapis kekuatan trend: boleh memperkenalkan indikator trend yang lebih lama, hanya berdagang ke arah trend utama
- Pengesahan jumlah transaksi yang lebih baik: disyorkan untuk menambah analisis jumlah transaksi untuk meningkatkan kebolehpercayaan isyarat
- Klasifikasi persekitaran pasaran: parameter yang boleh disesuaikan dengan dinamik persekitaran pasaran yang berbeza untuk meningkatkan kebolehpasaran strategi
ringkaskan
Strategi ini, dengan menggabungkan EMA silang dan pengesahan momentum RSI, membina sistem pengesanan trend yang mantap. Mekanisme kawalan risiko yang sempurna dan antara muka visual yang jelas menjadikannya sangat praktikal. Walaupun persembahan agak kurang dalam pasaran melintang, prestasi keseluruhan strategi ini dijangka meningkat lagi dengan arah pengoptimuman yang disyorkan.
/*backtest
start: 2024-11-26 00:00:00
end: 2024-12-25 08:00:00
period: 1h
basePeriod: 1h
exchanges: [{"eid":"Futures_Binance","currency":"BTC_USDT"}]
*/

//@version=5
strategy("EMA Crossover with RSI Confirmation and Buy/Sell Signals", overlay=true)

// Input for EMAs and RSI
fastLength = input.int(9, title="Fast EMA Length")
slowLength = input.int(21, title="Slow EMA Length")
rsiLength = input.int(14, title="RSI Length")
rsiLevel = input.int(50, title="RSI Level", minval=0, maxval=100)

// Calculate the EMAs and RSI
fastEMA = ta.ema(close, fastLength)
slowEMA = ta.ema(close, slowLength)
rsi = ta.rsi(close, rsiLength)

// Plot the EMAs on the chart
plot(fastEMA, color=color.green, linewidth=2, title="Fast EMA (9)")
plot(slowEMA, color=color.red, linewidth=2, title="Slow EMA (21)")

// Plot the RSI on a separate pane (below the chart)
hline(rsiLevel, "RSI Level", color=color.gray)
plot(rsi, color=color.blue, linewidth=2, title="RSI")

// Buy condition: Fast EMA crosses above Slow EMA and RSI crosses above 50
buyCondition = ta.crossover(fastEMA, slowEMA) and rsi > rsiLevel

// Sell condition: Fast EMA crosses below Slow EMA and RSI crosses below 50
sellCondition = ta.crossunder(fastEMA, slowEMA) and rsi < rsiLevel

// Execute trades based on conditions
if (buyCondition)
    strategy.entry("Buy", strategy.long)
    label.new(bar_index, low, "Buy", color=color.green, textcolor=color.white, style=label.style_label_up, size=size.small)

if (sellCondition)
    strategy.close("Buy")
    label.new(bar_index, high, "Sell", color=color.red, textcolor=color.white, style=label.style_label_down, size=size.small)

// Strategy exit (optional): Fixed risk-to-reward ratio (take profit and stop loss)
takeProfit = input.int(2, title="Take Profit (Risk-Reward)", minval=1)
stopLoss = input.int(1, title="Stop Loss (Risk-Reward)", minval=1)

strategy.exit("Exit Buy", "Buy", stop=close * (1 - stopLoss / 100), limit=close * (1 + takeProfit / 100))

// Plot buy/sell arrows for visualization
plotarrow(buyCondition ? 1 : na, offset=-1, colorup=color.green, maxheight=30, title="Buy Signal Arrow")
plotarrow(sellCondition ? -1 : na, offset=-1, colordown=color.red, maxheight=30, title="Sell Signal Arrow")