Estratégia de ruptura da volatilidade inversa
Autora:ChaoZhang, Data: 2024-05-17 15:18:53Tags:ATRBBRSIMACD

Resumo
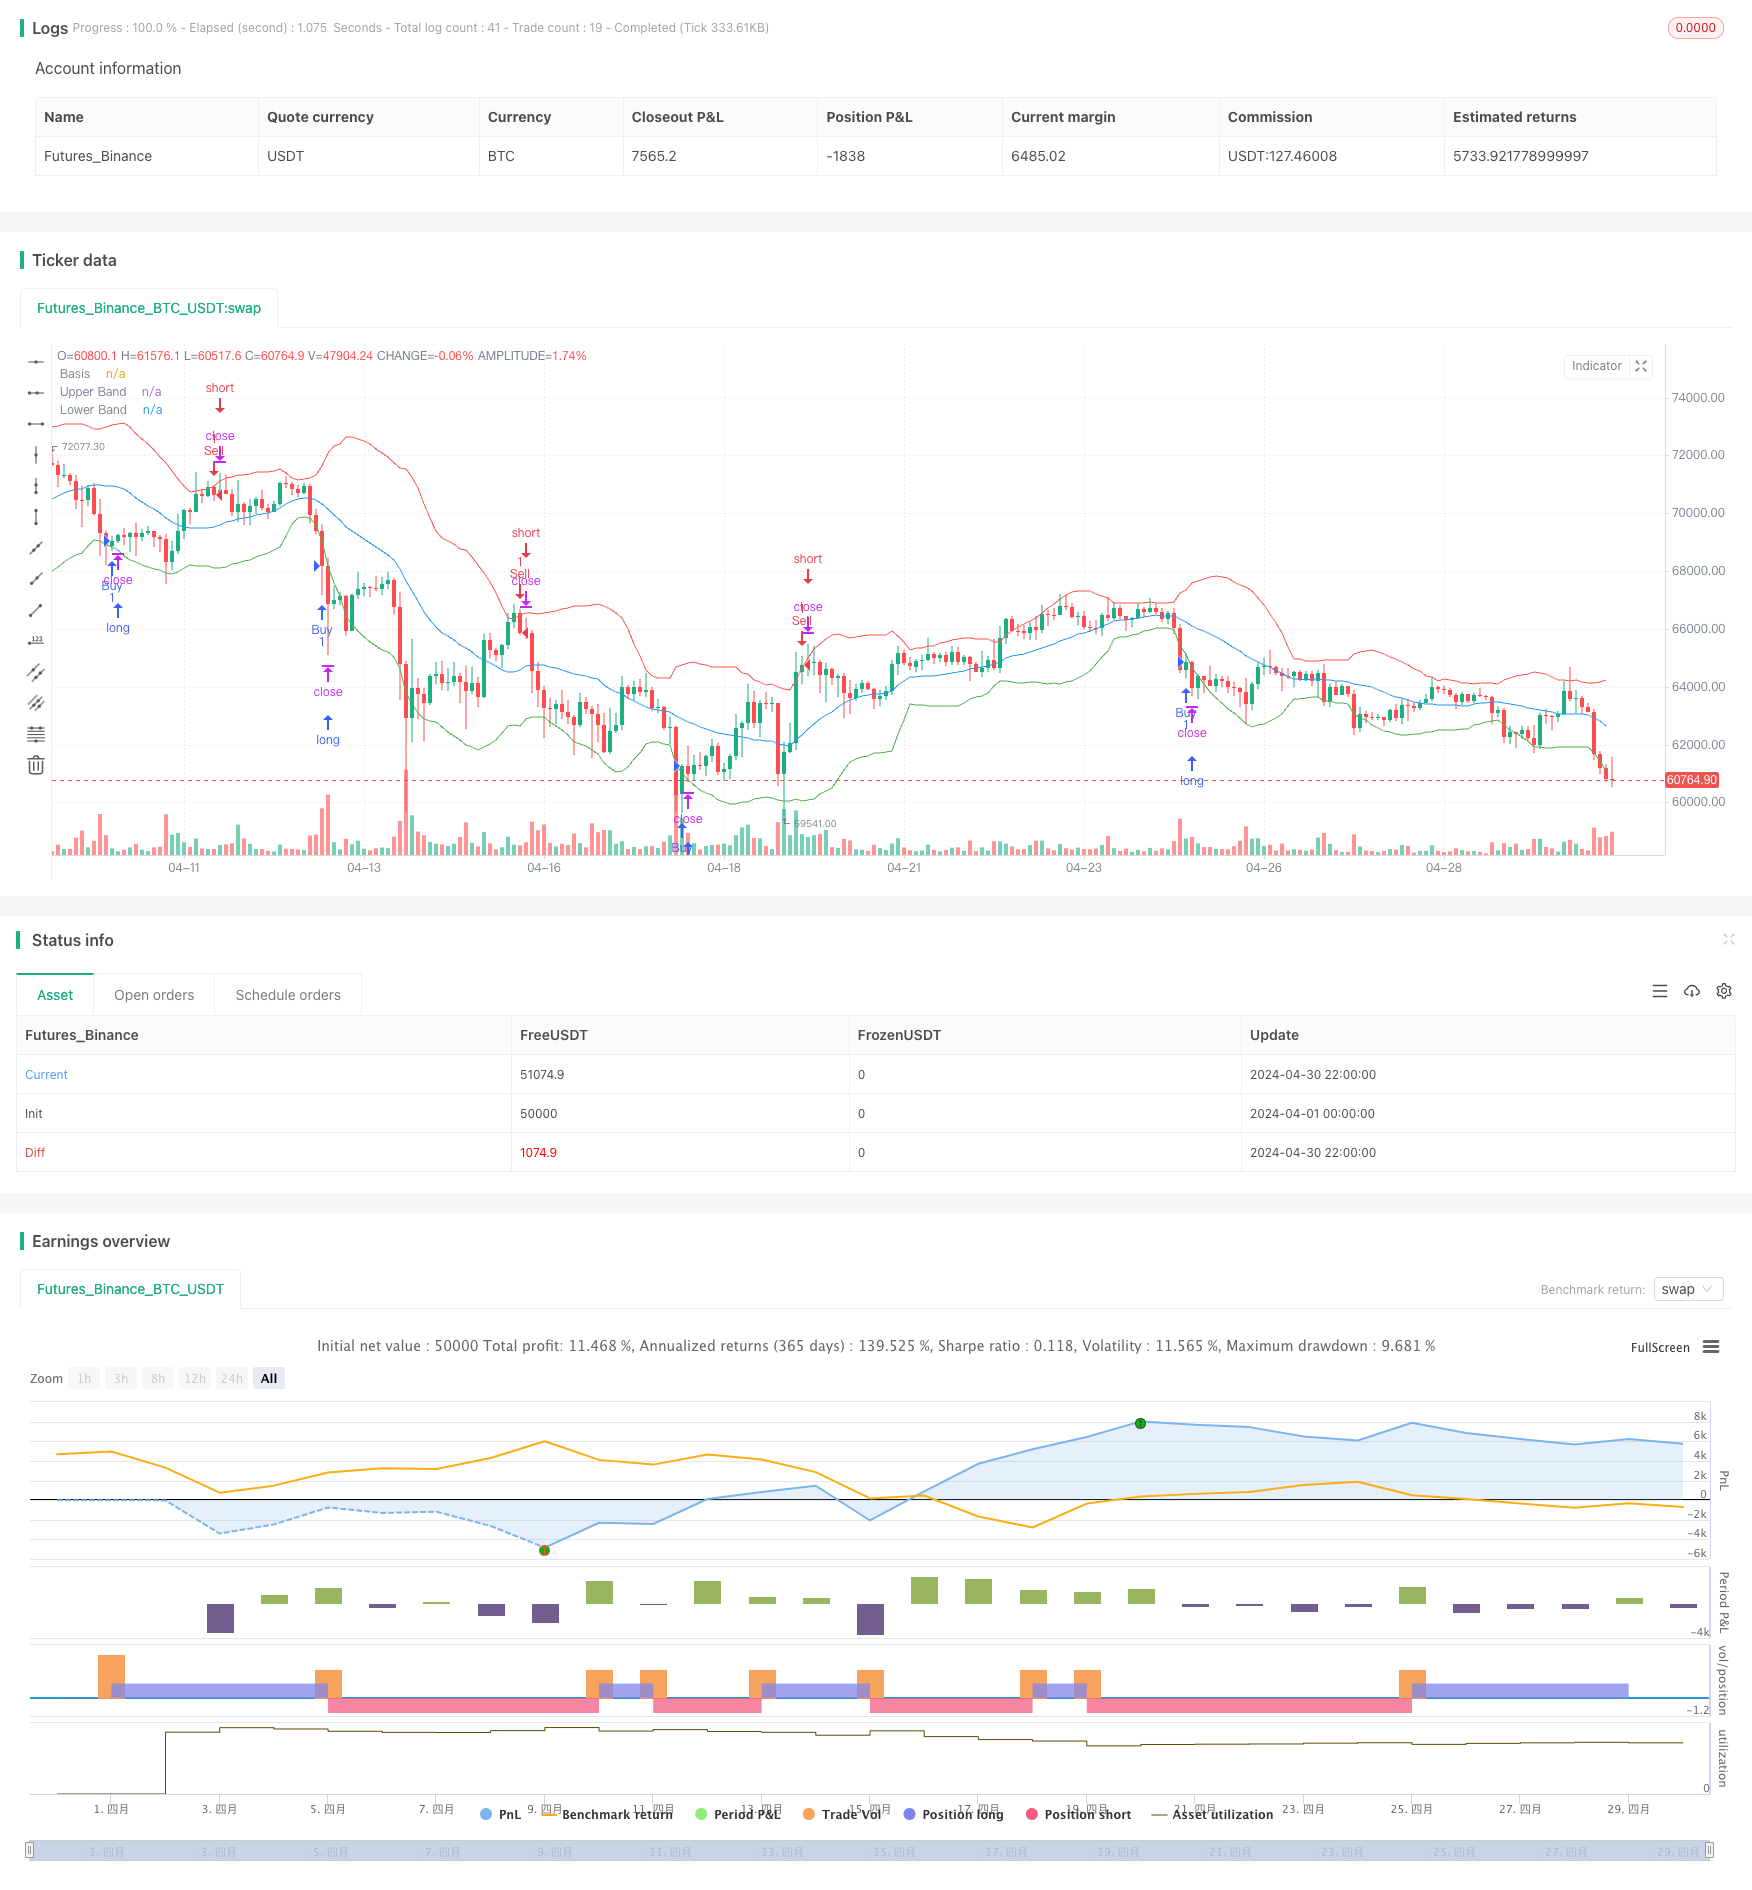
A Estratégia de Breakout de Volatilidade Reversa é uma estratégia de negociação de reversão que utiliza vários indicadores técnicos, como ATR, Bollinger Bands, RSI e MACD, para identificar condições extremas de mercado e executar negócios quando aparecem sinais de reversão.
Princípio da estratégia
A estratégia utiliza os seguintes indicadores para determinar os sinais de negociação:
- ATR (Average True Range): mede a volatilidade do mercado.
- Bandas de Bollinger: Consistem numa banda média, uma banda superior e uma banda inferior, refletindo a faixa de volatilidade dos preços.
- RSI (Relative Strength Index): mede a dinâmica dos movimentos de preços.
- MACD (Moving Average Convergence Divergence): Consiste de uma linha MACD e uma linha de sinal, utilizadas para determinar tendências.
A lógica central da estratégia é a seguinte:
- Quando o preço de fechamento ultrapassa a banda superior de Bollinger, o RSI está acima de 50 e a linha MACD está acima da linha de sinal, é gerado um sinal de venda.
- Quando o preço de fechamento ultrapassa a faixa inferior de Bollinger, o RSI está abaixo de 50 e a linha MACD está abaixo da linha de sinal, um sinal de compra é gerado.
Vantagens da estratégia
- Combina vários indicadores técnicos para melhorar a fiabilidade dos sinais de negociação.
- A abordagem de negociação reversa pode lucrar quando o mercado se inverte.
- Adequado para condições de mercado altamente voláteis.
Riscos estratégicos
- O reverse trading pode enfrentar riscos mais elevados, uma vez que vai contra a tendência dominante.
- Se o mercado continuar numa tendência unilateral, a estratégia pode gerar perdas consecutivas.
- A configuração incorreta dos parâmetros pode conduzir a sinais comerciais inválidos.
Orientações para a otimização da estratégia
- Otimizar os parâmetros dos indicadores para encontrar a combinação mais adequada para o mercado actual.
- Introduzir mecanismos de stop-loss e take-profit para controlar o risco do single trade.
- Incorporar outros indicadores ou dados de sentimento de mercado para melhorar a precisão dos sinais de negociação.
- Filtrar sinais de negociação para evitar negociações frequentes e sinais falsos.
Resumo
A estratégia de ruptura de volatilidade reversa é uma tentativa interessante que utiliza múltiplos indicadores técnicos para capturar condições extremas de mercado e executar negócios reversos quando aparecem sinais de reversão. No entanto, esta estratégia também carrega certos riscos e precisa ser aplicada com cautela.
/*backtest
start: 2024-04-01 00:00:00
end: 2024-04-30 23:59:59
period: 2h
basePeriod: 15m
exchanges: [{"eid":"Futures_Binance","currency":"BTC_USDT"}]
*/

//@version=5
strategy("Volatility Breakout Strategy (Reversed)", overlay=true)

// Indicator Inputs
atrLength = input(14, "ATR Length")
bbLength = input(20, "Bollinger Bands Length")
bbMultiplier = input(2, "Bollinger Bands Multiplier")
rsiLength = input(14, "RSI Length")
macdShortLength = input(12, "MACD Short Length")
macdLongLength = input(26, "MACD Long Length")
macdSignalSmoothing = input(9, "MACD Signal Smoothing")

// Calculate Indicators
atrValue = ta.atr(atrLength)
basis = ta.sma(close, bbLength)
deviation = bbMultiplier * ta.stdev(close, bbLength)
upperBand = basis + deviation
lowerBand = basis - deviation
rsiValue = ta.rsi(close, rsiLength)
[macdLine, signalLine, _] = ta.macd(close, macdShortLength, macdLongLength, macdSignalSmoothing)

// Strategy Conditions (Reversed)
longCondition = ta.crossover(close[1], upperBand[1]) and rsiValue > 50 and macdLine > signalLine
shortCondition = ta.crossunder(close[1], lowerBand[1]) and rsiValue < 50 and macdLine < signalLine

// Strategy Entry (Reversed)
if (longCondition)
    strategy.entry("Sell", strategy.short)  // Reversed: Buy signal triggers a sell
if (shortCondition)
    strategy.entry("Buy", strategy.long)  // Reversed: Sell signal triggers a buy

// Plotting
plot(basis, color=color.blue, title="Basis")
plot(upperBand, color=color.red, title="Upper Band")
plot(lowerBand, color=color.green, title="Lower Band")
Relacionados
- O valor da posição em risco deve ser calculado de acordo com o método de cálculo da posição em risco, de acordo com o método de cálculo da posição em risco.
- Estratégia de cruzamento de impulso multi-tendência com sistema de otimização de volatilidade
- Não há estratégia de ruptura de vela alta
- Estratégia de negociação de tendência de stop-loss dinâmico de múltiplos indicadores
- Estratégia de integração das bandas RSI-Bollinger: um sistema de negociação multi-indicador dinâmico e auto-adaptável
- Estratégia de pirâmide inteligente de múltiplos indicadores
- Estratégia de negociação de tendência de oscilação adaptativa com bandas de Bollinger e integração do RSI
- Indicador Super Triple RSI-MACD-BB Estratégia de inversão do ímpeto
- O valor da posição em risco deve ser calculado de acordo com o método de classificação da posição em risco, de acordo com o método de classificação da posição em risco.
- Reversão dinâmica da média e estratégia de impulso
Mais.
- Estratégia de negociação de tendência dinâmica
- Crossover da EMA com a estratégia de sinais de curto prazo
- Ichimoku Cloud e estratégia ATR
- BONK Estratégia de negociação multifator
- Estratégia de cruzamento de média móvel dupla
- HalfTrend Tendência de alta e baixa após a estratégia de compra stop-limit
- Tendência a longo prazo do Alligator na sequência da estratégia de negociação
- Estratégia de acompanhamento de tendências de vários prazos baseada no Impulse MACD e no crossover de médias móveis duplas
- Estratégia de cruzamento do EMA5 e do EMA13
- EMA SAR Tendência a médio e longo prazo Seguindo a estratégia
- Estratégia de ruptura da faixa de abertura de 3 minutos da Nifty 50
- Estratégia dinâmica de stop loss e take profit Bollinger Bands
- Estratégia de ruptura Swing High/Low melhorada com padrões de engulfamento de alta e baixa
- Laguerre RSI com estratégia de sinais de negociação filtrados ADX
- Estratégia de compra de ruptura de preço e volume
- K Velas consecutivas Estratégia Bull Bear
- Estratégia de cruzamento de média super movel e banda superior
- Tendência multifatorial após estratégia quantitativa de negociação baseada no RSI, ADX e Ichimoku Cloud
- RSI e MACD estratégia combinada de curto e longo prazo
- Nuvem de Ichimoku e estratégia de média móvel