رجحان الٹ ٹریڈنگ حکمت عملی RSI تغیر پر مبنی
مصنف:چاؤ ژانگ، تاریخ: 2024-05-28 11:51:49ٹیگز:آر ایس آئی
جائزہ
یہ تجارتی حکمت عملی رشتہ دار طاقت انڈیکس (آر ایس آئی) اور قیمت کی نقل و حرکت کے مابین فرق پر مبنی ہے ، جس کا مقصد ممکنہ رجحان الٹ کے مواقع کو حاصل کرنا ہے۔ یہ حکمت عملی تیزی اور bearish دونوں اختلافات کا پتہ لگاتی ہے اور اس کے مطابق خرید و فروخت کے سگنل پیدا کرتی ہے۔ جب آر ایس آئی اور قیمت کے مابین فرق ہوتا ہے تو ، اس سے یہ ظاہر ہوتا ہے کہ موجودہ رجحان الٹ جانے کے قریب ہوسکتا ہے ، جس سے تاجروں کو ممکنہ تجارتی مواقع ملتے ہیں۔
حکمت عملی کے اصول
- ایک مخصوص مدت کے لئے RSI اشارے کا حساب لگائیں.
- قیمت اور آر ایس آئی کی نقل و حرکت کا موازنہ کرکے ایک خاص نظرثانی کی مدت میں تیزی یا bearish انحراف کی موجودگی کا تعین کریں۔
- بولش تغیر: قیمت ایک نئی نچلی سطح پر پہنچ جاتی ہے، لیکن آر ایس آئی نئی نچلی سطح تک پہنچنے میں ناکام رہتا ہے، جو بڑھتی ہوئی رفتار کو ظاہر کرتا ہے۔
- bearish divergence: قیمت ایک نئی اونچائی بناتی ہے، لیکن RSI ایک نئی اونچائی بنانے میں ناکام رہتا ہے، جو نیچے کی رفتار کو جمع کرنے کی نشاندہی کرتا ہے۔
- خریدنے کا اشارہ بنائیں جب تیزی سے انحراف کا پتہ چلتا ہے اور آر ایس آئی oversold threshold سے تجاوز کرتا ہے۔
- فروخت کا اشارہ پیدا کریں جب bearish divergence کا پتہ چلتا ہے اور RSI overbought threshold سے نیچے عبور کرتا ہے۔
حکمت عملی کے فوائد
- رجحان کی تبدیلیوں کو پکڑنا: آر ایس آئی اور قیمت کے مابین اختلافات کی نشاندہی کرکے ، حکمت عملی رجحان کی تبدیلی کے عمل میں ابتدائی طور پر تجارتی سگنل پیدا کرسکتی ہے ، جس سے تاجروں کو اپنے آپ کو منحنی خطوط سے آگے رکھنے کے مواقع ملتے ہیں۔
- سادگی اور استعمال میں آسانی: یہ حکمت عملی کلاسیکی آر ایس آئی اشارے پر مبنی ہے ، جس کا حساب لگانا آسان ہے اور اس کے پیرامیٹرز کو سمجھنا اور ایڈجسٹ کرنا آسان ہے ، جس سے یہ مختلف قسم کے تاجروں کے لئے موزوں ہے۔
- متعدد منڈیوں پر اطلاق: آر ایس آئی کے اختلاف کی حکمت عملی کو مختلف مالیاتی منڈیوں جیسے اسٹاک ، فیوچر اور فاریکس پر لاگو کیا جاسکتا ہے ، جس سے اس کی وسیع اطلاق ظاہر ہوتی ہے۔
حکمت عملی کے خطرات
- جھوٹے سگنل: تمام آر ایس آئی اختلافات اصل رجحان کی تبدیلی کا باعث نہیں بنتے ، اور جھوٹے سگنل ہوسکتے ہیں ، جس کے نتیجے میں تجارتی نقصانات ہوتے ہیں۔
- پسماندہ نوعیت: آر ایس آئی اختلافات اکثر رجحان کی تبدیلی کے ابتدائی مراحل میں ہوتے ہیں ، لیکن تمام اختلافات کے اشارے فوری طور پر رجحان کی تبدیلی کو متحرک نہیں کرتے ہیں ، جس سے ممکنہ طور پر ایک خاص حد تک تاخیر ہوتی ہے۔
- پیرامیٹر حساسیت: حکمت عملی کی کارکردگی پیرامیٹرز جیسے RSI حساب کی مدت اور overbought / oversold thresholds کے لئے حساس ہوسکتی ہے ، اور پیرامیٹرز کی مختلف ترتیبات کے نتیجے میں مختلف تجارتی نتائج ہوسکتے ہیں۔
حکمت عملی کی اصلاح کی ہدایات
- دوسرے اشارے کے ساتھ مل کر: سگنل کی تصدیق کی وشوسنییتا کو بہتر بنانے کے لئے آر ایس آئی کی تغیر کی حکمت عملی کو دوسرے تکنیکی اشارے (جیسے ، حرکت پذیر اوسط ، ایم اے سی ڈی) کے ساتھ مربوط کریں۔
- متحرک پیرامیٹر ایڈجسٹمنٹ: مختلف مارکیٹ کے ماحول کو اپنانے کے لئے مارکیٹ کے حالات اور اثاثوں کی خصوصیات کی بنیاد پر متحرک طور پر پیرامیٹرز جیسے RSI حساب کی مدت اور overbought / oversold thresholds کو ایڈجسٹ کریں.
- خطرے کے انتظام کو شامل کرنا: انفرادی تجارتی خطرے پر قابو پانے اور خطرے سے متعلق واپسی کو بہتر بنانے کے لئے اسٹاپ نقصان اور منافع لینے کے طریقہ کار کو حکمت عملی میں شامل کرنا۔
- ملٹی ٹائم فریم تجزیہ: مختلف سطحوں پر رجحان کی تبدیلی کے مواقع کو پکڑنے کے لئے مختلف ٹائم فریموں (مثال کے طور پر، روزانہ، 4 گھنٹے) پر RSI اختلافات کا تجزیہ کریں.
خلاصہ
آر ایس آئی تغیر پر مبنی رجحان الٹ ٹریڈنگ حکمت عملی کا مقصد آر ایس آئی اشارے اور قیمت کی نقل و حرکت کے مابین اختلافات کی نشاندہی کرکے ممکنہ رجحان الٹ کے مواقع کو حاصل کرنا ہے۔ یہ حکمت عملی استعمال میں آسان ہے اور متعدد مالیاتی منڈیوں پر لاگو ہوتی ہے۔ تاہم ، تاجروں کو غلط سگنل ، پسماندہ نوعیت ، اور پیرامیٹر حساسیت جیسے خطرات سے آگاہ ہونے کی ضرورت ہے۔ دوسرے اشارے ، متحرک طور پر پیرامیٹرز کو ایڈجسٹ کرنے ، رسک مینجمنٹ کو شامل کرنے ، اور کثیر ٹائم فریم تجزیہ کرنے کے ساتھ مل کر ، حکمت عملی کی استحکام اور منافع کی صلاحیت کو مزید بڑھا سکتے ہیں۔
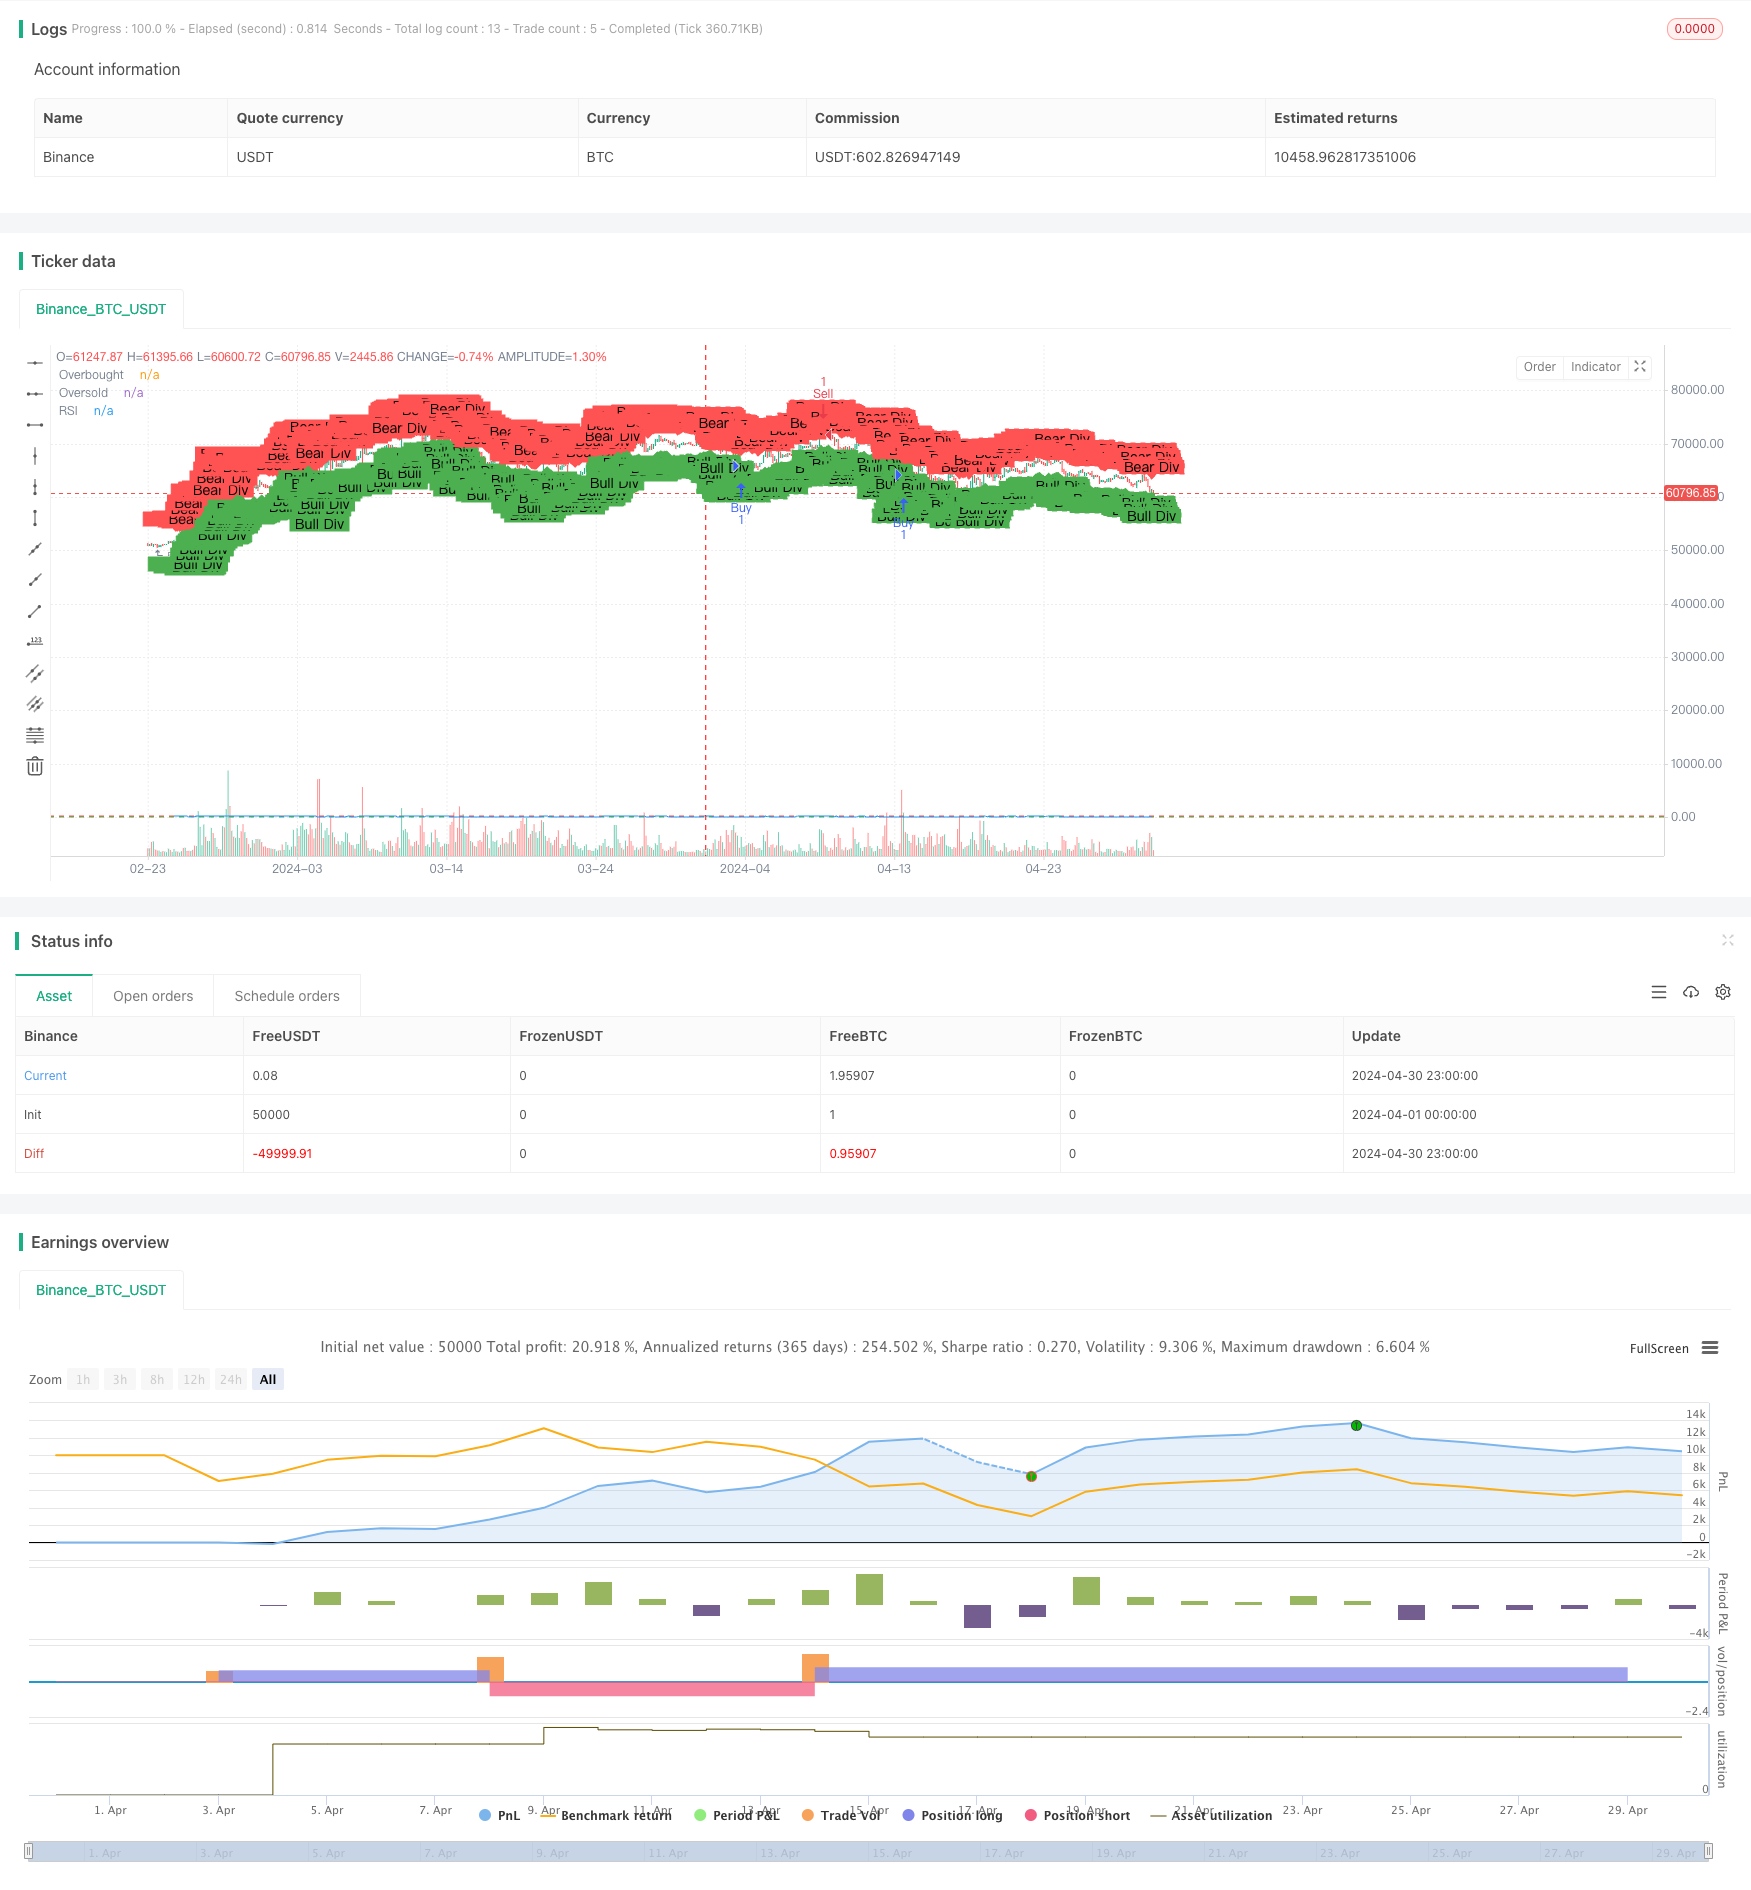
/*backtest
start: 2024-04-01 00:00:00
end: 2024-04-30 23:59:59
period: 3h
basePeriod: 15m
exchanges: [{"eid":"Binance","currency":"BTC_USDT"}]
*/

//@version=5
strategy("RSI Divergence Strategy", overlay=true)

// Input parameters
rsiLength = input.int(14, title="RSI Length")
rsiOverbought = input.int(70, title="RSI Overbought Level")
rsiOversold = input.int(30, title="RSI Oversold Level")
lookback = input.int(5, title="Lookback Period for Divergence")

// Calculate RSI
rsi = ta.rsi(close, rsiLength)

// Function to detect bullish divergence
bullishDivergence(price, rsi, lookback) =>
    var bool bullDiv = false
    for i = 1 to lookback
        if (low[i] < low and rsi[i] > rsi)
            bullDiv := true
    bullDiv

// Function to detect bearish divergence
bearishDivergence(price, rsi, lookback) =>
    var bool bearDiv = false
    for i = 1 to lookback
        if (high[i] > high and rsi[i] < rsi)
            bearDiv := true
    bearDiv

// Detect bullish and bearish divergence
bullDiv = bullishDivergence(close, rsi, lookback)
bearDiv = bearishDivergence(close, rsi, lookback)

// Plot RSI
hline(rsiOverbought, "Overbought", color=color.red)
hline(rsiOversold, "Oversold", color=color.green)
plot(rsi, title="RSI", color=color.blue)

// Generate buy signal on bullish divergence
if (bullDiv and ta.crossover(rsi, rsiOversold))
    strategy.entry("Buy", strategy.long)

// Generate sell signal on bearish divergence
if (bearDiv and ta.crossunder(rsi, rsiOverbought))
    strategy.entry("Sell", strategy.short)

// Plot buy/sell signals on chart
plotshape(series=bullDiv, location=location.belowbar, color=color.green, style=shape.labelup, text="Bull Div")
plotshape(series=bearDiv, location=location.abovebar, color=color.red, style=shape.labeldown, text="Bear Div")
- بولنگر بینڈ اور آر ایس آئی انٹیگریشن کے ساتھ میڈین ریورسشن کی بہتر حکمت عملی
- معاونت/مقاومت کی مقداری تجارتی حکمت عملی کے ساتھ کثیر مدتی RSI تغیر
- متحرک کھپت کنٹرول سسٹم کے ساتھ موافقت پذیر رجحان کی پیروی کی حکمت عملی
- کثیر تکنیکی اشارے کراس ٹرینڈ ٹریکنگ کی حکمت عملی: آر ایس آئی اور اسٹوکاسٹک آر ایس آئی سنرجی ٹریڈنگ سسٹم
- میک ڈی-آر ایس آئی کراس اوور ٹرینڈ بولنگر بینڈس آپٹیمائزیشن سسٹم کے ساتھ حکمت عملی کے بعد
- کثیر اشارے متحرک ٹریڈنگ کی اصلاح کی حکمت عملی
- کثیر اشارے متحرک سٹاپ نقصان رفتار رجحان ٹریڈنگ کی حکمت عملی
- کثیر فلٹر ٹرینڈ توڑ سمارٹ چلتی اوسط ٹریڈنگ کی حکمت عملی
- جی چینل اشارے کے ساتھ متحرک رجحان رفتار کی اصلاح کی حکمت عملی
- ای ایم اے کراس حکمت عملی کے بعد اختیارات کی تجارت کے بعد کثیر اشارے کا رجحان
- RSI-EMA-ATR متعدد اشارے کی اتار چڑھاؤ ٹریڈنگ کی حکمت عملی
- WaveTrend Oscillator Divergence حکمت عملی
- اتار چڑھاؤ اور لکیری رجسٹریشن پر مبنی طویل مدتی مارکیٹ کے نظام کو بہتر بنانے کی حکمت عملی
- ہائبرڈ بائنومل زیڈ اسکور مقداری حکمت عملی
- آر ایس آئی اور ایم اے کے مجموعی حکمت عملی
- ای ایم اے مومنٹم ٹریڈنگ حکمت عملی
- ایف وی جی مومنٹم اسکیلپنگ حکمت عملی
- اے ٹی آر اور ای ایم اے پر مبنی متحرک منافع لینے اور نقصان کو روکنے کی موافقت کی حکمت عملی
- بریک آؤٹ اور فریکوئنسی فلٹر کے ساتھ رجحان کی پیروی (صرف طویل)
- فبونیکی گولڈن ہم آہنگی بریک آؤٹ حکمت عملی
- لکیری رجسٹریشن ڈیلپ پر مبنی متحرک مارکیٹ سسٹم کی شناخت کی حکمت عملی
- ای ایم اے اور ٹرینڈ لائن بریک آؤٹ پر مبنی دوہری حرکت پذیر اوسط آر ایس آئی مومنٹم حکمت عملی
- متحرک پوزیشن مینجمنٹ روزانہ ٹریڈنگ کی حکمت عملی
- بی ٹی سی کے لئے تکنیکی تجارتی حکمت عملی 15 منٹ کا چارٹ
- متحرک پوزیشن سائزنگ قلیل مدتی فاریکس ٹریڈنگ کی حکمت عملی
- اعلی درجے کی 15 منٹ کی چارٹ ٹریڈنگ سگنل کی حکمت عملی
- پی ایس اے آر اور ای ایم اے پر مبنی مقداری تجارتی حکمت عملی
- RSI اور سادہ حرکت پذیر اوسط SMA پر مبنی معیاری انحراف DEV ٹریڈنگ حکمت عملی
- ایم اے، ایس ایم اے ڈبل حرکت پذیر اوسط کراس اوور حکمت عملی
- خطرہ-انعامی تناسب اور تکنیکی تجزیہ پر مبنی بل فلیگ بریک آؤٹ کی حکمت عملی
- ملٹی فیکٹر فیوژن کی حکمت عملی