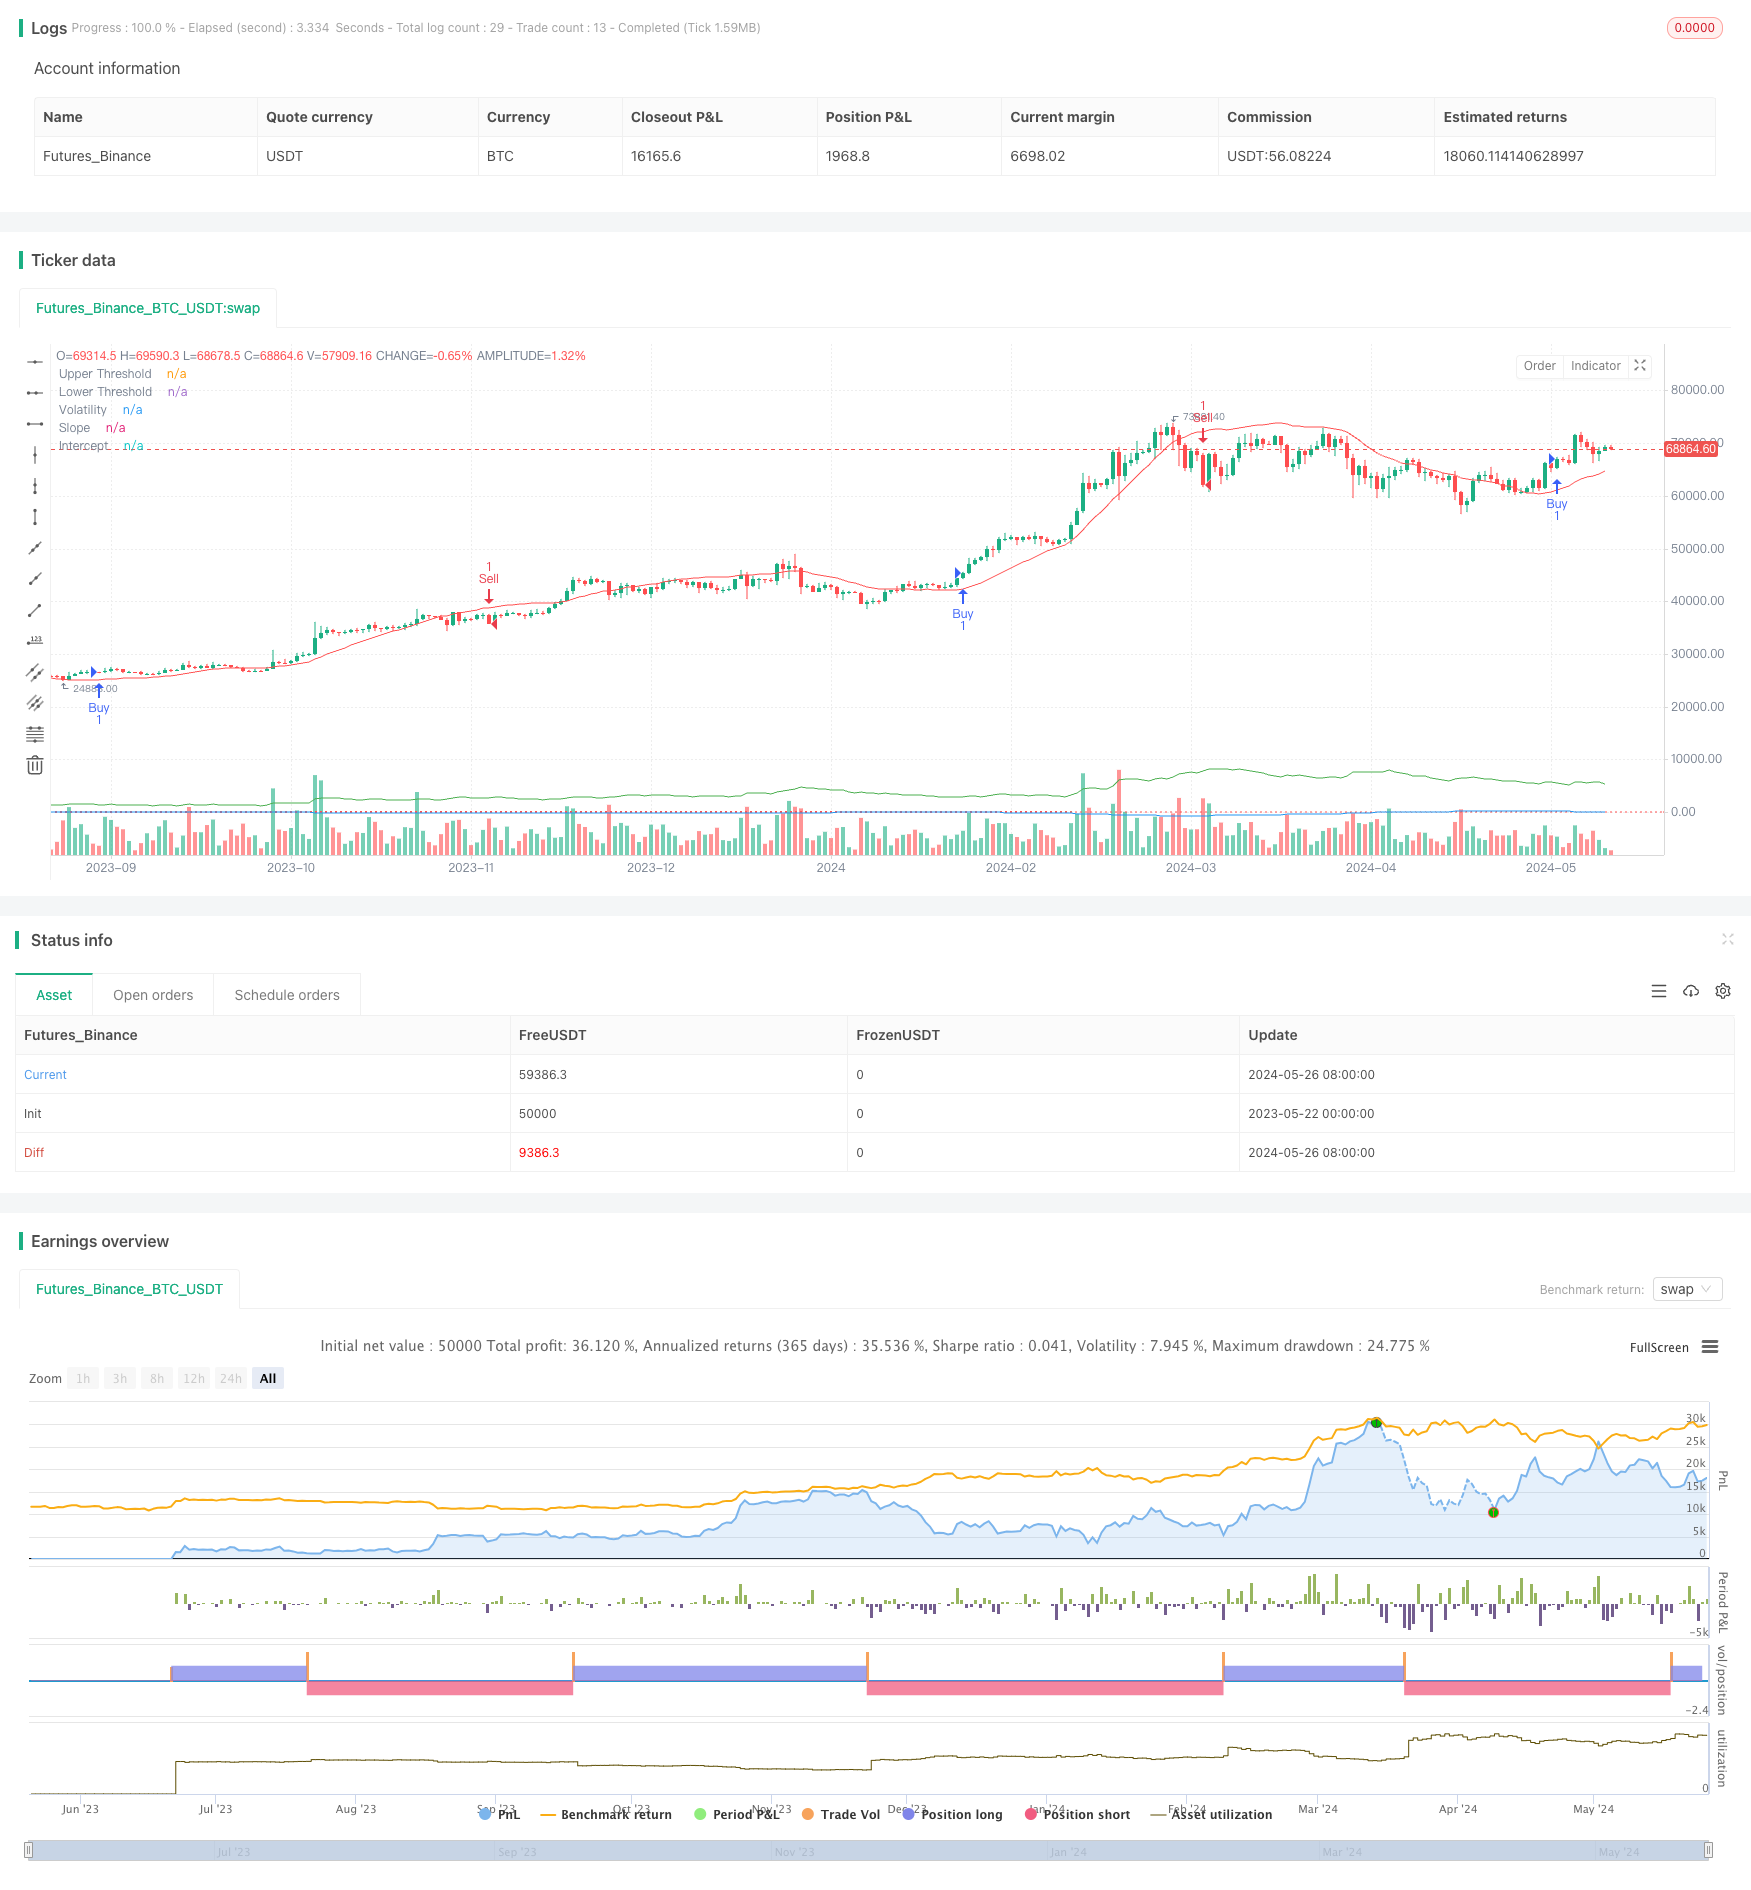
অস্থিরতা এবং লিনিয়ার রিগ্রেশন ভিত্তিক দীর্ঘ-স্বল্পকালীন বাজার ব্যবস্থার অপ্টিমাইজেশান কৌশল
লেখক:চাওঝাং, তারিখঃ ২০২৪-০৫-২৮ ১৭ঃ৪০ঃ৩৭ট্যাগঃএটিআরইএমএ

সারসংক্ষেপ
কৌশলটি বিভিন্ন বাজারের অবস্থা সনাক্ত করতে রৈখিক রিগ্রেশন এবং অস্থিরতা সূচক ব্যবহার করে। যখন কেনা বা বিক্রয়ের শর্ত পূরণ হয়, তখন কৌশলটি সংশ্লিষ্ট দীর্ঘ বা সংক্ষিপ্ত অবস্থান স্থাপন করে। উপরন্তু, কৌশলটি বিভিন্ন বাজারের পরিবেশের সাথে খাপ খাইয়ে নেওয়ার জন্য বাজারের অবস্থার উপর ভিত্তি করে প্যারামিটার অপ্টিমাইজেশন এবং সমন্বয় করার অনুমতি দেয়। কৌশলটি ট্রেডিং সংকেতগুলি নিশ্চিত করার জন্য অতিরিক্ত সূচক হিসাবে এক্সপোনেনশিয়াল মুভিং এভারেজ (ইএমএ) ব্যবহার করে।
কৌশলগত নীতি
- বাজারের প্রবণতা নির্ধারণের জন্য লিনিয়ার রিগ্রেশনের ছেদ এবং ঢাল গণনা করুন।
- গড় সত্যিকারের পরিসীমা (এটিআর) গণনা করা হবে যা ভোল্টেবিলিটি সূচক হিসাবে গুণক দ্বারা গুণিত হবে।
- ক্রয় সংকেত তৈরি করুন যখন ঢালটি উপরের প্রান্তিকের চেয়ে বড় হয় এবং দামটি রিগ্রেশন লাইন প্লাস অস্থিরতার উপরে থাকে।
- বিক্রয় সংকেত তৈরি করুন যখন ঢালটি নীচের প্রান্তিকের চেয়ে কম হয় এবং দামটি রিগ্রেশন লাইনের নিচে বিয়োগ ভোল্টেবিলিটি হয়।
- অতিরিক্ত নিশ্চিতকরণ সূচক হিসেবে দ্রুত এবং ধীর EMA ব্যবহার করুন।
- যখন একটি ক্রয় সংকেত আসে এবং দ্রুত EMA ধীর EMA এর উপরে থাকে তখন একটি দীর্ঘ অবস্থান স্থাপন করুন।
- যখন বিক্রয় সংকেত আসে এবং দ্রুত EMA ধীর EMA এর নিচে থাকে তখন একটি শর্ট পজিশন স্থাপন করুন।
কৌশলগত সুবিধা
- লিনিয়ার রিগ্রেশন এবং অস্থিরতা সূচক একত্রিত করে, কৌশলটি বাজারের অবস্থা এবং প্রবণতা আরও সঠিকভাবে সনাক্ত করতে পারে।
- ট্রেডিং সিগন্যাল নিশ্চিত করতে অতিরিক্ত EMA সূচক ব্যবহার করা কৌশলটির নির্ভরযোগ্যতা বাড়ায়।
- মূল পরামিতিগুলির অপ্টিমাইজেশানকে অনুমতি দেওয়া বিভিন্ন বাজারের পরিবেশ এবং যন্ত্রের বৈশিষ্ট্যগুলির সাথে অভিযোজন করতে সক্ষম করে।
- প্রবণতা এবং অস্থিরতা উভয়ই বিবেচনা করে, কৌশলটি যখন প্রবণতা স্পষ্ট হয় তখন দ্রুত অবস্থান স্থাপন করতে পারে এবং যখন অস্থিরতা বৃদ্ধি পায় তখন ঝুঁকি নিয়ন্ত্রণ করতে পারে।
কৌশলগত ঝুঁকি
- ভুল প্যারামিটার নির্বাচন দুর্বল কৌশল কর্মক্ষমতা হতে পারে, নির্দিষ্ট যন্ত্র এবং বাজারের বৈশিষ্ট্য উপর ভিত্তি করে অপ্টিমাইজেশান প্রয়োজন।
- অস্থির বাজার বা প্রবণতা বাঁক পয়েন্টগুলিতে, কৌশলটি ঘন ঘন ট্রেড বা মিথ্যা সংকেত অনুভব করতে পারে।
- কৌশলটি ঐতিহাসিক তথ্যের উপর ভিত্তি করে এবং হঠাৎ ঘটনা বা অস্বাভাবিক বাজার ওঠানামা অবিলম্বে প্রতিক্রিয়া জানাতে পারে না।
কৌশল অপ্টিমাইজেশান নির্দেশাবলী
- সিদ্ধান্ত গ্রহণের ভিত্তি সমৃদ্ধ করতে এবং সংকেতের নির্ভুলতা উন্নত করতে অন্যান্য প্রযুক্তিগত সূচক বা মৌলিক কারণগুলি অন্তর্ভুক্ত করুন।
- বিভিন্ন যন্ত্র এবং বাজারের বৈশিষ্ট্যগুলির সাথে মানিয়ে নিতে প্যারামিটার নির্বাচন, যেমন রিগ্রেশন দৈর্ঘ্য, অস্থিরতা গুণক, ইএমএ সময়কাল ইত্যাদি অপ্টিমাইজ করুন।
- স্বতন্ত্র বাণিজ্য ঝুঁকি এবং সামগ্রিক ড্রাউনডাউন স্তর নিয়ন্ত্রণের জন্য স্টপ-লস এবং লাভ নেওয়ার প্রক্রিয়া প্রবর্তন করা।
- বাজারের অস্থিরতা এবং অ্যাকাউন্টের মূলধন ভিত্তিতে অবস্থানের আকার সামঞ্জস্য করার জন্য পজিশনের আকার এবং অর্থ পরিচালনার নিয়ম অন্তর্ভুক্ত করার বিষয়টি বিবেচনা করুন।
সংক্ষিপ্তসার
কৌশলটি লিনিয়ার রিগ্রেশন এবং অস্থিরতা সূচক ব্যবহার করে বাজার অবস্থা চিহ্নিত করে, EMAs নিশ্চিতকরণ সূচক হিসাবে, একটি অভিযোজনশীল এবং যৌক্তিকভাবে পরিষ্কার ট্রেডিং কৌশল নির্মাণ করে। কৌশলটির সুবিধাগুলি প্রবণতা এবং অস্থিরতা একত্রিত করে প্যারামিটার অপ্টিমাইজেশনের অনুমতি দেয়, এটি বিভিন্ন বাজারের পরিবেশের জন্য উপযুক্ত করে তোলে। তবে, কৌশলটি প্যারামিটার নির্বাচন, অস্থির বাজার এবং কালো সোয়ান ইভেন্টগুলির মতো ঝুঁকিগুলির মুখোমুখি হয়, যা ব্যবহারিক অ্যাপ্লিকেশনগুলিতে ক্রমাগত অপ্টিমাইজেশন এবং উন্নতির প্রয়োজন। ভবিষ্যতের উন্নতিগুলি সংকেত উত্স সমৃদ্ধকরণ, প্যারামিটার নির্বাচন অনুকূলীকরণ এবং কৌশলটির স্থায়িত্ব এবং লাভজনকতা বাড়ানোর জন্য ঝুঁকি নিয়ন্ত্রণ ব্যবস্থাগুলি পরিমার্জন করতে মনোনিবেশ করতে পারে।
/*backtest
start: 2023-05-22 00:00:00
end: 2024-05-27 00:00:00
period: 1d
basePeriod: 1h
exchanges: [{"eid":"Futures_Binance","currency":"BTC_USDT"}]
*/

// This Pine Script™ code is subject to the terms of the Mozilla Public License 2.0 at https://mozilla.org/MPL/2.0/
// © tmalvao

//@version=5
strategy("Regime de Mercado com Regressão e Volatilidade Otimizado", overlay=true)

// Parâmetros para otimização
upperThreshold = input.float(1.0, title="Upper Threshold")
lowerThreshold = input.float(-1.0, title="Lower Threshold")
length = input.int(50, title="Length", minval=1)

// Indicadores de volatilidade
atrLength = input.int(14, title="ATR Length")
atrMult = input.float(2.0, title="ATR Multiplier")
atr = ta.atr(atrLength)
volatility = atr * atrMult

// Calculando a regressão linear usando função incorporada
intercept = ta.linreg(close, length, 0)
slope = ta.linreg(close, length, 1) - ta.linreg(close, length, 0)

// Sinal de compra e venda
buySignal = slope > upperThreshold and close > intercept + volatility
sellSignal = slope < lowerThreshold and close < intercept - volatility

// Entrando e saindo das posições
if (buySignal)
    strategy.entry("Buy", strategy.long)
if (sellSignal)
    strategy.entry("Sell", strategy.short)

// Indicadores adicionais para confirmação
emaFastLength = input.int(10, title="EMA Fast Length")
emaSlowLength = input.int(50, title="EMA Slow Length")
emaFast = ta.ema(close, emaFastLength)
emaSlow = ta.ema(close, emaSlowLength)

// Confirmando sinais com EMAs
if (buySignal and emaFast > emaSlow)
    strategy.entry("Buy Confirmed", strategy.long)
if (sellSignal and emaFast < emaSlow)
    strategy.entry("Sell Confirmed", strategy.short)

// Exibindo informações no gráfico
plot(slope, title="Slope", color=color.blue)
plot(intercept, title="Intercept", color=color.red)
plot(volatility, title="Volatility", color=color.green)
hline(upperThreshold, "Upper Threshold", color=color.green, linestyle=hline.style_dotted)
hline(lowerThreshold, "Lower Threshold", color=color.red, linestyle=hline.style_dotted)
- উন্নত মাল্টি-ইন্ডিকেটর মিনটেম ট্রেডিং কৌশল
- ডায়নামিক চ্যানেল এবং চলমান গড় ট্রেডিং সিস্টেমের সাথে মাল্টি-ইন্ডিক্টর ট্রেন্ড অনুসরণকারী কৌশল
- ক্রমাগত মোমবাতি বুল বিয়ার কৌশল
- কেল্টনার চ্যানেলস ইএমএ এটিআর কৌশল
- সুপারট্রেন্ড এবং ইএমএ সংমিশ্রণ কৌশল
- ATR-ভিত্তিক লাভ এবং স্টপ লস নিয়ে একাধিক সময়সীমার ট্রেন্ড অনুসরণকারী কৌশল
- ATR এবং EMA-ভিত্তিক ডায়নামিক টেক লাভ এবং স্টপ লস অ্যাডাপ্টিভ স্ট্র্যাটেজি
- ট্রেডিং কৌশল অনুসরণ করে ইএমএ গতিশীল প্রবণতা
- ট্রিপল ইএমএ ক্রসওভার কৌশল
- ভলিউম-ভিত্তিক এটিআর ডায়নামিক স্টপ-লস অপ্টিমাইজেশান সহ মাল্টি-এক্সপেনসিয়াল মুভিং এভারেজ ক্রসওভার কৌশল
- MA MACD BB মাল্টি-ইন্ডিক্টর ট্রেডিং স্ট্র্যাটেজি ব্যাকটেস্টিং টুল
- আরএসআই+সুপারট্রেন্ড ট্রেন্ড-ফলোিং ট্রেডিং কৌশল
- ইচিমোকু কুমো ট্রেডিং কৌশল
- ডায়নামিক এটিআর স্টপ লস অ্যান্ড টেক প্রফিট মুভিং এভারেজ ক্রসওভার স্ট্র্যাটেজি
- ইএমএ ট্রেন্ড মম্পটম্যান্টম ক্যান্ডেলস্টিক প্যাটার্ন কৌশল
- জি-চ্যানেল ট্রেন্ড সনাক্তকরণ কৌশল
- ট্রেলিং স্টপ লস স্ট্র্যাটেজি সহ চলমান গড় ক্রসওভার
- ডায়নামিক টেক লাভ এবং স্টপ লস সহ ইএমএ ক্রসওভার ট্রেডিং কৌশল
- বোলিংজার ব্যান্ড এবং ইএমএ ট্রেন্ড অনুসরণকারী কৌশল
- ওয়েভট্রেন্ড ওসিলেটর ডিভার্জেন্স কৌশল
- হাইব্রিড বিনোমিয়াল জেড-স্কোর পরিমাণগত কৌশল
- আরএসআই এবং এমএ সংমিশ্রণ কৌশল
- ইএমএ ইম্পোমেন্টাম ট্রেডিং কৌশল
- এফভিজি মিনটেম স্কাল্পিং কৌশল
- ATR এবং EMA-ভিত্তিক ডায়নামিক টেক লাভ এবং স্টপ লস অ্যাডাপ্টিভ স্ট্র্যাটেজি
- ব্রেকআউট এবং ফ্রিকোয়েন্সি ফিল্টার (শুধুমাত্র দীর্ঘ) সহ ট্রেন্ড অনুসরণ
- ফিবোনাচি গোল্ডেন হারমনি ব্রেকআউট কৌশল
- লিনিয়ার রিগ্রেশন স্কেল ভিত্তিক গতিশীল বাজার ব্যবস্থার চিহ্নিতকরণ কৌশল
- ট্রেন্ড রিভার্সাল ট্রেডিং কৌশল RSI ডিভার্জেন্স উপর ভিত্তি করে
- ইএমএ এবং ট্রেন্ডলাইন ব্রেকআউটের উপর ভিত্তি করে দ্বৈত চলমান গড় আরএসআই গতি কৌশল