Multi-factor Trend Following Quantitative Trading Strategy Based on RSI, ADX, and Ichimoku Cloud
Author: ChaoZhang, Date: 2024-05-17 13:37:47Tags: RSIADXICHIMOKUSMA

Overview
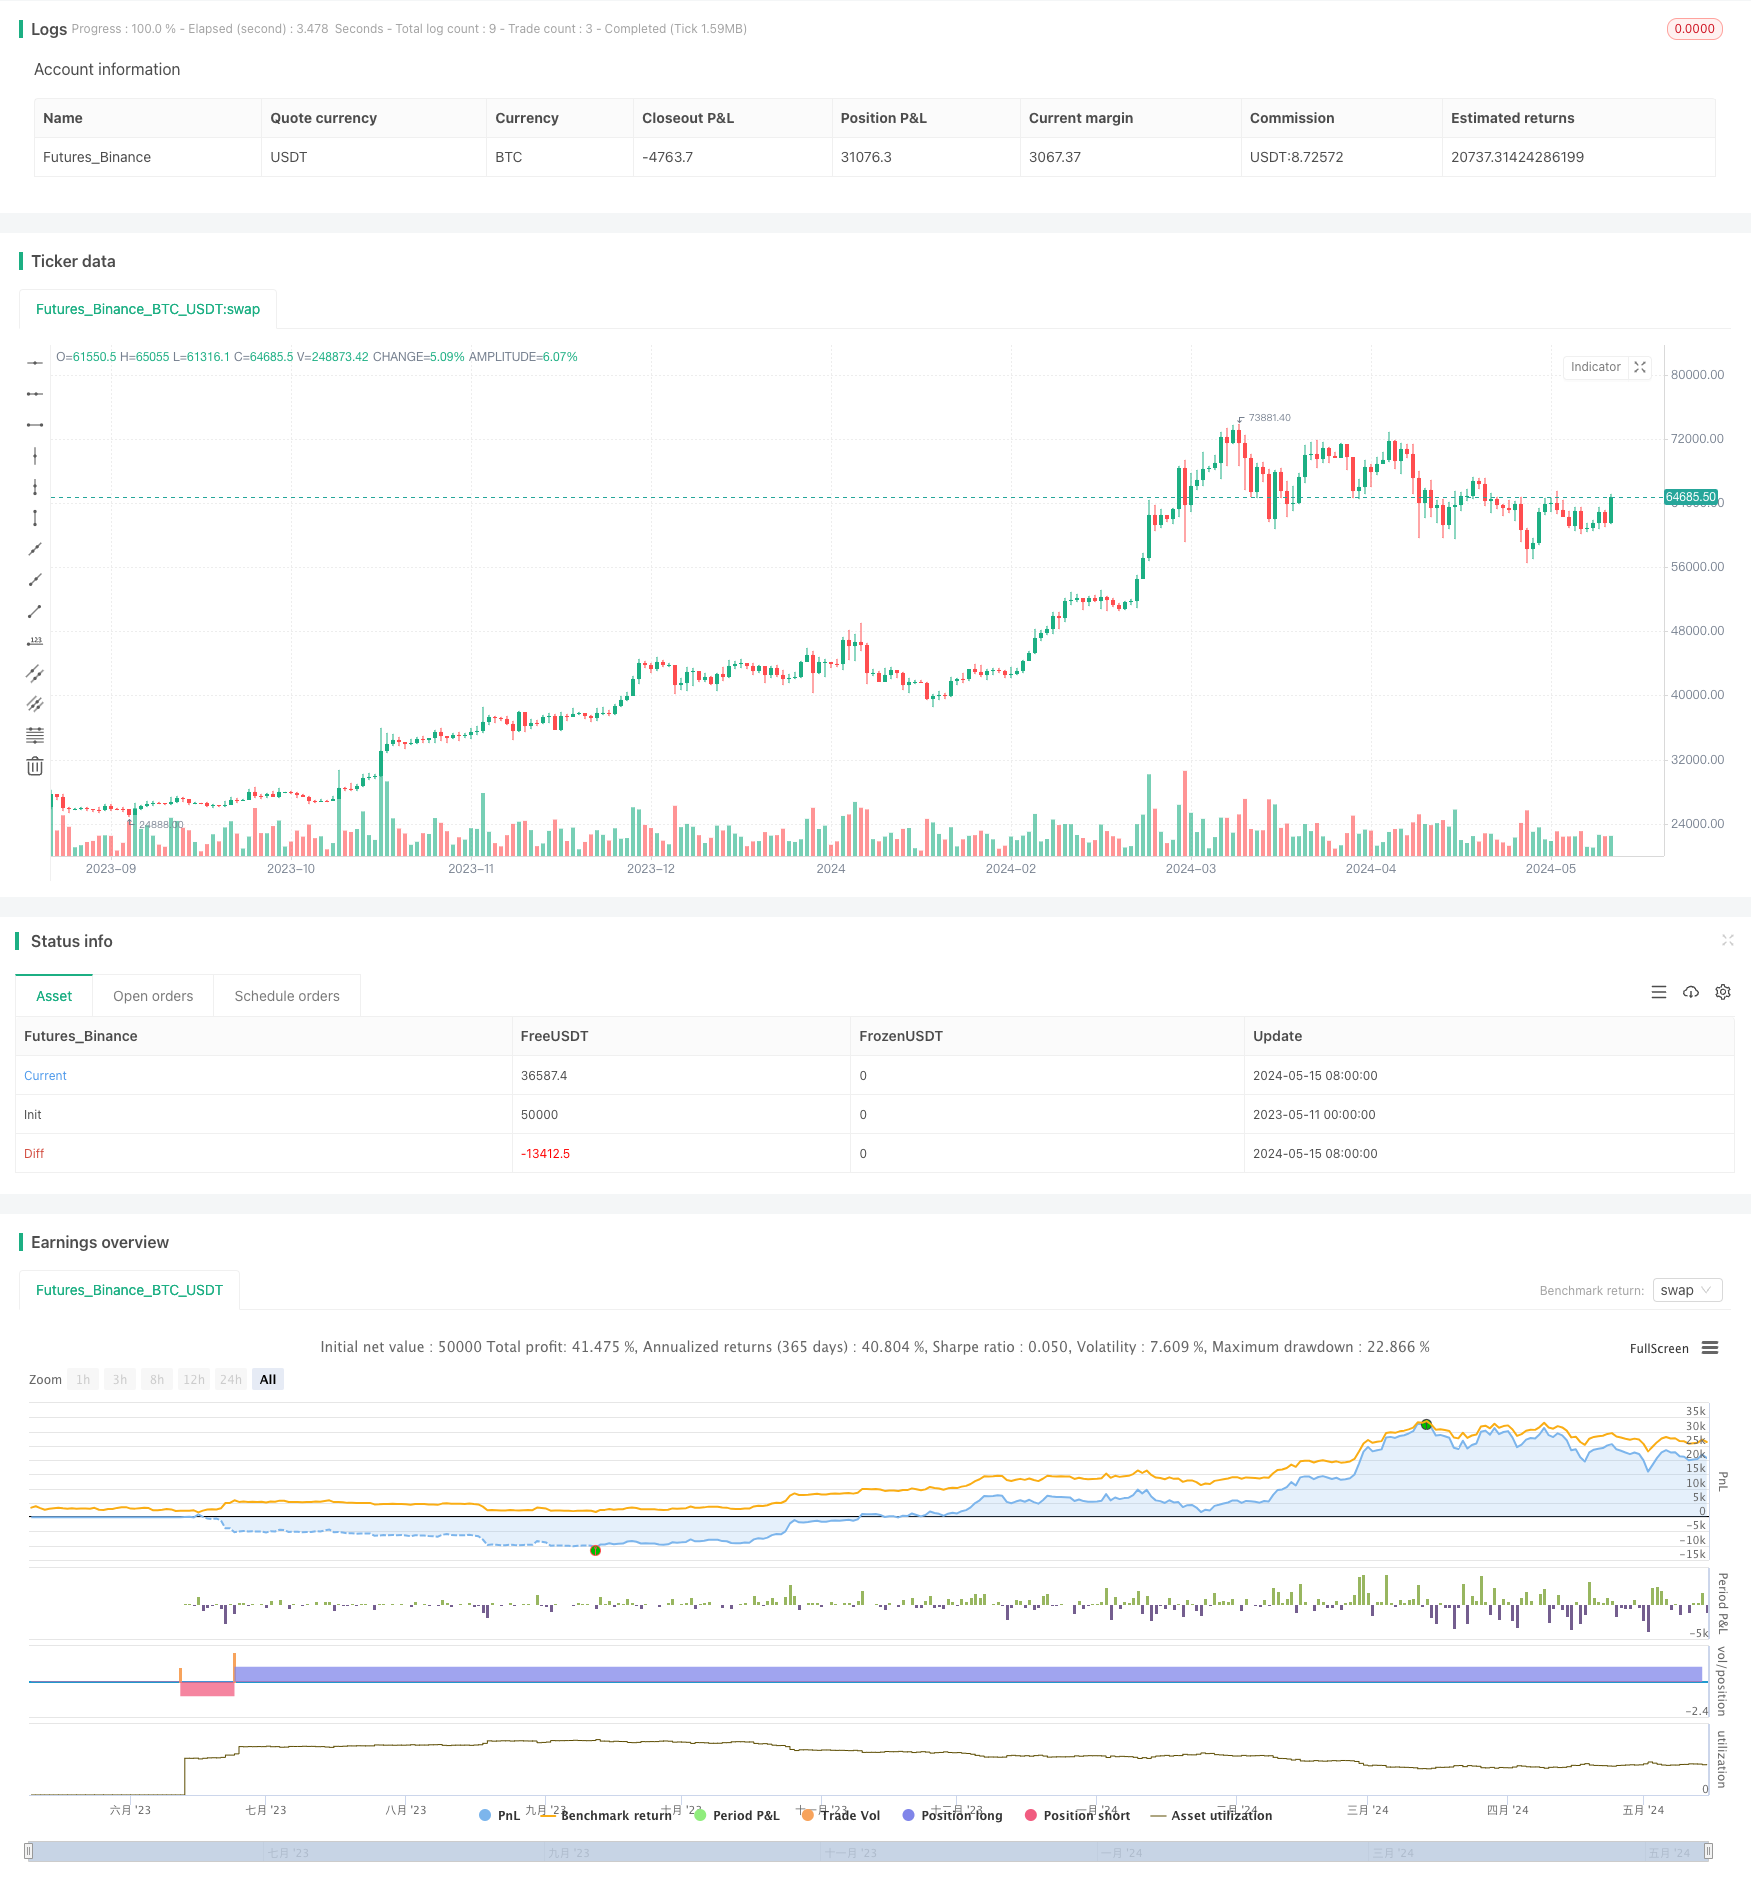
This strategy combines three technical indicators - Relative Strength Index (RSI), Average Directional Index (ADX), and Ichimoku Cloud - to construct a multi-factor trend-following quantitative trading strategy. The main idea is to use the RSI indicator to determine overbought and oversold conditions, the ADX indicator to gauge trend strength, and the Ichimoku Cloud to identify trend direction. It also incorporates moving average crossover signals to open long or short positions when specific conditions are met.
Strategy Principles
- ADX Indicator: An ADX value above 20 indicates that the market is in a strong trend.
- RSI Indicator: RSI measures the relative strength of the price over a period of time and is used to identify overbought or oversold conditions.
- Ichimoku Cloud: The position of the price relative to the cloud provides information about the direction of the trend.
- Long Entry Conditions: A long position is opened when the price is above the Ichimoku Cloud, the 14-period SMA crosses above the 28-period SMA, and the RSI value is below its moving average.
- Short Entry Conditions: A short position is opened when the price is below the Ichimoku Cloud, the 14-period SMA crosses below the 28-period SMA, and the RSI value is above its moving average.
Strategy Advantages
- Multi-factor combination: The strategy takes into account multiple factors such as trend strength, overbought/oversold conditions, and trend direction, making the signals more reliable.
- Trend following: By using the Ichimoku Cloud and moving averages, the strategy can effectively capture and follow market trends.
- Risk control: The incorporation of the RSI indicator helps avoid buying or selling in overbought or oversold areas, reducing risk.
Strategy Risks
- Parameter optimization risk: The strategy includes multiple parameters such as RSI period, ADX period, Ichimoku Cloud period, etc. Different parameter choices may lead to significant differences in strategy performance, requiring parameter optimization.
- Market risk: In situations where the trend is unclear or market volatility is high, the strategy may generate many false signals, leading to frequent trading and capital losses.
- Slippage and transaction costs: Frequent opening and closing of positions may increase slippage and transaction costs, affecting strategy profitability.
Strategy Optimization Directions
- Parameter optimization: Optimize the various parameters in the strategy, such as RSI period, ADX period, Ichimoku Cloud period, moving average period, etc., to improve the stability and profitability of the strategy.
- Stop-loss and take-profit: Introduce reasonable stop-loss and take-profit mechanisms, such as setting dynamic stop-loss based on ATR, to control the risk of individual trades.
- Position sizing: Dynamically adjust position size based on market volatility and account risk tolerance to control overall risk.
- Multi-timeframe and multi-asset: Apply the strategy to different time frames and trading instruments to diversify risk and improve the adaptability of the strategy.
Summary
This strategy innovatively combines three technical indicators - RSI, ADX, and Ichimoku Cloud - to construct a multi-factor trend-following quantitative trading strategy. The strategy has certain advantages in trend tracking and risk control, but also faces risks such as parameter optimization, market risk, and transaction costs. In the future, the strategy can be optimized through parameter optimization, stop-loss and take-profit, position sizing, and multi-timeframe and multi-asset application to improve its stability and profitability.
/*backtest
start: 2023-05-11 00:00:00
end: 2024-05-16 00:00:00
period: 1d
basePeriod: 1h
exchanges: [{"eid":"Futures_Binance","currency":"BTC_USDT"}]
*/

//@version=5
strategy("Stratejim RSI, ADX ve Ichimoku ile", overlay=true, margin_long=100, margin_short=100)

// ADX, RSI ve Ichimoku tanımları
[diPlus, diMinus, adx] = ta.dmi(14, 14)
rsiPeriod = 14
rsi = ta.rsi(close, rsiPeriod)
tenkanPeriod = 9
kijunPeriod = 26
senkouSpanBPeriod = 52
displacement = 26
tenkan = ta.sma((high + low) / 2, tenkanPeriod)
kijun = ta.sma((high + low) / 2, kijunPeriod)
senkouSpanA = (tenkan + kijun) / 2
senkouSpanB = ta.sma((high + low) / 2, senkouSpanBPeriod)

// Ichimoku Bulutu koşulları
priceAboveCloud = close > ta.valuewhen(bar_index, math.max(senkouSpanA, senkouSpanB), displacement)
priceBelowCloud = close < ta.valuewhen(bar_index, math.min(senkouSpanA, senkouSpanB), displacement)

// Uzun pozisyon için koşullar
longSmaCondition = ta.crossover(ta.sma(close, 14), ta.sma(close, 28))
longAdxCondition = adx > 20
longRsiCondition = rsi < ta.sma(rsi, rsiPeriod)
if (longSmaCondition and longAdxCondition and not longRsiCondition and priceAboveCloud)
    strategy.entry("My Long Entry Id", strategy.long)

// Kısa pozisyon için koşullar
shortSmaCondition = ta.crossunder(ta.sma(close, 14), ta.sma(close, 28))
shortAdxCondition = adx > 20
shortRsiCondition = rsi > ta.sma(rsi, rsiPeriod)
if (shortSmaCondition and shortAdxCondition and not shortRsiCondition and priceBelowCloud)
    strategy.entry("My Short Entry Id", strategy.short)
- Multi-Indicator Dynamic Momentum Cross Strategy
- Enhanced Dual EMA Pullback Breakout Trading Strategy
- Dynamic Position Sizing Short-Term Forex Trading Strategy
- Dynamic Trend Following Strategy - Multi-Indicator Integrated Momentum Analysis System
- Scalping EMA ADX RSI with Buy/Sell
- Multi-Period Technical Indicator Dynamic Trading System Strategy
- Multi-Indicator Dynamic Stop-Loss Momentum Trend Trading Strategy
- Multi-Filter Trend Breakthrough Smart Moving Average Trading Strategy
- Volume-based Dynamic DCA Strategy
- Elliott Wave Theory 4-9 Impulse Wave Automatic Detection Trading Strategy
- EMA5 and EMA13 Crossover Strategy
- EMA SAR Medium-to-Long-Term Trend Following Strategy
- Reverse Volatility Breakout Strategy
- Nifty 50 3-Minute Opening Range Breakout Strategy
- Dynamic Stop Loss and Take Profit Bollinger Bands Strategy
- Improved Swing High/Low Breakout Strategy with Bullish and Bearish Engulfing Patterns
- Laguerre RSI with ADX Filtered Trading Signals Strategy
- Price and Volume Breakout Buy Strategy
- K Consecutive Candles Bull Bear Strategy
- Super Moving Average and Upperband Crossover Strategy
- RSI and MACD Combined Long-Short Strategy
- Ichimoku Cloud and Moving Average Strategy
- William Alligator Moving Average Trend Catcher Strategy
- Dynamic MACD and Ichimoku Cloud Trading Strategy
- MA Rejection Strategy with ADX Filter
- Bollinger Bands Strategy: Precision Trading for Maximum Gains
- ATR Average Breakout Strategy
- KNN Machine Learning Strategy: Trend Prediction Trading System Based on K-Nearest Neighbors Algorithm
- CCI+RSI+KC Trend Filter Bi-Directional Trading Strategy
- BMSB Breakout Strategy