Multi-timeframe Trend Tracking Strategy Based on Impulse MACD and Dual Moving Average Crossover
Author: ChaoZhang, Date: 2024-05-17 15:33:02Tags: MACDSMMASMAZLEMAEMAMA

Overview
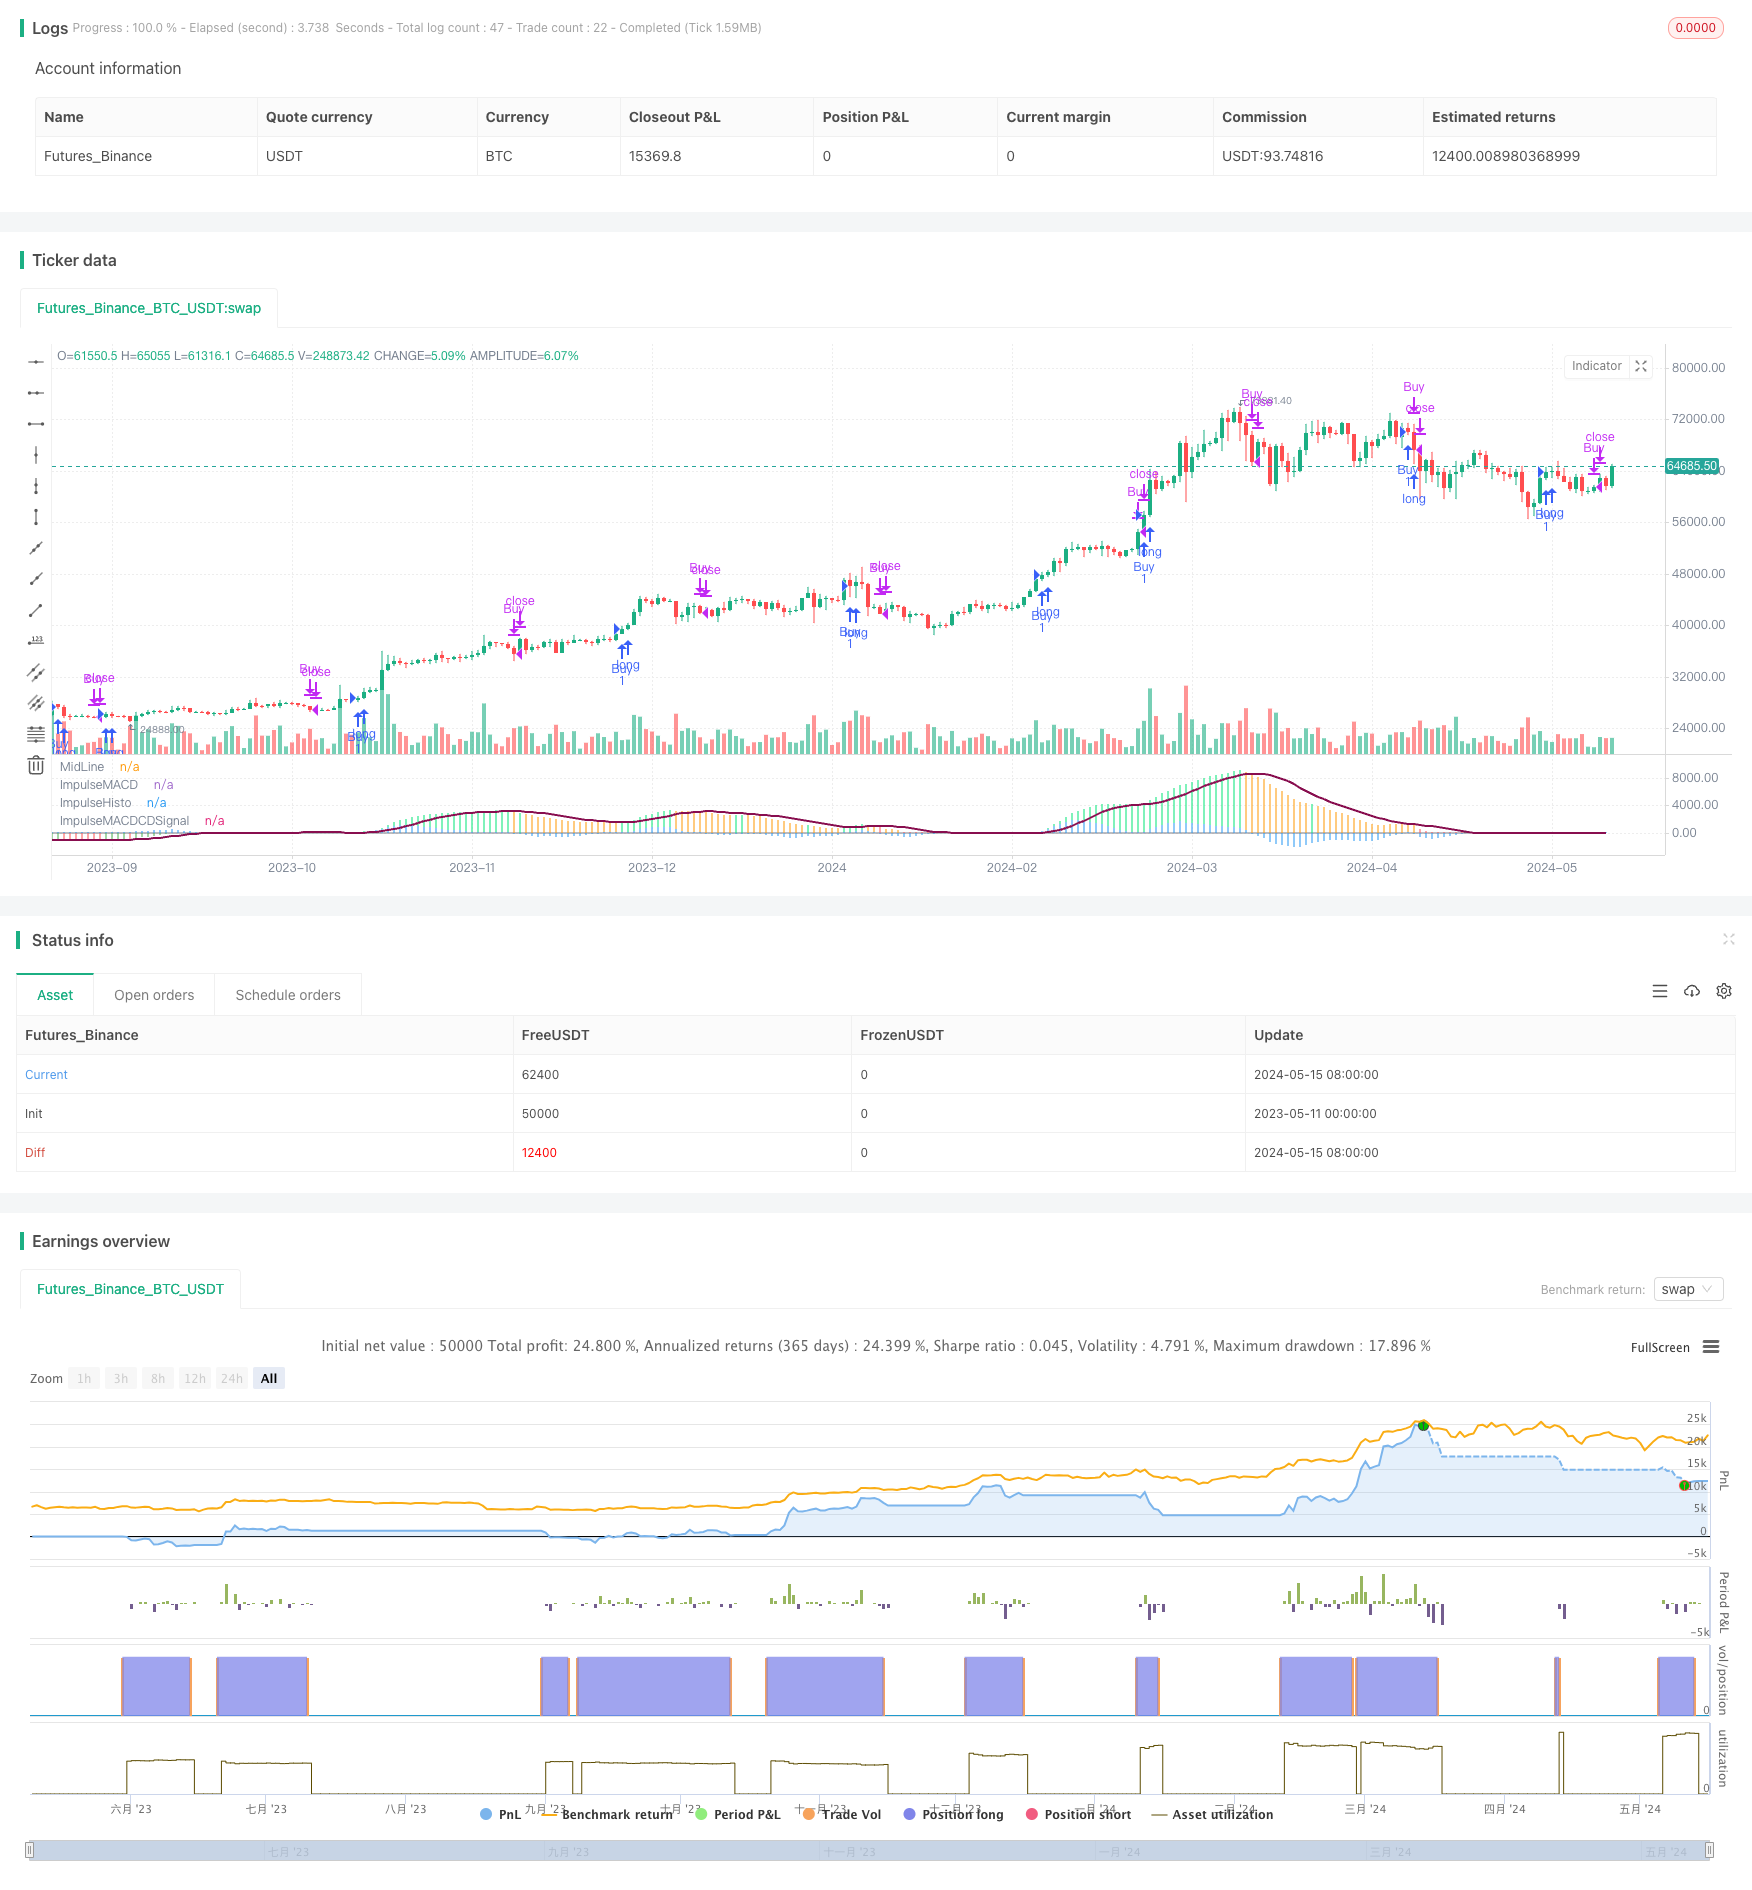
This strategy utilizes various moving average indicators, including SMMA, SMA, ZLEMA, and EMA, and constructs an improved MACD indicator (Impulse MACD) based on them. It generates trading signals through the crossover of the Impulse MACD and its signal line. The main idea of the strategy is to capture market trends using moving averages of different time frames while confirming the strength and direction of the trend with the Impulse MACD.
Strategy Principle
- Calculate the SMMA and ZLEMA of the high, low, and close prices with a length of 34 to obtain the Impulse MACD (MD).
- Calculate the 9-period SMA of the Impulse MACD as the signal line (SB).
- Calculate the difference between the Impulse MACD and the signal line (SH) to reflect the trend strength.
- Generate a buy signal when the Impulse MACD crosses above the signal line, and close the position when it crosses below.
- Plot the Impulse MACD histogram with different colors based on the relationship between the price, Impulse MACD, and the high/low price SMMA to visually reflect the trend strength.
Strategy Advantages
- The use of multiple types of moving averages provides a more comprehensive reflection of market trends.
- The improved MACD indicator (Impulse MACD) takes into account the relative position of price and moving averages, better reflecting the trend strength.
- The introduction of the signal line helps filter out some false signals and improve signal quality.
- Plotting the Impulse MACD with different colors based on trend strength facilitates intuitive judgment of market movements.
Strategy Risks
- Improper parameter selection may lead to frequent or lagging signals, requiring optimization based on different markets and timeframes.
- The strategy may generate more false signals and cause losses in choppy markets.
- The strategy lacks a stop-loss mechanism and may face significant drawdowns in volatile markets.
Strategy Optimization Directions
- Introduce trend identification indicators such as ADX to only trade when the trend is clear, reducing losses in choppy markets.
- Confirm the generated trading signals with other indicators such as RSI and ATR to improve signal quality.
- Set reasonable stop-loss and take-profit levels to control single-trade risk.
- Optimize parameters using methods such as genetic algorithms to find the optimal parameter combination.
Summary
This strategy constructs an improved MACD indicator based on various types of moving averages and generates trading signals through its crossover with the signal line while intuitively displaying trend strength. The overall idea is clear, and the advantages are obvious. However, the strategy also has certain limitations, such as poor adaptability to choppy markets and a lack of risk control measures. Further improvements can be considered from aspects such as trend identification, signal confirmation, risk control, and parameter optimization to enhance the robustness and profitability of the strategy.
/*backtest
start: 2023-05-11 00:00:00
end: 2024-05-16 00:00:00
period: 1d
basePeriod: 1h
exchanges: [{"eid":"Futures_Binance","currency":"BTC_USDT"}]
*/

//@version=5
strategy("Impulse MACD Strategy [LazyBear]", shorttitle="IMACD_Strategy", overlay=false)

// Function to calculate SMMA
calc_smma(src, len) =>
    var float smma = na
    smma := na(smma[1]) ? ta.sma(src, len) : (smma[1] * (len - 1) + src) / len
    smma

// Function to calculate SMA
	ta.sma(src, len)
    sum = 0.0
    for i = 0 to len - 1
        sum := sum + src[i]
    sum / len

// Function to calculate ZLEMA
calc_zlema(src, length) =>
    var float ema1 = na
    var float ema2 = na
    var float d = na
    ema1 := ta.ema(src, length)
    ema2 := ta.ema(ema1, length)
    d := ema1 - ema2
    ema1 + d

// Function to calculate EMA
calc_ema(src, len) =>
    ema = 0.0
    ema := ta.ema(src, len)
    ema

// Inputs
lengthMA = input(34, title="Length of Moving Average")
lengthSignal = input(9, title="Length of Signal Line")

// Calculations
src = hlc3
hi = calc_smma(high, lengthMA)
lo = calc_smma(low, lengthMA)
mi = calc_zlema(src, lengthMA)

md = mi > hi ? (mi - hi) : mi < lo ? (mi - lo) : 0
sb = ta.sma(md, lengthSignal)
sh = md - sb
mdc = src > mi ? src > hi ? color.lime : color.green : src < lo ? color.red : color.orange

// Plotting
plot(0, color=color.gray, linewidth=1, title="MidLine")
plot(md, color=mdc, linewidth=2, title="ImpulseMACD", style=plot.style_histogram)
plot(sh, color=color.blue, linewidth=2, title="ImpulseHisto", style=plot.style_histogram)
plot(sb, color=color.maroon, linewidth=2, title="ImpulseMACDCDSignal")

// Execute trades based on signals
if (ta.crossover(md, sb))
    strategy.entry("Buy", strategy.long)
if (ta.crossunder(md, sb))
    strategy.close("Buy")
- Adaptive Multi-MA Momentum Breakthrough Trading Strategy
- MACD and Martingale Combination Strategy for Optimized Long Trading
- MACD Multi-Interval Dynamic Stop-Loss and Take-Profit Trading System
- Dual Moving Average MACD Crossover Date-Adjustable Quantitative Trading Strategy
- Dynamic Dual Moving Average Crossover Quantitative Trading Strategy
- Multi-Level Dynamic MACD Trend Following Strategy with 52-Week High/Low Extension Analysis System
- Multi-Indicator Fusion Mean Reversion Trend Following Strategy
- Enhanced Price-Volume Trend Momentum Strategy
- Quantitative Long-Short Switching Strategy Based on G-Channel and EMA
- Multi-Strategy Technical Analysis Trading System
- EMA-SMA Crossover Bull Market Support Band Strategy
- Multi-Timeframe Trend Following Strategy with 200 EMA Filter - Long Only
- SMC Market High-Low Breakout Strategy
- Dynamic Trend Momentum Trading Strategy
- EMA Crossover with Short-term Signals Strategy
- Ichimoku Cloud and ATR Strategy
- BONK Multi-Factor Trading Strategy
- Dual Moving Average Crossover Strategy
- HalfTrend Bullish and Bearish Trend Following Stop-Limit Buy Strategy
- Alligator Long-Term Trend Following Trading Strategy
- EMA5 and EMA13 Crossover Strategy
- EMA SAR Medium-to-Long-Term Trend Following Strategy
- Reverse Volatility Breakout Strategy
- Nifty 50 3-Minute Opening Range Breakout Strategy
- Dynamic Stop Loss and Take Profit Bollinger Bands Strategy
- Improved Swing High/Low Breakout Strategy with Bullish and Bearish Engulfing Patterns
- Laguerre RSI with ADX Filtered Trading Signals Strategy
- Price and Volume Breakout Buy Strategy
- K Consecutive Candles Bull Bear Strategy
- Super Moving Average and Upperband Crossover Strategy