BB Breakout Strategy
Author: ChaoZhang, Date: 2024-06-14 15:21:03Tags: SMAEMASMMARMAWMAVWMASTDDEV

Overview
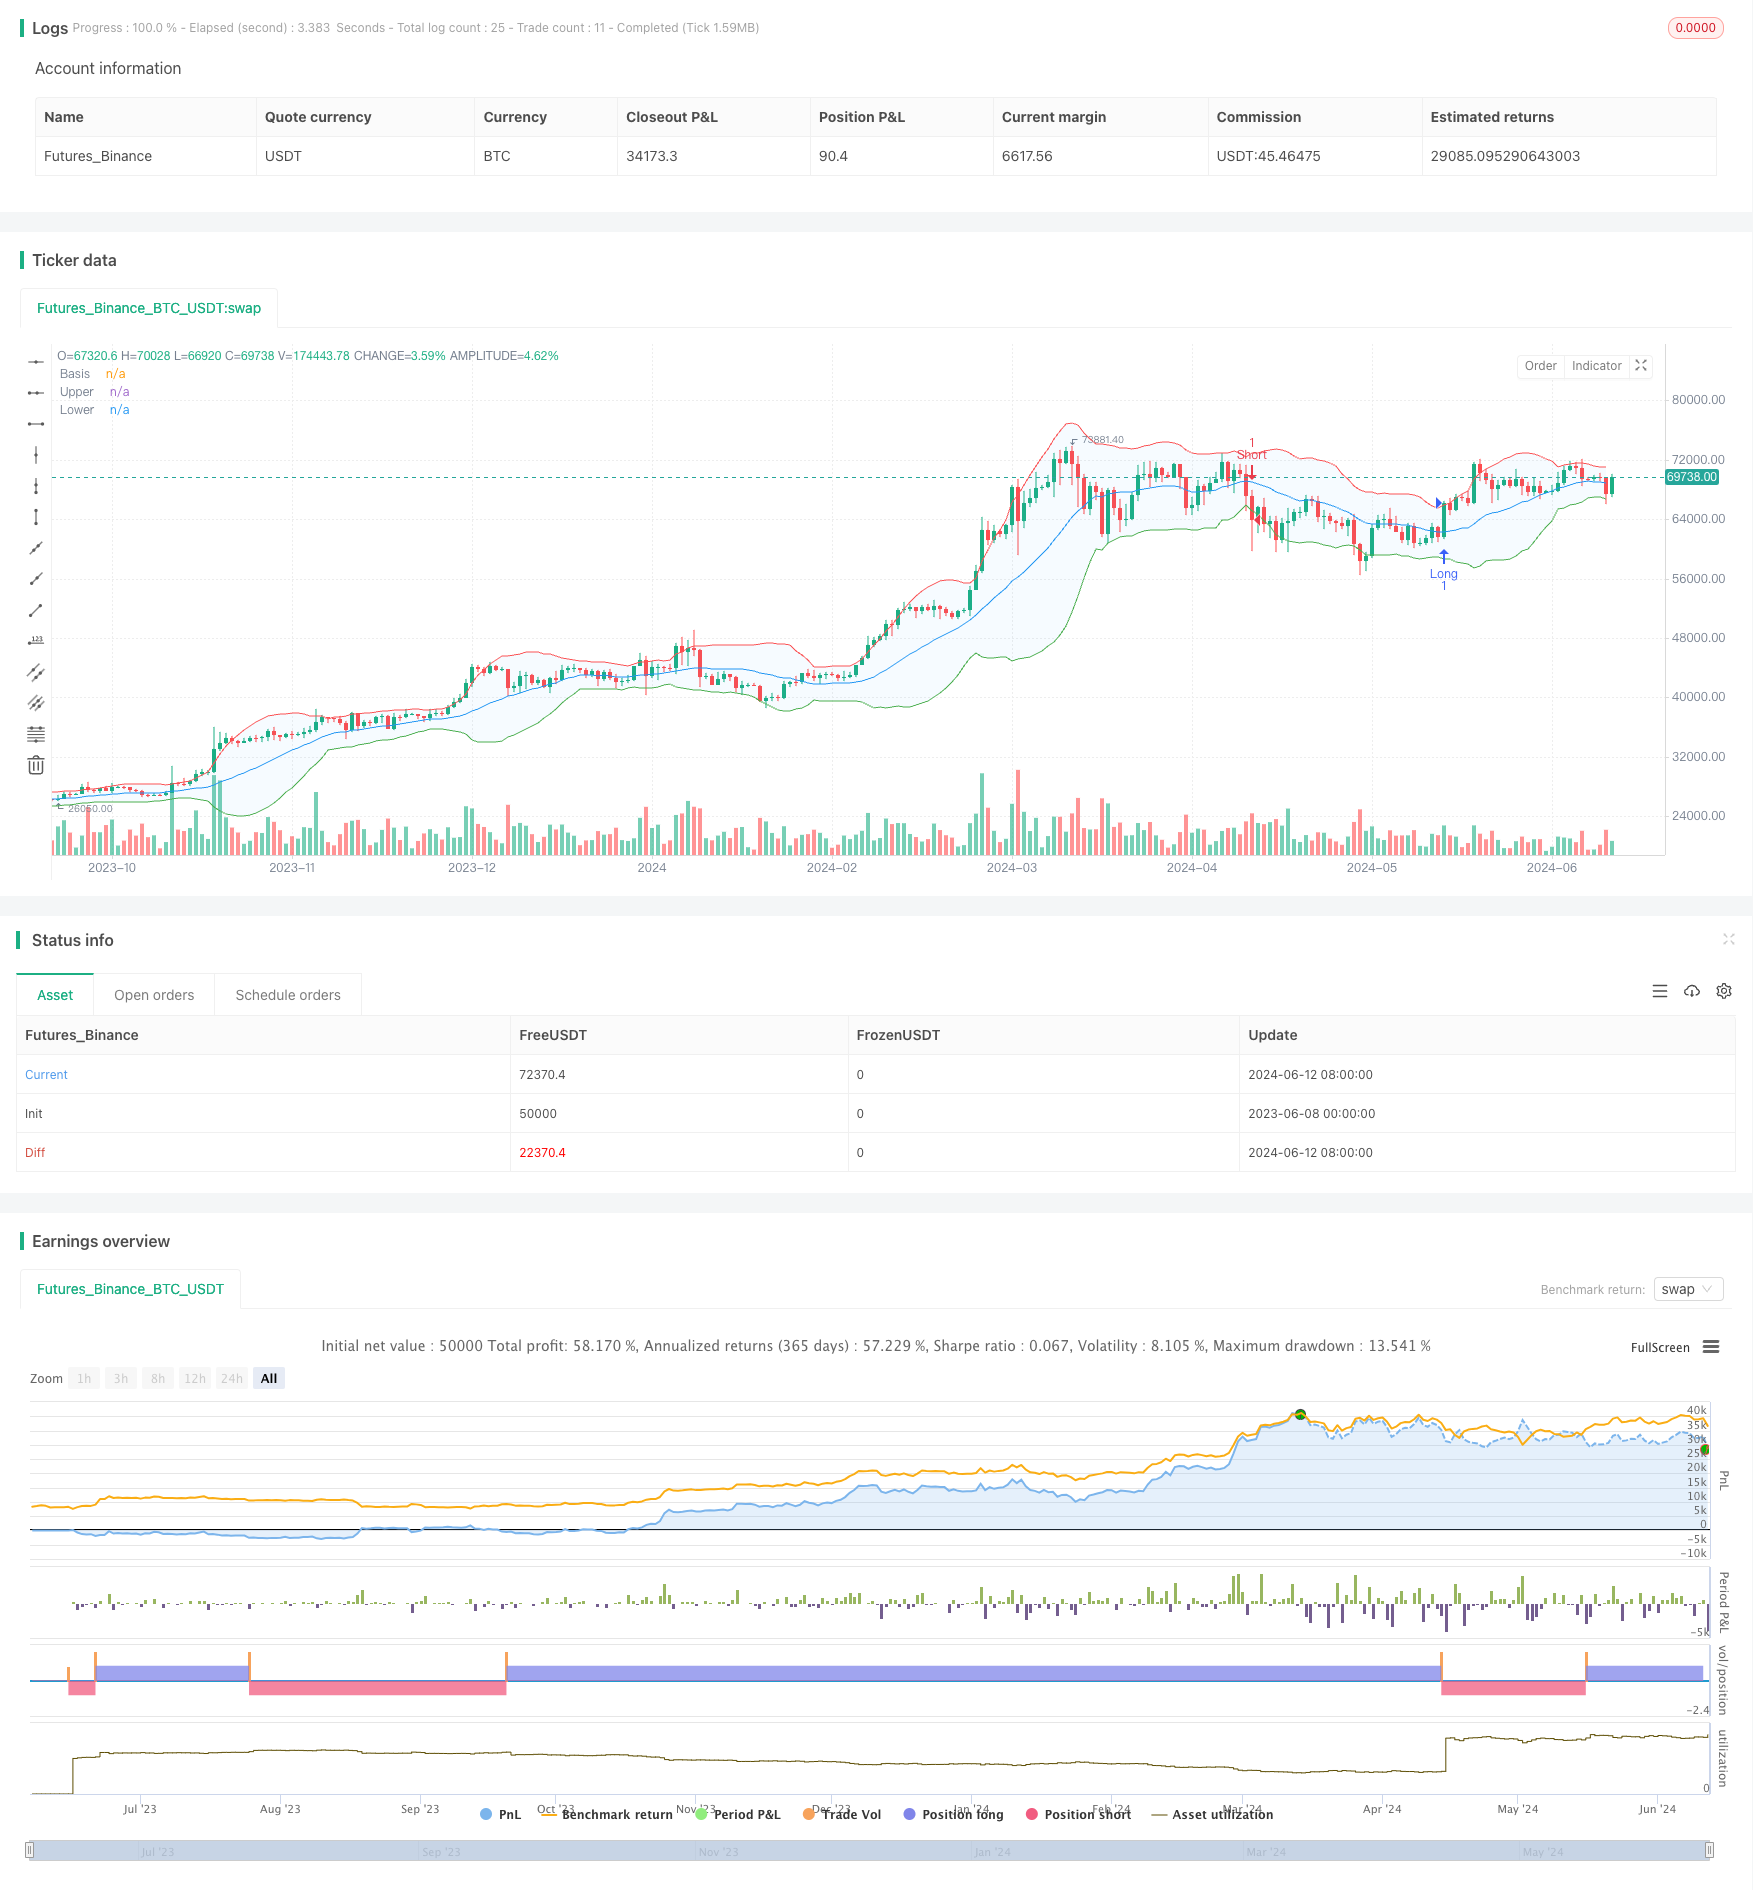
This strategy is based on the Bollinger Bands indicator and generates trading signals when the price breaks through the upper or lower bands. It goes long when the price breaks above the upper band and goes short when the price breaks below the lower band. Additionally, if holding a long position, it closes the position when the price falls below the lower band; if holding a short position, it closes the position when the price breaks above the upper band. The strategy aims to capture market volatility, entering trades when price fluctuations intensify and exiting in a timely manner when prices reverse.
Strategy Principle
- Calculate the moving average of a specified period as the middle band of the Bollinger Bands. Various types of moving averages can be chosen, such as SMA, EMA, SMMA, WMA, and VWMA.
- Calculate the upper and lower bands by adding and subtracting a certain multiple of the standard deviation from the middle band.
- Generate a long signal when the price breaks above the upper band, and a short signal when it breaks below the lower band.
- If holding a long position, close the position when the price falls below the lower band; if holding a short position, close the position when the price breaks above the upper band.
Advantage Analysis
- Bollinger Bands can effectively quantify market volatility and provide clear trading signals when price fluctuations intensify.
- The strategy also includes stop-loss conditions, which can effectively control risks.
- The strategy parameters are adjustable and can be optimized for different instruments and time frames, providing a certain degree of adaptability and flexibility.
Risk Analysis
- In a choppy market, frequent price breakthroughs of the upper and lower Bollinger Bands may lead to excessive trading signals, thereby increasing transaction costs.
- Bollinger Bands have a certain lag, and trading signals may be delayed when the market changes rapidly.
- Improper selection of Bollinger Band parameters may result in poor strategy performance, requiring optimization based on different instruments and time frames.
Optimization Directions
- Consider introducing trend indicators or price behavior pattern recognition methods to further confirm trading signals and reduce losing trades caused by false breakthroughs.
- Optimize stop-loss conditions, such as setting dynamic stop-losses based on indicators like ATR or introducing trailing stop-losses to further control risks.
- Optimize strategy parameters using methods such as genetic algorithms or grid search to find the optimal parameter combination.
Summary
The BB Breakout Strategy is a trading strategy based on the Bollinger Bands indicator, seeking trading opportunities when prices break through the upper or lower bands. The strategy’s advantages are clear signals and easy implementation, with certain risk control measures in place. However, the strategy also has some limitations, such as potentially high trading frequency and signal lag. Therefore, in practical applications, improvements can be considered in areas such as signal confirmation, stop-loss optimization, and parameter optimization to enhance the strategy’s stability and profitability.
/*backtest
start: 2023-06-08 00:00:00
end: 2024-06-13 00:00:00
period: 1d
basePeriod: 1h
exchanges: [{"eid":"Futures_Binance","currency":"BTC_USDT"}]
*/

//@version=5
strategy("BB Strategy", overlay=true)

// Input parameters
length = input.int(20, minval=1, title="Length")
maType = input.string("SMA", "Basis MA Type", options=["SMA", "EMA", "SMMA (RMA)", "WMA", "VWMA"])
src = input(close, title="Source")
mult = input.float(2.0, minval=0.001, maxval=50, title="StdDev")
offset = input.int(0, "Offset", minval=-500, maxval=500, title="Offset")

// Moving average function
ma(source, length, _type) =>
    switch _type
        "SMA" => ta.sma(source, length)
        "EMA" => ta.ema(source, length)
        "SMMA (RMA)" => ta.rma(source, length)
        "WMA" => ta.wma(source, length)
        "VWMA" => ta.vwma(source, length)

// Calculate Bollinger Bands
basis = ma(src, length, maType)
dev = mult * ta.stdev(src, length)
upper = basis + dev
lower = basis - dev

// Plot Bollinger Bands
plot(basis, "Basis", color=color.blue, offset=offset)
p1 = plot(upper, "Upper", color=color.red, offset=offset)
p2 = plot(lower, "Lower", color=color.green, offset=offset)
fill(p1, p2, title="Background", color=color.rgb(33, 150, 243, 95))

// Strategy logic
longCondition = ta.crossover(close, upper)
shortCondition = ta.crossunder(close, lower)

// Strategy entries and exits
if (longCondition)
    strategy.entry("Long", strategy.long)
if (shortCondition)
    strategy.entry("Short", strategy.short)
if (shortCondition and strategy.position_size > 0)
    strategy.close("Long")
if (longCondition and strategy.position_size < 0)
    strategy.close("Short")
- Multi-Period Moving Average Crossover Trend Following Strategy
- Multi-Moving Average Crossover Trend Following Strategy with Volatility Filter
- Dual Moving Average Momentum Tracking Quantitative Strategy
- Adaptive Moving Average Crossover Strategy
- Bollinger Bands and Moving Average Crossover Strategy
- Dynamic RSI Smart Timing Swing Trading Strategy
- VWMA-ADX Momentum and Trend-Based Bitcoin Long Strategy
- Crodl's Supertrend
- SSS
- Bollinger Bands Breakout Momentum Trading Strategy
- Simple Combined Strategy: Pivot Point SuperTrend and DEMA
- EMA Trend Filter Strategy
- Moving Average Crossover Strategy
- Intraday Breakout Strategy Based on 3-Minute Candle High Low Points
- Advanced Entry Strategy based on Moving Average, Support/Resistance, and Volume
- EMA RSI MACD Dynamic Take Profit and Stop Loss Trading Strategy
- G-Trend EMA ATR Intelligent Trading Strategy
- Trend Following Strategy Based on 200-Day Moving Average and Stochastic Oscillator
- RSI Trend Strategy
- EMA Crossover Momentum Scalping Strategy
- VWAP and RSI Dynamic Bollinger Bands Take Profit and Stop Loss Strategy
- Chande-Kroll Stop Dynamic ATR Trend Following Strategy
- This strategy generates trading signals based on the Chaikin Money Flow (CMF)
- Trend Filtered Pin Bar Reversal Strategy
- Quantitative Trading Strategy Based on Reversal Patterns at Support and Resistance Levels
- MA, SMA, MA Slope, Trailing Stop Loss, Re-Entry
- TSI Crossover Strategy
- EMA Dual Moving Average Crossover Strategy
- Williams %R Dynamic TP/SL Adjustment Strategy
- RSI Dynamic Drawdown Stop-Loss Strategy