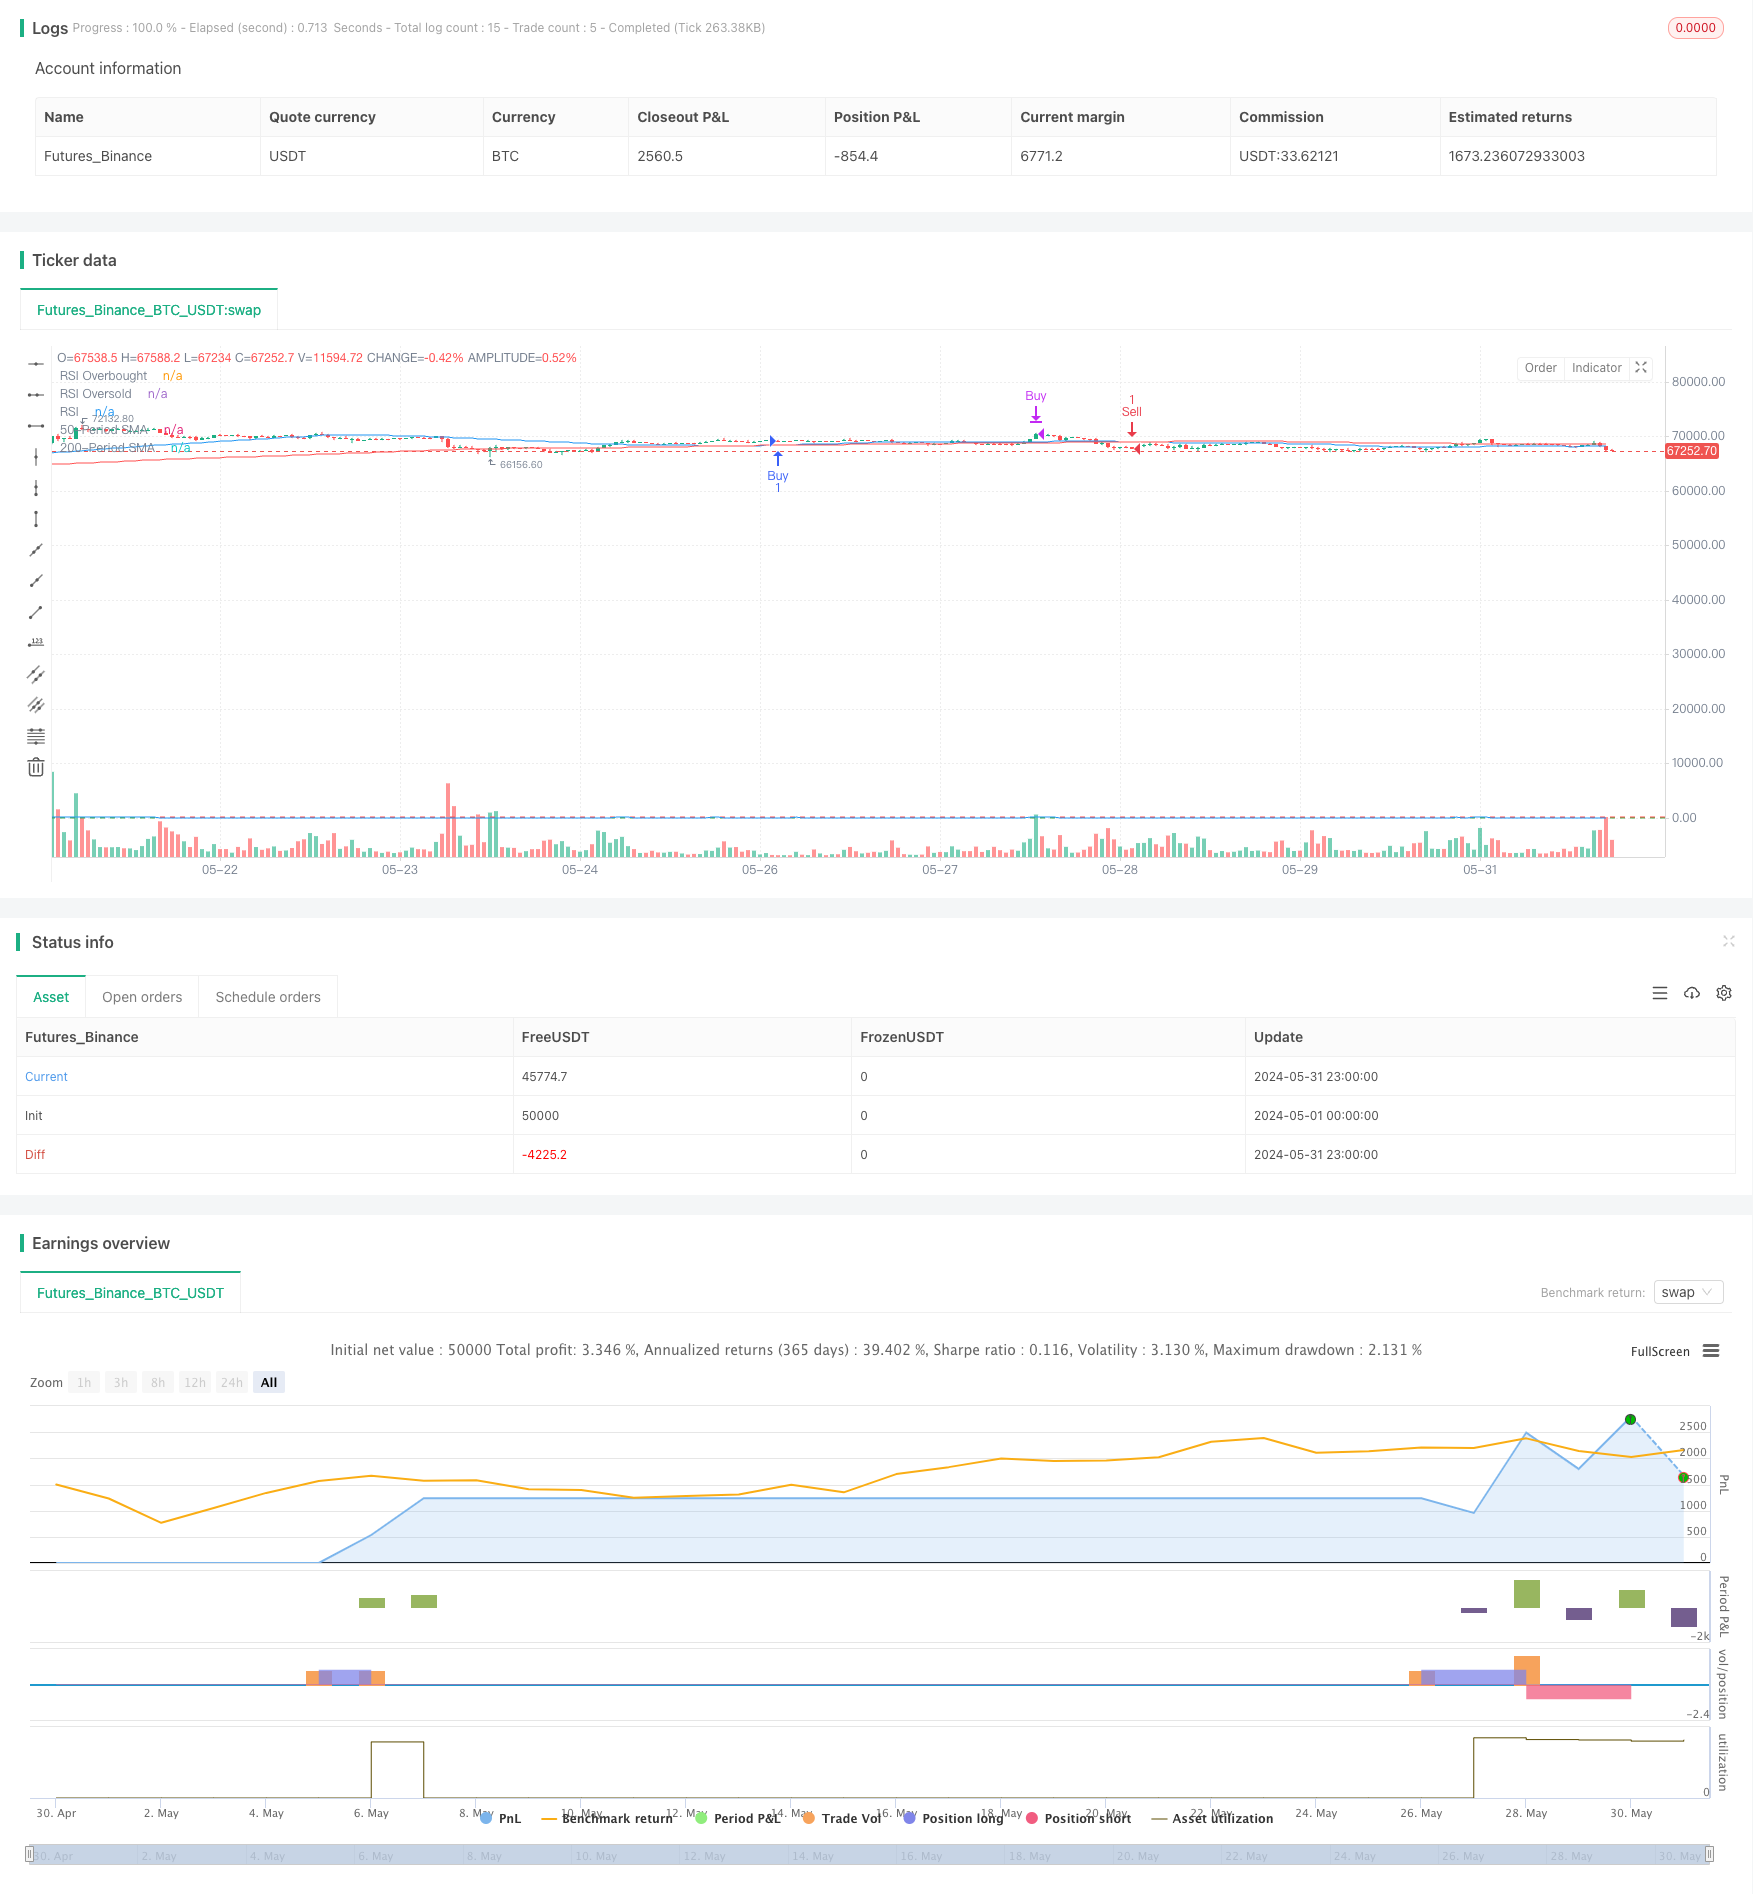
Overview
This strategy is a complex trading system that combines multiple technical indicators, designed to capture market trends and execute trades at optimal times. It primarily utilizes the Relative Strength Index (RSI), Simple Moving Averages (SMA), Fibonacci retracement levels, and concepts such as golden cross and death cross. The strategy operates on a 15-minute timeframe, using an initial capital of $1000 and a fixed position size.
Strategy Principles
The core logic of the strategy includes the following key components:
- Uses a 14-period RSI to measure overbought and oversold market conditions.
- Calculates 50-period and 200-period SMAs to determine overall trend direction and potential crossover signals.
- Dynamically calculates and plots Fibonacci retracement levels (38.2%, 50%, 61.8%) based on the highest and lowest prices of the past 50 periods.
- Defines golden cross (short-term MA crossing above long-term MA) and death cross (short-term MA crossing below long-term MA) as potential trend change signals.
- Combines the above indicators to formulate entry and exit conditions:
- Long entry: Golden cross occurs, price is above the 50% Fibonacci level, and RSI is below 70.
- Short entry: Death cross occurs, price is below the 50% Fibonacci level, and RSI is above 30.
- Long exit: RSI exceeds 70.
- Short exit: RSI falls below 30.
Strategy Advantages
- Multi-indicator fusion: By combining RSI, moving averages, and Fibonacci retracements, the strategy can analyze the market from multiple angles, improving signal reliability.
- Trend following: Using golden cross and death cross helps capture the beginning of major trends, enhancing profit potential.
- Risk management: Utilizing RSI’s overbought and oversold zones as stop-loss points effectively controls risk.
- Dynamic adjustment: Fibonacci retracement levels are dynamically adjusted based on recent price fluctuations, allowing the strategy to adapt to different market environments.
- Visualization: The strategy plots key indicators and Fibonacci levels on the chart, enabling traders to intuitively understand market conditions.
Strategy Risks
- False breakouts: In choppy markets, frequent false breakout signals may lead to consecutive losses.
- Lagging indicators: Moving averages and RSI are lagging indicators, which may not respond quickly enough in rapidly changing markets.
- Overtrading: Combining multiple indicators may generate too many trading signals, increasing transaction costs.
- Parameter sensitivity: Strategy performance is highly dependent on chosen parameters, such as RSI period and moving average periods, requiring careful optimization.
- Single timeframe: Operating only on a 15-minute timeframe may overlook important trend information from larger timeframes.
Strategy Optimization Directions
- Multi-timeframe analysis: Introduce larger timeframes (e.g., 1-hour, 4-hour) to confirm main trends and improve signal quality.
- Dynamic parameter adjustment: Automatically adjust RSI and moving average periods based on market volatility to adapt to different market conditions.
- Incorporate volume analysis: Integrate volume indicators like OBV or CMF to validate price trend validity.
- Optimize stop-loss strategy: In addition to using RSI levels, consider using ATR (Average True Range) for setting dynamic stop-losses.
- Introduce machine learning: Use machine learning algorithms to optimize parameter selection and signal generation processes, enhancing strategy adaptability.
- Extend backtesting period: Conduct longer-term backtests under various market conditions to ensure strategy robustness.
- Consider adding sentiment indicators: Such as VIX or Put/Call ratio, to capture trading opportunities arising from market sentiment changes.
Conclusion
This Multi-Timeframe Fibonacci RSI Golden Cross Trend Following Quantitative Trading Strategy demonstrates how to combine multiple classic technical analysis tools to create a complex and comprehensive trading system. By integrating indicators such as RSI, moving average crossovers, and Fibonacci retracements, the strategy aims to capture strong market trends while managing risk using overbought and oversold levels.
While the strategy has the advantage of analyzing the market from multiple angles, there are still potential risks such as false breakout signals and the possibility of overtrading. To further improve the strategy’s performance and robustness, consider introducing multi-timeframe analysis, dynamic parameter adjustment, volume confirmation, and other optimization directions.
Overall, this strategy provides quantitative traders with an excellent starting point, showcasing how different technical indicators can be integrated into a coherent trading system. Through continuous optimization and backtesting, this strategy has the potential to become a powerful trend-following tool suitable for various market conditions.
/*backtest
start: 2024-05-01 00:00:00
end: 2024-05-31 23:59:59
period: 1h
basePeriod: 15m
exchanges: [{"eid":"Futures_Binance","currency":"BTC_USDT"}]
*/

//@version=5
strategy("15min Fibonacci RSI Golden Cross Scalping Strategy", overlay=true)

// Indicators
rsi_length = 14
rsi = ta.rsi(close, rsi_length)

short_ma_length = 50
long_ma_length = 200

short_ma = ta.sma(close, short_ma_length)
long_ma = ta.sma(close, long_ma_length)

// Fibonacci Retracement Levels
var float fibHigh = na
var float fibLow = na
var float fib38 = na
var float fib50 = na
var float fib61 = na

if (ta.change(ta.highest(close, 50)))
    fibHigh := ta.highest(close, 50)
if (ta.change(ta.lowest(close, 50)))
    fibLow := ta.lowest(close, 50)

if (not na(fibHigh) and not na(fibLow))
    fib38 := fibHigh - (fibHigh - fibLow) * 0.382
    fib50 := fibHigh - (fibHigh - fibLow) * 0.50
    fib61 := fibHigh - (fibHigh - fibLow) * 0.618

// Plot indicators
plot(short_ma, title="50-Period SMA", color=color.blue)
plot(long_ma, title="200-Period SMA", color=color.red)
hline(70, "RSI Overbought", color=color.red)
hline(30, "RSI Oversold", color=color.green)
plot(rsi, title="RSI", color=color.blue)

// Fibonacci retracement lines
// var line fib38_line = na
// var line fib50_line = na
// var line fib61_line = na

// if (not na(fib38))
//     line.delete(fib38_line)
//     fib38_line := line.new(x1=bar_index[1], y1=fib38, x2=bar_index, y2=fib38, color=color.yellow, width=1)

// if (not na(fib50))
//     line.delete(fib50_line)
//     fib50_line := line.new(x1=bar_index[1], y1=fib50, x2=bar_index, y2=fib50, color=color.orange, width=1)

// if (not na(fib61))
//     line.delete(fib61_line)
//     fib61_line := line.new(x1=bar_index[1], y1=fib61, x2=bar_index, y2=fib61, color=color.green, width=1)

// Entry and Exit Conditions
goldenCross = ta.crossover(short_ma, long_ma)
deathCross = ta.crossunder(short_ma, long_ma)

longCondition = goldenCross and close > fib50 and rsi < 70
shortCondition = deathCross and close < fib50 and rsi > 30

if (longCondition)
    strategy.entry("Buy", strategy.long)
if (shortCondition)
    strategy.entry("Sell", strategy.short)

// Close position conditions
if (strategy.position_size > 0 and rsi > 70)
    strategy.close("Buy")
if (strategy.position_size < 0 and rsi < 30)
    strategy.close("Sell")