RSI Oversold Periodic Investment Strategy with Cooldown Optimization
Author: ChaoZhang, Date: 2024-07-31 11:31:45Tags: RSI
Overview
The RSI Oversold Periodic Investment Strategy with Cooldown Optimization is a quantitative trading strategy based on the Relative Strength Index (RSI). This strategy primarily uses the RSI indicator to identify oversold market conditions and executes buy orders when specific criteria are met. The core features of the strategy include using RSI oversold signals, fixed investment amounts, setting a cooldown period, and backtesting functionality. This approach aims to capture market lows while avoiding overtrading through a cooldown mechanism, providing investors with a systematic entry strategy.
Strategy Principles
RSI Calculation: The strategy uses a 14-period RSI as the main technical analysis tool. RSI is a momentum indicator used to measure the speed and change of price movements.
Oversold Determination: When the RSI value falls below a preset threshold (default 30), the market is considered oversold. This usually indicates that the asset may be undervalued and has potential for a rebound.
Buy Conditions: The strategy triggers a buy signal when two conditions are simultaneously met:
- RSI is in an oversold state (below the set threshold)
- At least 30 days (customizable cooldown period) have passed since the last purchase
Fixed Investment Amount: Each trade uses a preset fixed dollar amount (default $1,000) for investment. This method is similar to a dollar-cost averaging strategy, helping to diversify risk.
Cooldown Mechanism: After each purchase, the strategy enforces a 30-day cooldown period. During this time, no buy orders will be executed even if new oversold signals appear. This helps prevent excessive trading in the short term.
Backtesting: The strategy allows users to set a start date for backtesting, defaulting to 1000 days ago. This provides flexibility in evaluating the strategy’s performance under different market conditions.
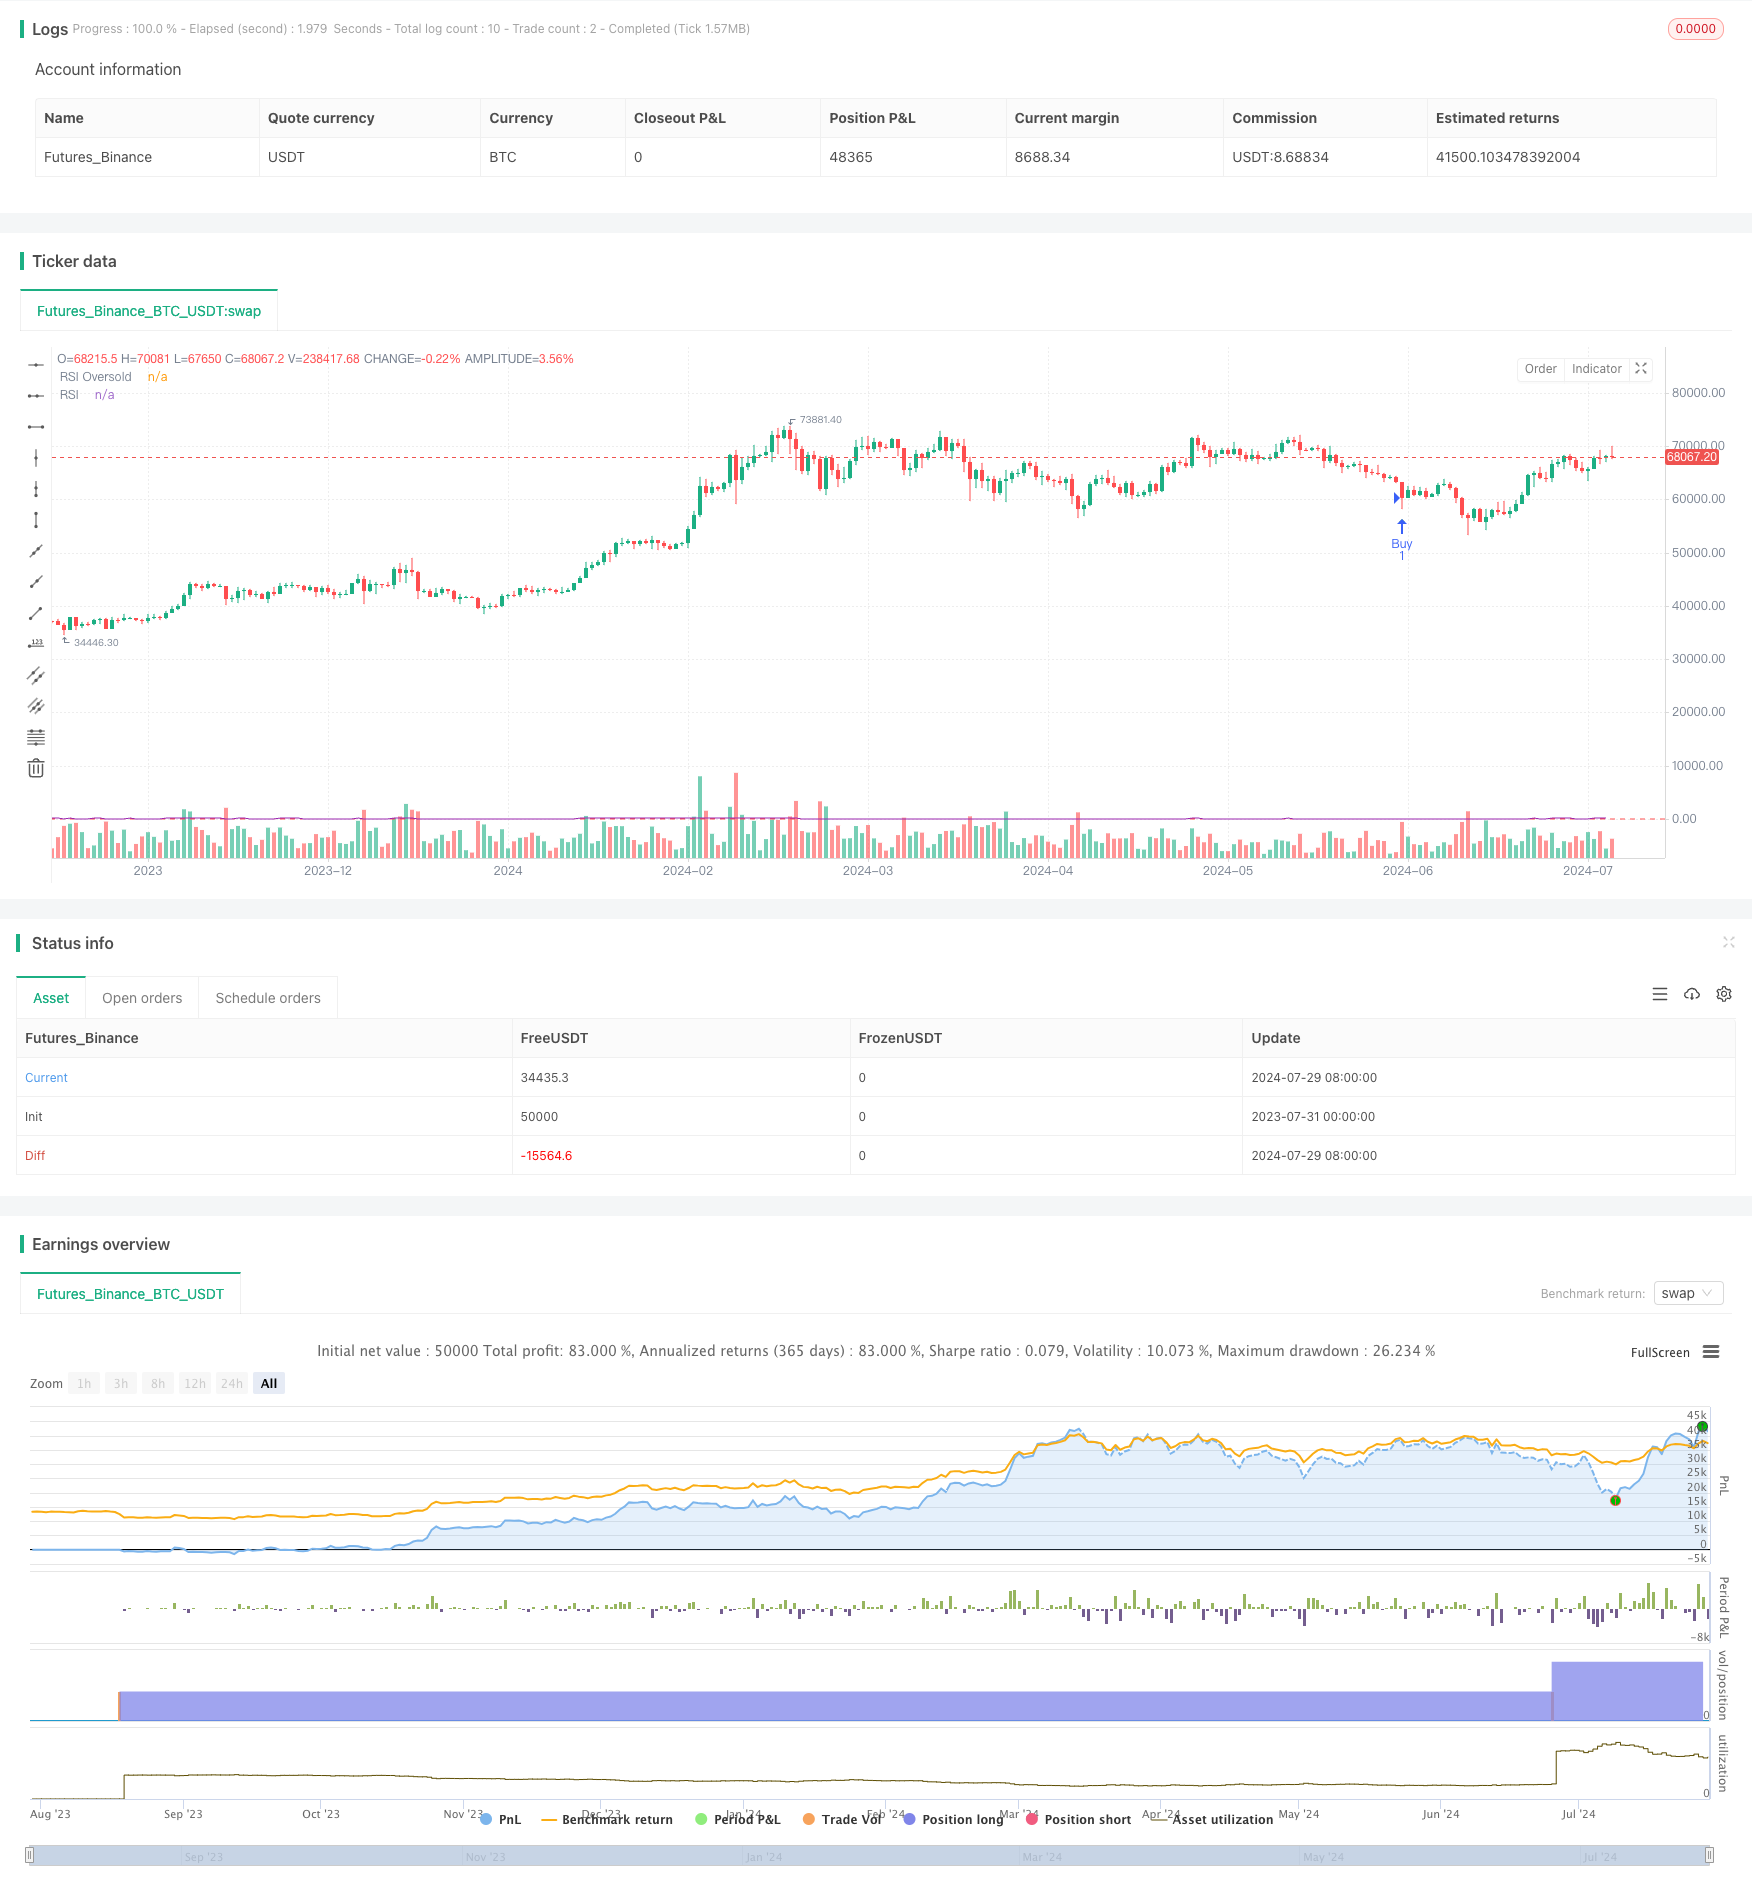
Visual Display: The strategy marks buy points on the chart, displays the RSI curve and oversold threshold line, and shows a summary of strategy execution at the end of the chart, including total investment amount, total assets acquired, average purchase cost, and total number of trades.
Strategy Advantages
Systematic Decision-Making: Through clear rules and indicators, the strategy eliminates subjective judgment, providing an objective and repeatable trading method.
Capturing Market Lows: By utilizing RSI oversold signals, the strategy aims to enter when asset prices are undervalued, increasing profit potential.
Risk Management: Fixed investment amounts and cooldown mechanisms help control risk, preventing overtrading and capital concentration.
Adapting to Market Cycles: The 30-day cooldown period helps the strategy adapt to longer market cycles, avoiding frequent trading during short-term fluctuations.
Simplicity: The strategy logic is intuitive, easy to understand and implement, suitable for investors of different experience levels.
Flexibility: Multiple customizable parameters allow investors to adjust the strategy according to personal preferences and market conditions.
Visual Feedback: Through chart markings and summary information, investors can visually assess strategy performance.
Strategy Risks
Market Trend Neglect: The strategy primarily based on the RSI indicator may ignore overall market trends, potentially leading to frequent buying in strong downward trends.
Missed Opportunities: The 30-day cooldown period may cause missing some potential good opportunities, especially in rapidly changing markets.
Single Indicator Dependence: Over-reliance on RSI may cause the strategy to perform poorly under certain market conditions, ignoring other important market signals.
Lack of Selling Mechanism: The strategy focuses only on buying, lacking clear selling or stop-loss mechanisms, which may lead to continued expansion of losses.
Fixed Investment Amount Limitation: Using a fixed amount may not fully utilize large funds or adapt to different portfolio sizes.
Backtest Bias: The strategy’s backtest results may be affected by survivorship bias and overfitting, actual performance may differ from backtest results.
Trading Cost Neglect: The strategy does not consider transaction fees and slippage, which may significantly affect actual returns during frequent trading.
Strategy Optimization Directions
Introduce Trend Filters: Combine moving averages or MACD and other trend indicators to avoid frequent buying in strong downward trends.
Dynamic Cooldown Period: Adjust the length of the cooldown period based on market volatility, shortening it in high volatility periods and extending it in low volatility periods.
Multi-Indicator Integration: Combine other technical indicators such as Bollinger Bands, volume, etc., to build more comprehensive entry signals.
Add Selling Strategy: Design a selling mechanism that matches the buying strategy, such as based on RSI overbought signals or setting take-profit and stop-loss levels.
Capital Management Optimization: Introduce dynamic position management, adjusting investment amounts based on market conditions and account size.
Parameter Optimization: Use machine learning techniques to dynamically adjust RSI periods and oversold thresholds to adapt to different market environments.
Incorporate Fundamental Factors: Consider incorporating macroeconomic indicators or sentiment indicators into the decision-making process to enhance strategy comprehensiveness.
Risk Control Enhancement: Introduce maximum drawdown limits and overall risk exposure control to improve strategy robustness.
Backtest Framework Improvement: Consider trading costs, slippage, and conduct comprehensive backtests across markets and time periods to increase strategy reliability.
Conclusion
The RSI Oversold Periodic Investment Strategy with Cooldown Optimization provides investors with a systematic, quantifiable trading method. By combining RSI oversold signals, fixed investment amounts, and a cooldown mechanism, the strategy aims to capture market lows while controlling risk. Its simple and intuitive logic makes it easy to understand and implement, while customizable parameters provide flexibility.
However, the strategy also has some limitations and risks, such as potentially ignoring overall market trends, over-reliance on a single indicator, and lack of a selling mechanism. To enhance the strategy’s robustness and adaptability, it is recommended to consider introducing trend filters, multi-indicator integration, dynamic parameter adjustment, and other optimization directions.
Overall, this strategy provides investors with a good starting point, but in practical application, investors should make appropriate adjustments and optimizations based on personal risk preferences and market conditions. Through continuous monitoring and improvement, combined with more comprehensive risk management measures, this strategy has the potential to become an effective long-term investment tool.
/*backtest
start: 2023-07-31 00:00:00
end: 2024-07-30 00:00:00
period: 1d
basePeriod: 1h
exchanges: [{"eid":"Futures_Binance","currency":"BTC_USDT"}]
*/

//@version=5
strategy("RSI Buy Strategy with 30-day Cooldown", overlay=true)

// 参数设置
rsiLength = 14
rsiOversold = 30
usdAmount = 1000
cooldownPeriod = 30 * 24 * 60

// 计算RSI
rsi = ta.rsi(close, rsiLength)

// 跟踪上次买入时间
var int lastBuyTime = 0
var bool buySignal = false

daysBack = input.int(1000, title="策略开始天数(从今天往回)", minval=1)
startDate = timenow - daysBack * 24 * 60 * 60 * 1000
isInTradingPeriod = true

// 执行策略
if (isInTradingPeriod and rsi < rsiOversold and (time - lastBuyTime) >= cooldownPeriod * 60000)
    strategy.entry("Buy", strategy.long)
    lastBuyTime := time
    buySignal := true

    // 在交易列表中显示详细信息
    strategy.order("Buy", strategy.long, comment="USD: " + str.tostring(usdAmount))
else
    buySignal := false

// 在买入点显示一个小标记
plotshape(buySignal, title="Buy Signal", location=location.belowbar, color=color.green, style=shape.triangleup, size=size.small)

// 在图表上显示RSI
plot(rsi, "RSI", color=color.purple)
hline(rsiOversold, "RSI Oversold", color=color.red)

// 计算并显示总结
if (barstate.islastconfirmedhistory)
    tradeCount = strategy.opentrades
    totalUsd = usdAmount * tradeCount
    totalBtc = strategy.position_size

    // 计算正确的平均买入成本
    avgCost = totalBtc != 0 ? totalUsd / totalBtc : na

    label.new(bar_index, high, text="\nUSD总量: " + str.tostring(totalUsd) +
              "\nBTC总量: " + str.tostring(totalBtc) +
              "\n买入成本: " + str.tostring(avgCost,"#.##") +
              "\n交易次数: " + str.tostring(tradeCount),
              style=label.style_label_down,
              color=color.new(color.teal, 20),
              textalign="left")
- Dynamic Dual-Indicator Momentum Trend Quantitative Strategy System
- Dual Moving Average-RSI Multi-Signal Trend Trading Strategy
- Dynamic EMA System Combined with RSI Momentum Indicator for Optimized Intraday Trading Strategy
- Multi-Technical Indicator Crossover Momentum Trend Following Strategy
- Dynamic Stop-Loss Adjustment Elephant Bar Trend Following Strategy
- Dual-Period RSI Trend Momentum Strategy with Pyramiding Position Management System
- Dynamic RSI Quantitative Trading Strategy with Multiple Moving Average Crossover
- Dynamic Trend RSI Indicator Crossing Strategy
- Multi-Dimensional KNN Algorithm with Volume-Price Candlestick Pattern Trading Strategy
- Adaptive Multi-Strategy Dynamic Switching System: A Quantitative Trading Strategy Combining Trend Following and Range Oscillation
- Advanced Multi-Indicator Multi-Dimensional Trend Cross Quantitative Strategy
- Multi-Period Moving Average Crossover Strategy with Dynamic Volatility Filter
- Multi-Indicator Comprehensive Momentum Trading Strategy
- Triple EMA with Dynamic Support/Resistance Trading Strategy
- Dual RSI Strategy: Advanced Trend Capture System Combining Divergence and Crossover
- Lorenzian Classification Multi-Timeframe Target Strategy
- Dual Moving Average Trend Capture Strategy with Dynamic Stop-Loss and Filter
- Multi-Indicator Trend Following with Volume Confirmation Strategy
- Adaptive Quantitative Trading Strategy with Dual Moving Average Crossover and Take Profit/Stop Loss
- Elliott Wave and Tom DeMark Trend-Following Trading Strategy
- Multi-Timeframe Unified Strategy Based on Quantitative Momentum and Convergence-Divergence
- Optimized Multi-Timeframe HMA Quantitative Trading Strategy with Dynamic Stop-Loss
- Bollinger Band Crossover with Slippage and Price Impact Combined Strategy
- Trend Structure Break with Order Block and Fair Value Gap Strategy
- Adaptive Dynamic Stop-Loss and Take-Profit Strategy with SMA Crossover and Volume Filter
- Dual MACD Trend Confirmation Trading System
- High/Low Breakout Strategy with Alpha Trend and Moving Average Filter
- Multi-Candlestick Pattern Recognition and Trading Strategy
- Multi-EMA Crossover Strategy with Trend Confirmation
- Momentum-Driven EMA-RSI Crossover Strategy
- Multi-Indicator Dynamic Trading Strategy