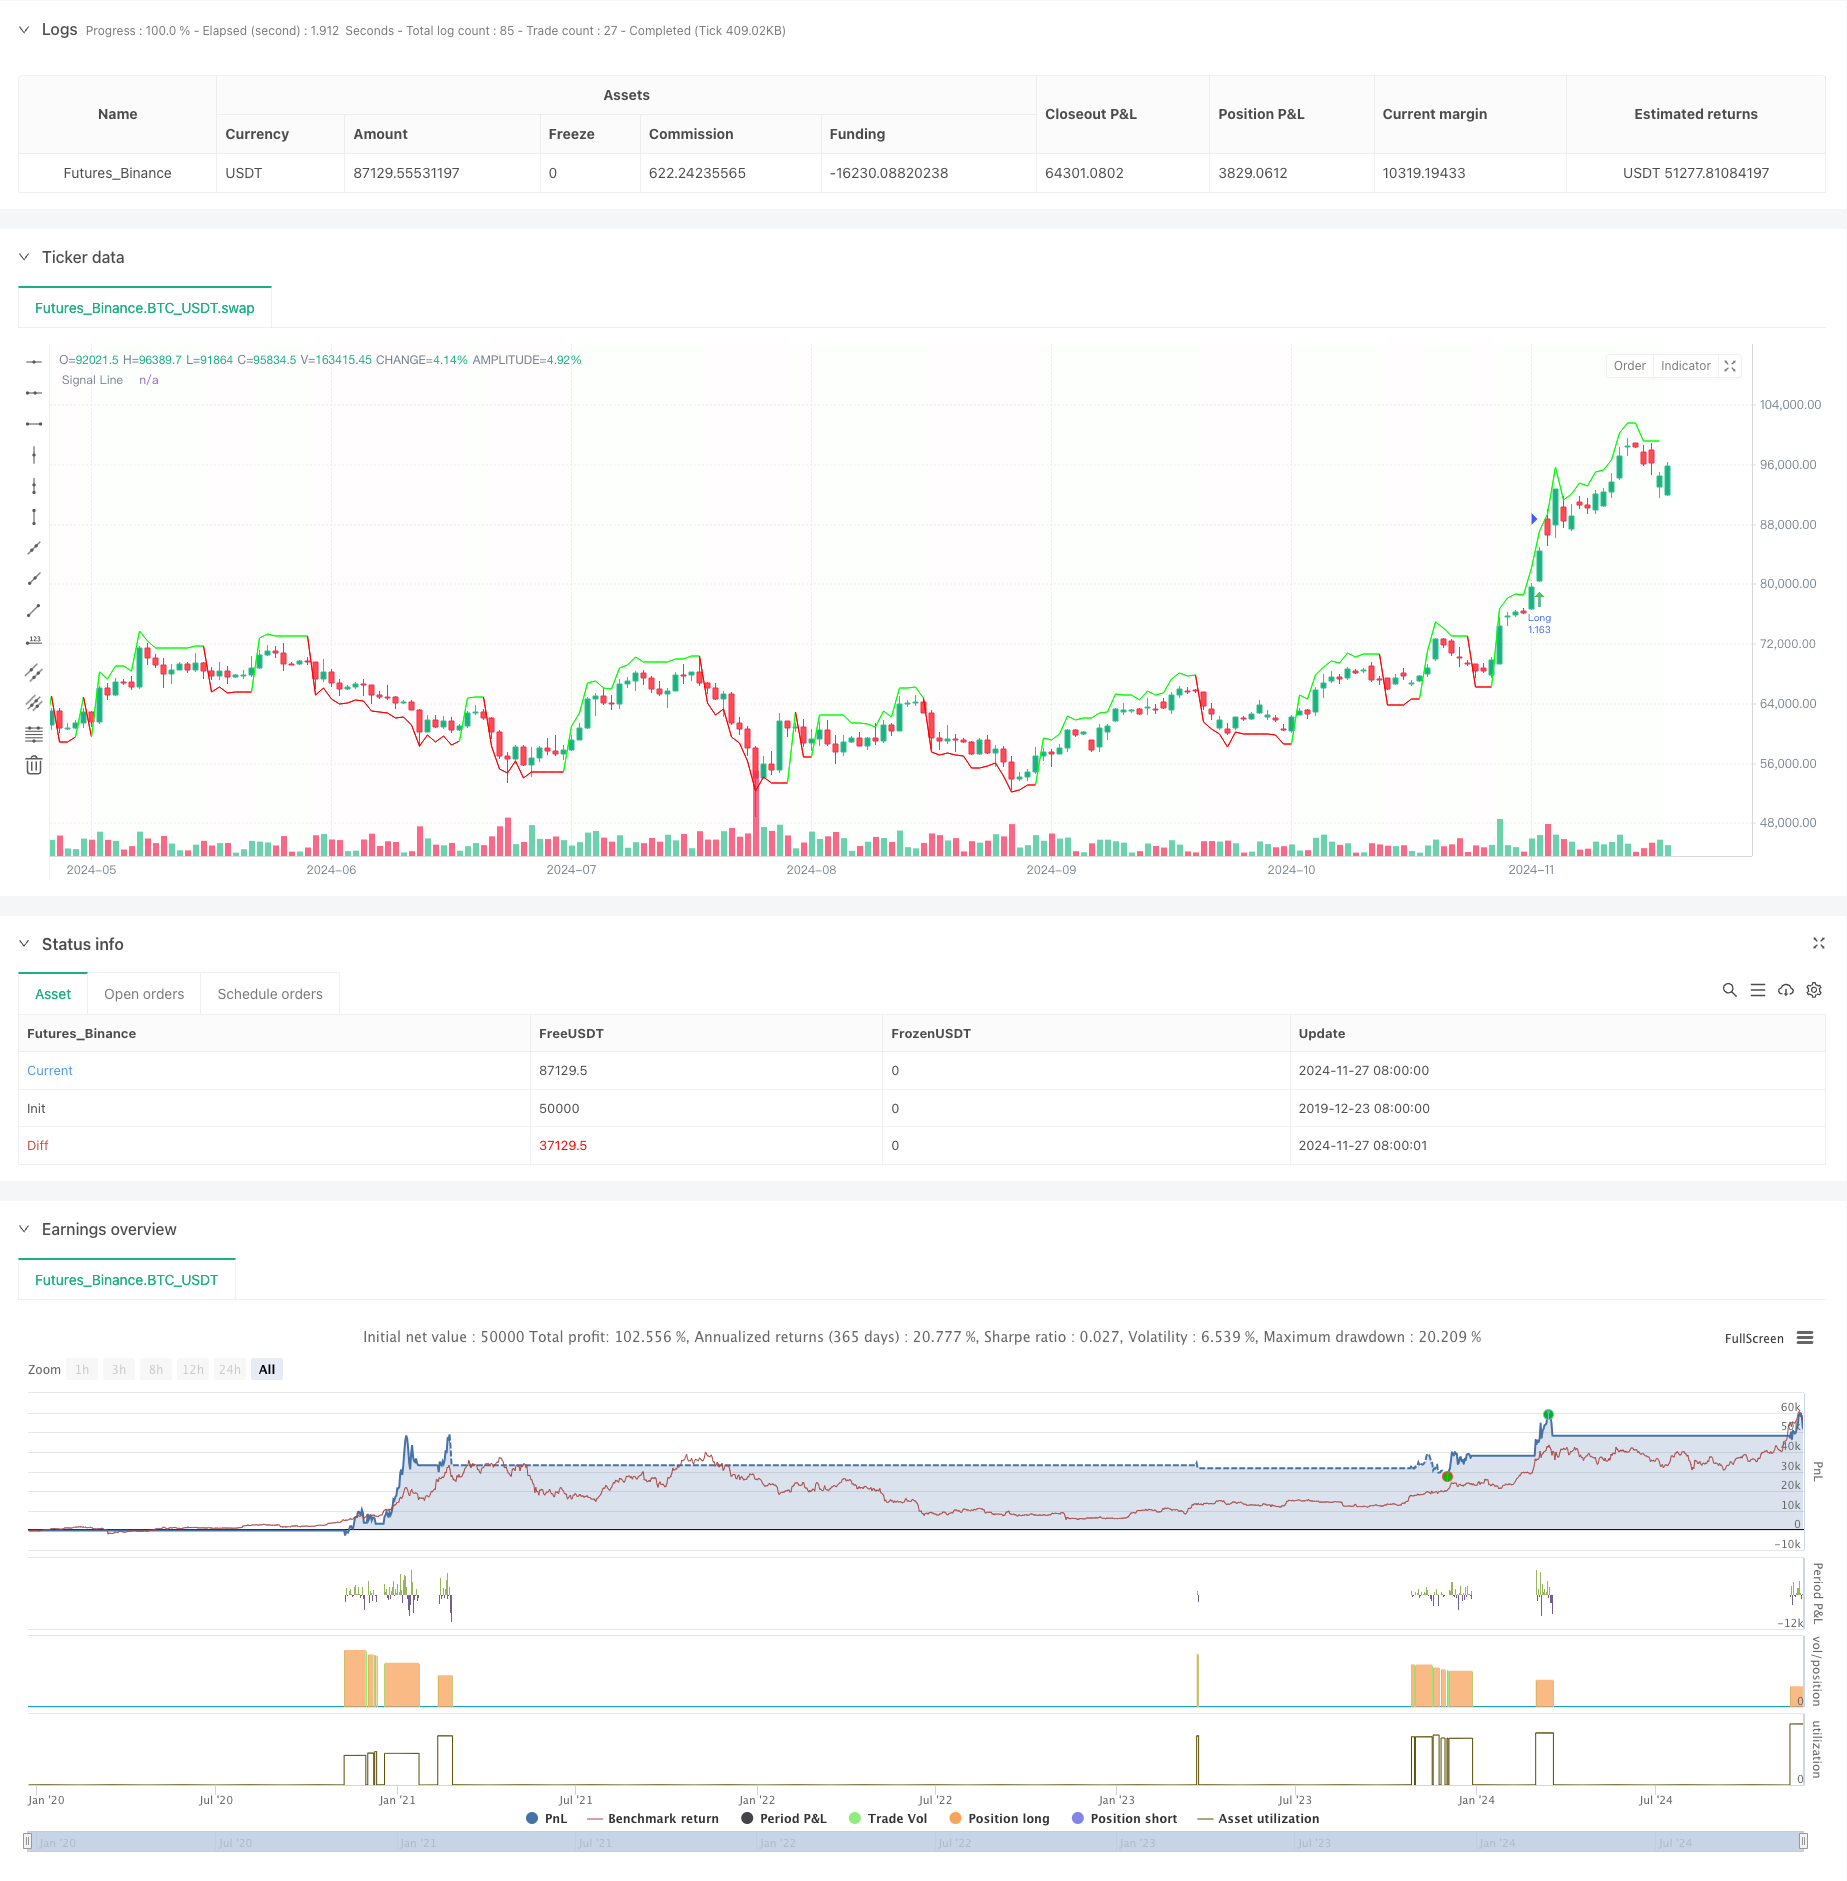
Overview
This strategy is a trading system based on multi-timeframe analysis, combining Bollinger Bands, Hull Moving Average, and Weighted Moving Average for generating trading signals. The strategy operates primarily on the 1-hour timeframe while integrating market data from 5-minute, 1-hour, and 3-hour periods. It uses multiple technical indicators to confirm trading opportunities and implements dynamic stop-loss and take-profit mechanisms, automatically adjusting position sizes based on account equity for effective risk control.
Strategy Principles
The core logic is based on cross-confirmation of multiple technical indicators. The strategy monitors price relationships with various moving averages across multiple timeframes, including 5-minute VWMA, 1-hour VWMA, and 3-hour HMA. Long signals are generated when price breaks above the upper threshold while being above all timeframe indicators; conversely, short signals occur when price breaks below the lower threshold while being below all indicators. The strategy incorporates deviation calculations for setting dynamic entry and exit thresholds, enhancing trading flexibility.
Strategy Advantages
- Multi-timeframe analysis reduces false breakout risks and improves signal reliability
- Dynamic stop-loss and take-profit settings adapt to different market conditions
- Position sizing based on account equity ensures rational capital utilization
- Multiple exit mechanisms provide strategy adaptability
- Graphical interface offers clear trading signal visualization for analysis
- Integration of multiple mature technical indicators enhances trading decision accuracy
Strategy Risks
- Multiple indicators may lead to delayed trading signals
- Frequent false breakouts possible in ranging markets
- Fixed stop-loss and take-profit ratios may not suit all market conditions
- Multi-timeframe data processing may increase strategy complexity
- High slippage risk in volatile markets
Optimization Directions
- Introduce volatility indicators for dynamic stop-loss and take-profit adjustments
- Add market condition recognition for parameter adaptation
- Optimize signal filtering to reduce false breakout losses
- Incorporate volume analysis for improved breakout signal reliability
- Develop adaptive parameter optimization mechanisms for enhanced stability
Summary
The strategy constructs a relatively complete trading system through multi-timeframe analysis and multiple technical indicators. Its strengths lie in signal reliability and effective risk management, though it faces challenges with signal lag and parameter optimization. Through continuous improvement and optimization, the strategy shows potential for maintaining stable performance across various market conditions.
/*backtest
start: 2019-12-23 08:00:00
end: 2024-11-28 00:00:00
period: 1d
basePeriod: 1d
exchanges: [{"eid":"Futures_Binance","currency":"BTC_USDT"}]
*/

//@version=5
strategy("1H- 280, 2.7", overlay=true)


// Fetch the indicator values from different timeframes
vwma5 = request.security(syminfo.tickerid, "5", ta.wma(close, 233), lookahead = barmerge.lookahead_off)
vwma_hourly = request.security(syminfo.tickerid, "60", ta.wma(close, 89), lookahead = barmerge.lookahead_off)
hullma155_3h = request.security(syminfo.tickerid, "180", ta.hma(close, 155), lookahead = barmerge.lookahead_off)


// Calculate the deviation value
deviation = close * 0.032


// Initialize the signal variables
var float signalLine = na
var color lineColor = na


// Long Entry Conditions
longCondition_5min = close > vwma5
longCondition_hourly = close > vwma_hourly
longCondition_3h = close > hullma155_3h


// Short Entry Conditions
shortCondition_5min = close < vwma5
shortCondition_hourly = close < vwma_hourly
shortCondition_3h = close < hullma155_3h


// Long Entry
if longCondition_5min and longCondition_hourly and longCondition_3h
    signalLine := close + deviation
    lineColor := color.rgb(0, 255, 0, 1)


// Short Entry
if shortCondition_5min and shortCondition_hourly and shortCondition_3h
    signalLine := close - deviation
    lineColor := color.rgb(255, 0, 0, 1)


// Plotting the connecting line
plot(signalLine, title="Signal Line", color=lineColor, linewidth=1, style=plot.style_line)


// Colorize the signal line
bgcolor(signalLine > close ? color.rgb(0, 255, 0, 99) : color.rgb(255, 0, 0, 99), transp=90)


// Strategy settings
useTPSL = input(true, "Use TP/SL for closing long positions?")
useDownbreakOutbreak = input(false, "Use Downbreak and Outbreak for closing positions?")
useM7FClosing = input(false, "Use M7F Signal for closing positions?")


length1 = input.int(280, minval=1)
src = input(close, title="Source")
mult = input.float(2.7, minval=0.001, maxval=50, title="StdDev")


basis = ta.vwma(src, length1)
dev = mult * ta.stdev(src, length1)
upper = basis + dev
lower = basis - dev


offset = input.int(0, "Offset", minval = -500, maxval = 500)


length2 = input.int(55, minval=1)
src2 = input(close, title="Source")
hullma = ta.wma(2 * ta.wma(src2, length2 / 2) - ta.wma(src2, length2), math.floor(math.sqrt(length2)))


hullmacrosslower = ta.crossover(hullma, lower)
hullmacrossupper = ta.crossunder(hullma, upper)


breakout = ta.crossover(ohlc4, upper)
breakdown = ta.crossunder(ohlc4, upper)
outbreak = ta.crossover(ohlc4, lower)
downbreak = ta.crossunder(ohlc4, lower)


// Calculate position size and leverage
margin_pct = 1
leverage = 1
position_size = strategy.equity * margin_pct
qty = position_size / close / leverage


// Define take profit and stop loss levels
take_profit = 0.14
stop_loss = 0.06


// Opening a long position
if breakout
    strategy.entry("Long", strategy.long, qty, limit=close*(1+take_profit), stop=close*(1-stop_loss))


// Opening a short position
if downbreak
    strategy.entry("Short", strategy.short, qty, limit=close*(1-take_profit), stop=close*(1+stop_loss))


// Closing positions based on chosen method
if useTPSL
    // Using TP/SL for closing long positions
    if strategy.position_size > 0 and breakdown
        strategy.close("Long", comment="Breakdown")
else if useDownbreakOutbreak
    // Using Downbreak and Outbreak for closing positions
    if strategy.position_size > 0 and (breakdown or downbreak)
        strategy.close("Long", comment="Breakdown")
    if strategy.position_size < 0 and (outbreak or downbreak)
        strategy.close("Short", comment="Outbreak")
else if useM7FClosing
    // Using M7F Signal for closing positions
    if strategy.position_size > 0 and (signalLine < close)
        strategy.close("Long", comment="M7F Signal")
    if strategy.position_size < 0 and (signalLine > close)
        strategy.close("Short", comment="M7F Signal")


// Plotting entry signals
plotshape(hullmacrosslower, title="High Bear Volatility", style=shape.arrowup, text="^^^^^", color=color.rgb(75, 202, 79), location=location.belowbar)
plotshape(hullmacrossupper, title="High Bull Volatility", style=shape.arrowdown, text="-----", color=color.rgb(215, 72, 72), location=location.abovebar)
plotshape(breakout ? 1 : na, title="Breakout", style=shape.arrowup, text="", color=color.rgb(75, 202, 79), location=location.belowbar, size=size.tiny)
plotshape(breakdown ? 1 : na, title="Breakdown", style=shape.arrowdown, text="", color=color.rgb(201, 71, 71), location=location.abovebar, size=size.tiny)
plotshape(outbreak ? 1 : na, title="Outbreak", style=shape.arrowup, text="", color=color.rgb(0, 110, 255), location=location.belowbar, size=size.tiny)
plotshape(downbreak ? 1 : na, title="Downbreak", style=shape.arrowdown, text="", color=color.rgb(255, 111, 0), location=location.abovebar, size=size.tiny)