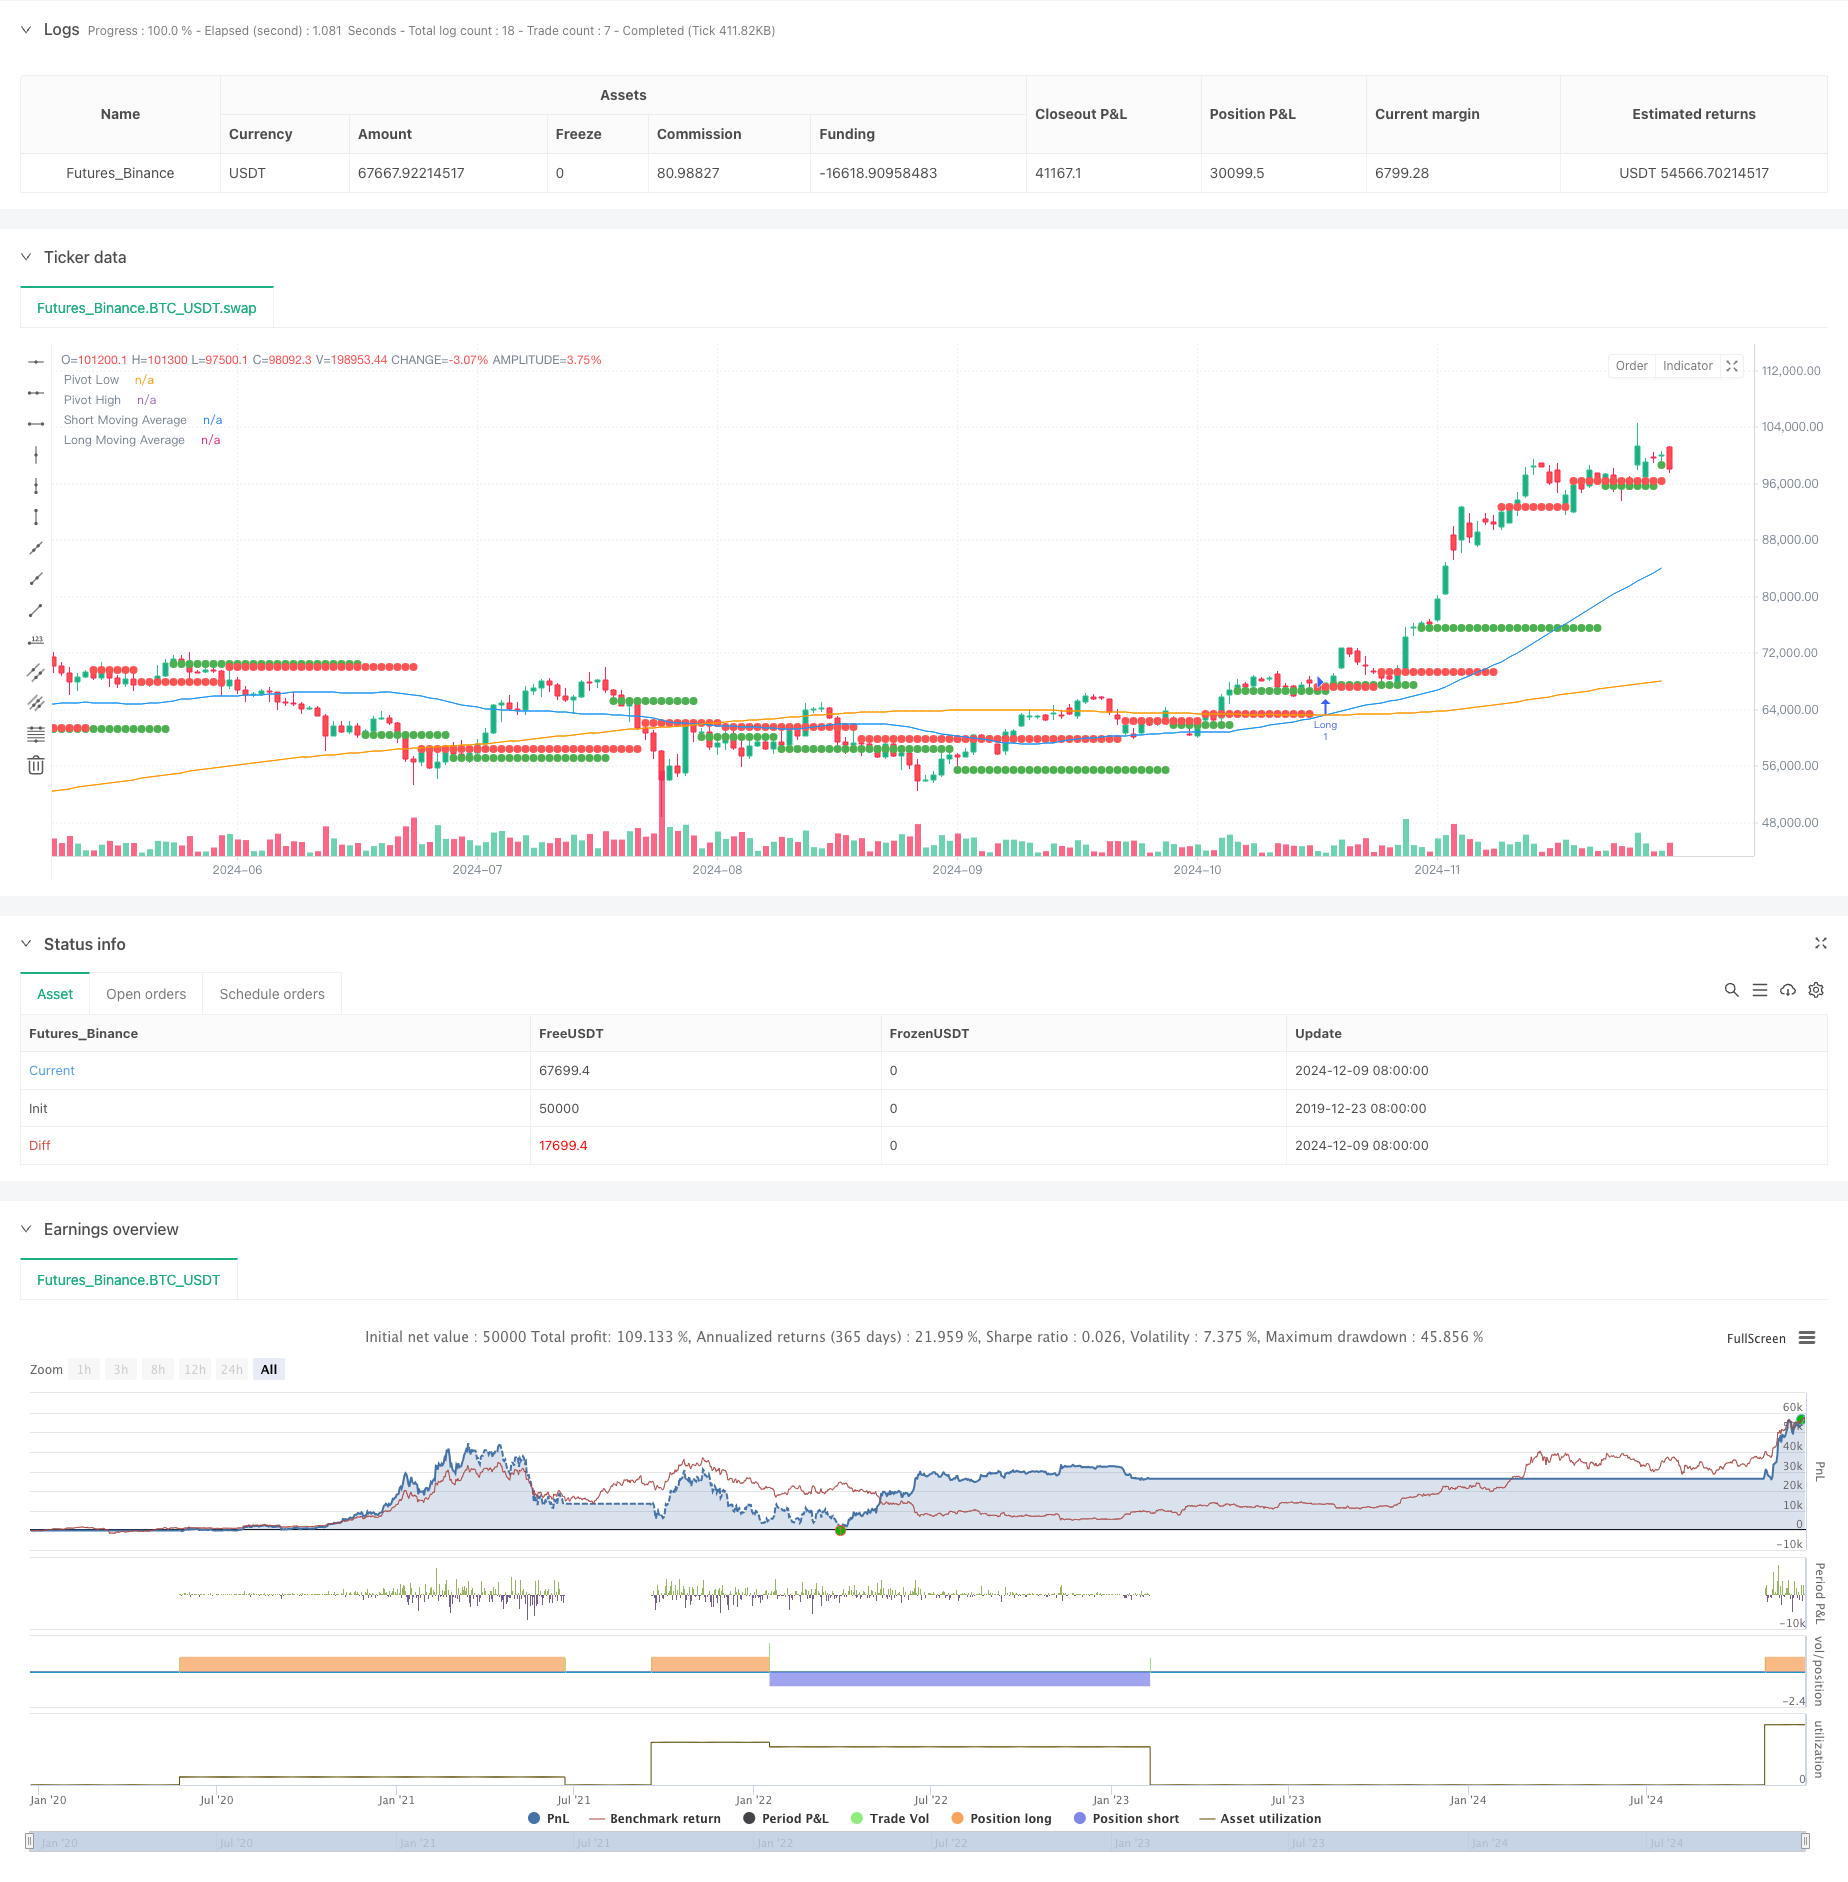
Dynamic Pivot Points with Golden Cross Optimization System
Author: ChaoZhang, Date: 2024-12-12 16:12:42Tags: MASMAGCDC

Overview
This strategy is a quantitative trading system that combines pivot point theory and moving average crossover signals in technical analysis. The strategy identifies key support and resistance levels in the market, combined with crossover signals from short-term and long-term moving averages to capture trading opportunities during market trend changes. The system uses 50-day and 200-day moving averages as primary indicators, optimizing entry and exit timing through dynamic pivot point tracking.
Strategy Principles
The core logic of the strategy is based on two main components: pivot point analysis and moving average crossover signals. The system uses a 5-period cycle for pivot point calculation, dynamically identifying market highs and lows through ta.pivothigh and ta.pivotlow functions. Meanwhile, it generates golden cross and death cross signals using the crossover of 50-day and 200-day simple moving averages. Long signals are generated when the short-term moving average crosses above the long-term moving average and price breaks above recent pivot highs; short signals are generated when the short-term moving average crosses below the long-term moving average and price breaks below recent pivot lows.
Strategy Advantages
- High signal reliability: Combines pivot points and moving average crossovers for double confirmation, significantly improving trading signal reliability.
- Strong dynamic adaptability: Dynamic pivot point calculation allows the strategy to adapt to different market environments.
- Comprehensive risk control: Uses long-term moving average as a trend filter, effectively reducing false breakout risks.
- Clear execution logic: Entry and exit conditions are well-defined, facilitating live trading and backtesting verification.
- Large parameter optimization space: Key parameters can be optimized according to different market characteristics.
Strategy Risks
- Choppy market risk: May generate frequent false breakout signals during consolidation phases.
- Lag risk: Moving averages have inherent lag, potentially causing delayed entry and exit timing.
- Parameter sensitivity: Choice of pivot point period and moving average periods significantly impacts strategy performance.
- Market environment dependency: Strategy performs better in strong trend markets but may underperform in ranging markets.
- Drawdown control risk: Requires additional stop-loss mechanisms to control maximum drawdown.
Strategy Optimization Directions
- Introduce volatility filtering: Recommend adding ATR indicator for dynamic position sizing and stop-loss placement.
- Optimize pivot point calculation: Consider using adaptive periods for pivot point calculation to improve accuracy.
- Add trend strength confirmation: Suggest incorporating ADX or similar trend strength indicators to filter weak market signals.
- Improve money management: Recommend dynamic position sizing based on market volatility.
- Enhance exit mechanism: Can add trailing stops to protect profits.
Summary
The strategy builds a logically rigorous and risk-controlled quantitative trading system by combining classical technical analysis methods. Its core advantage lies in improving trading reliability through multiple signal confirmations, while attention must be paid to adaptability in different market environments. Through the suggested optimization directions, the strategy’s stability and profitability can be further enhanced. The strategy is suitable for markets with clear trends, and investors need to optimize parameters according to specific market characteristics when implementing.
/*backtest
start: 2019-12-23 08:00:00
end: 2024-12-10 08:00:00
period: 1d
basePeriod: 1d
exchanges: [{"eid":"Futures_Binance","currency":"BTC_USDT"}]
*/

//@version=5
strategy("Pivot Points & Golden Crossover Strategy", overlay=true)

// Inputs
length_short = input.int(50, title="Short Moving Average (Golden Cross)")
length_long = input.int(200, title="Long Moving Average (Golden Cross)")
pivot_length = input.int(5, title="Pivot Point Length")
lookback_pivots = input.int(20, title="Lookback Period for Pivots")

// Moving Averages
short_ma = ta.sma(close, length_short)
long_ma = ta.sma(close, length_long)

// Pivot Points
pivot_high = ta.valuewhen(ta.pivothigh(high, pivot_length, pivot_length), high, 0)
pivot_low = ta.valuewhen(ta.pivotlow(low, pivot_length, pivot_length), low, 0)

// Calculate golden crossover
golden_crossover = ta.crossover(short_ma, long_ma)
death_cross = ta.crossunder(short_ma, long_ma)

// Entry and Exit Conditions
long_entry = golden_crossover and close > pivot_high
short_entry = death_cross and close < pivot_low

// Exit conditions
long_exit = ta.crossunder(short_ma, long_ma)
short_exit = ta.crossover(short_ma, long_ma)

// Plot Moving Averages
plot(short_ma, color=color.blue, title="Short Moving Average")
plot(long_ma, color=color.orange, title="Long Moving Average")

// Plot Pivot Levels
plot(pivot_high, color=color.red, linewidth=1, style=plot.style_circles, title="Pivot High")
plot(pivot_low, color=color.green, linewidth=1, style=plot.style_circles, title="Pivot Low")

// Strategy Execution
if (long_entry)
    strategy.entry("Long", strategy.long)
if (long_exit)
    strategy.close("Long")

if (short_entry)
    strategy.entry("Short", strategy.short)
if (short_exit)
    strategy.close("Short")
- MA, SMA, MA Slope, Trailing Stop Loss, Re-Entry
- SMA Dual Moving Average Trading Strategy
- Moving Average Crossover Strategy
- Moving Average Crossover Strategy
- Trend Catcher Strategy
- MA Cross Strategy
- Moving Average Crossover Strategy Based on Dual Moving Averages
- MA,SMA Dual Moving Average Crossover Strategy
- Multi-Moving Average Trend Trading Strategy
- Dual Moving Average Crossover Adaptive Parameter Trading Strategy
- Dynamic ATR Trend Following Strategy Based on Support Breakout
- Multiple Moving Average and Stochastic Oscillator Crossover Quantitative Strategy
- Adaptive Trend Following and Reversal Detection Strategy: A Quantitative Trading System Based on ZigZag and Aroon Indicators
- Multi-Indicator Synergistic Trading Strategy with Bollinger Bands, Fibonacci, MACD and RSI
- Mean Reversion Bollinger Band Dollar-Cost Averaging Investment Strategy
- Multi-dimensional Gold Friday Anomaly Strategy Analysis System
- Multi-Timeframe Trend Dynamic ATR Tracking Strategy
- Moving Average Crossover with RSI Trend Momentum Tracking Strategy
- Dynamic ATR-based Trailing Stop Trading Strategy
- Momentum Trend Following MACD-RSI Dual Confirmation Trading Strategy
- Multi-Indicator Trend Following Strategy with Bollinger Bands and ATR Dynamic Stop Loss
- Dynamic Trend Following ATR Multi-Period Trading Strategy
- Multi-Indicator Trend Following Strategy with Dynamic Channel and Moving Average Trading System
- Multi-EMA Trend Following Strategy with SMMA Confirmation
- Multi-Indicator Trend Trading System with Momentum Analysis Strategy
- Trend-Following Cloud Momentum Divergence Strategy
- Multi-Indicator Trend Following and Volatility Breakout Strategy
- Multi-Market Adaptive Multi-Indicator Trend Following Strategy
- Dynamic Timing and Position Management Strategy Based on Volatility
- EMA-MACD Composite Strategy for Trend Scalping