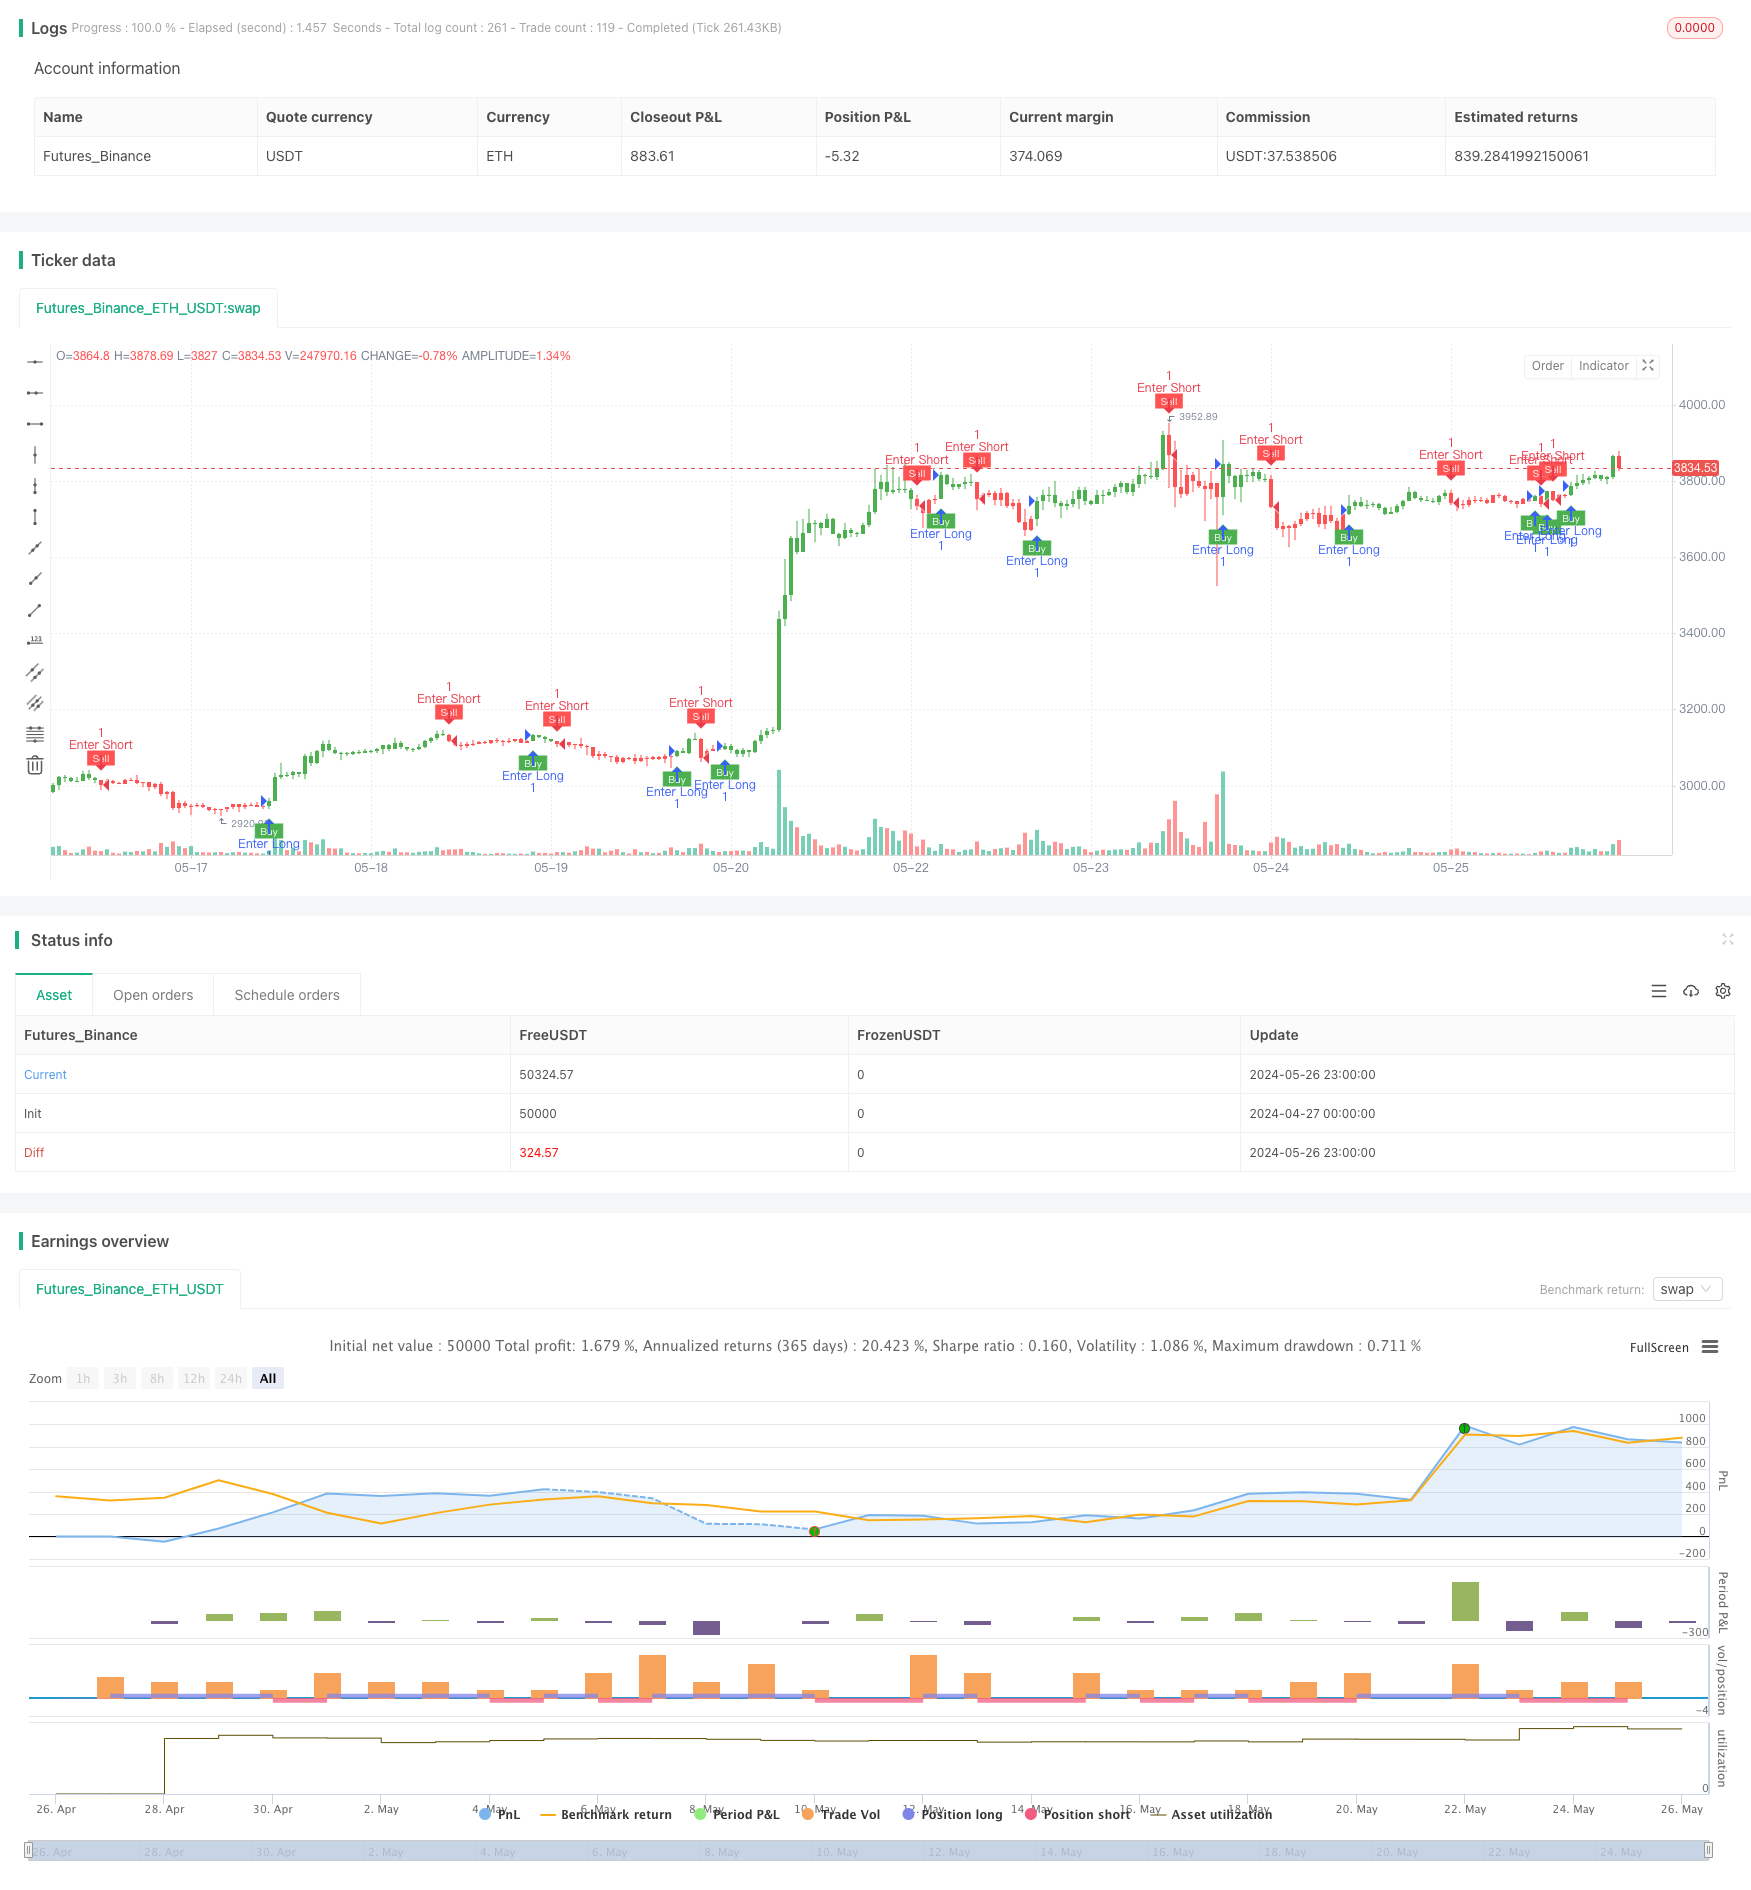
Aperçu
La stratégie utilise deux indicateurs, l’ATR et l’EMA, pour s’adapter à la volatilité du marché en ajustant dynamiquement le point d’arrêt. L’idée principale de la stratégie est d’utiliser l’indicateur ATR pour mesurer la volatilité du marché et de définir un point d’arrêt en fonction de la taille de la volatilité.
Principe de stratégie
- Calculer l’indicateur ATR pour mesurer la taille de la volatilité du marché.
- Le point de rupture dynamique est calculé en fonction de la valeur de l’ATR et des paramètres multiplicatifs de l’entrée.
- Utilisez l’indicateur EMA comme condition de filtrage, ouvrez des ordres en surplus lorsque le prix franchit l’EMA vers le haut et des ordres vides lorsque le prix franchit l’EMA vers le bas.
- Lors de la tenue d’une position, l’arrêt-stop est constamment ajusté en fonction de la variation du prix et de la variation du point de rupture dynamique.
- Lorsque le prix atteint le point d’arrêt dynamique, le plafonnement et la rétrogradation de la position sont effectués.
Avantages stratégiques
- Adaptabilité: en ajustant dynamiquement le point d’arrêt, la stratégie peut s’adapter aux variations de la volatilité dans différentes conditions de marché et contrôler le risque.
- Le suivi des tendances est très efficace: l’indicateur EMA est utilisé pour déterminer la direction des transactions et capter efficacement les tendances du marché.
- Paramètres réglables: les risques et les bénéfices de la stratégie peuvent être contrôlés de manière flexible en ajustant les paramètres de cycle et de multiplicateur de l’ATR.
Risque stratégique
- Risque de paramétrage: les paramètres de cycle ATR et de multiplicateur ont un impact direct sur la performance de la stratégie. Des paramètres incorrects peuvent entraîner l’échec de la stratégie.
- Risque de marché en crise: dans les marchés en crise, des positions ouvertes fréquentes peuvent entraîner des points de glissement importants et des pertes de frais de traitement.
- Risque de renversement de tendance: lorsque la tendance du marché est inversée, la stratégie peut subir des pertes continues.
Orientation de l’optimisation de la stratégie
- L’introduction de plus d’indicateurs techniques tels que le MACD, le RSI et d’autres pour améliorer la précision des jugements de tendances.
- Optimisation des méthodes de calcul du point de perte de stop, comme l’introduction de stop mobile, de stop à taux dynamique, etc.
- Optimiser les paramètres pour trouver la combinaison optimale de paramètres ATR cycliques et multiplicatifs afin d’améliorer la stabilité et la rentabilité de la stratégie
- Ajout d’un module de gestion des positions permettant de modifier dynamiquement la taille des positions en fonction de la volatilité du marché et du niveau de risque du compte.
Résumer
La stratégie utilise les deux indicateurs ATR et EMA pour s’adapter aux changements de volatilité du marché en ajustant dynamiquement le point d’arrêt et de perte, tout en utilisant l’indicateur EMA pour juger de la direction des transactions. La stratégie possède une forte capacité d’adaptation et de suivi des tendances, mais peut être exposée à certains risques lors de la configuration des paramètres, des chocs de marché et des revirements de tendance.
/*backtest
start: 2024-04-27 00:00:00
end: 2024-05-27 00:00:00
period: 1h
basePeriod: 15m
exchanges: [{"eid":"Futures_Binance","currency":"ETH_USDT"}]
*/

//@version=5
strategy(title='UT MB&SS Bot', overlay=true)

// Inputs
a = input(1, title='Key Value. \'This changes the sensitivity\'')
c = input(10, title='ATR Period')
h = input(false, title='Signals from Heikin Ashi Candles')
stoploss = input(2.0, title='Stop Loss (ATR Multiples)')

xATR = ta.atr(c)
nLoss = a * xATR

src = h ? request.security(ticker.heikinashi(syminfo.tickerid), timeframe.period, close, lookahead=barmerge.lookahead_off) : close

var xATR_trailing_stop = 0.0
iff_1 = src > nz(xATR_trailing_stop[1], 0) ? src - nLoss : src + nLoss
iff_2 = src < nz(xATR_trailing_stop[1], 0) and src[1] < nz(xATR_trailing_stop[1], 0) ? math.min(nz(xATR_trailing_stop[1]), src + nLoss) : iff_1
xATR_trailing_stop := src > nz(xATR_trailing_stop[1], 0) and src[1] > nz(xATR_trailing_stop[1], 0) ? math.max(nz(xATR_trailing_stop[1]), src - nLoss) : iff_2

pos = 0
iff_3 = src[1] > nz(xATR_trailing_stop[1], 0) and src < nz(xATR_trailing_stop[1], 0) ? -1 : nz(pos[1], 0)
pos := src[1] < nz(xATR_trailing_stop[1], 0) and src > nz(xATR_trailing_stop[1], 0) ? 1 : iff_3

xcolor = pos == -1 ? color.red : pos == 1 ? color.green : color.blue

ema = ta.ema(src, 1)
above = ta.crossover(ema, xATR_trailing_stop)
below = ta.crossover(xATR_trailing_stop, ema)

buy = src > xATR_trailing_stop and above
sell = src < xATR_trailing_stop and below

barbuy = src > xATR_trailing_stop
barsell = src < xATR_trailing_stop

plotshape(buy, title='Buy', text='Buy', style=shape.labelup, location=location.belowbar, color=color.new(color.green, 0), textcolor=color.new(color.white, 0), size=size.tiny)
plotshape(sell, title='Sell', text='Sell', style=shape.labeldown, location=location.abovebar, color=color.new(color.red, 0), textcolor=color.new(color.white, 0), size=size.tiny)

barcolor(barbuy ? color.green : na)
barcolor(barsell ? color.red : na)

stop_level = pos == 1 ? xATR_trailing_stop - stoploss * xATR : xATR_trailing_stop + stoploss * xATR
stop_level := math.max(stop_level, nz(stop_level[1]))

if pos == 1
    strategy.exit('Exit Long', 'UT Long', stop=stop_level)
else if pos == -1
    strategy.exit('Exit Short', 'UT Short', stop=stop_level)


if buy
    strategy.entry("Enter Long", strategy.long)
else if sell
    strategy.entry("Enter Short", strategy.short)