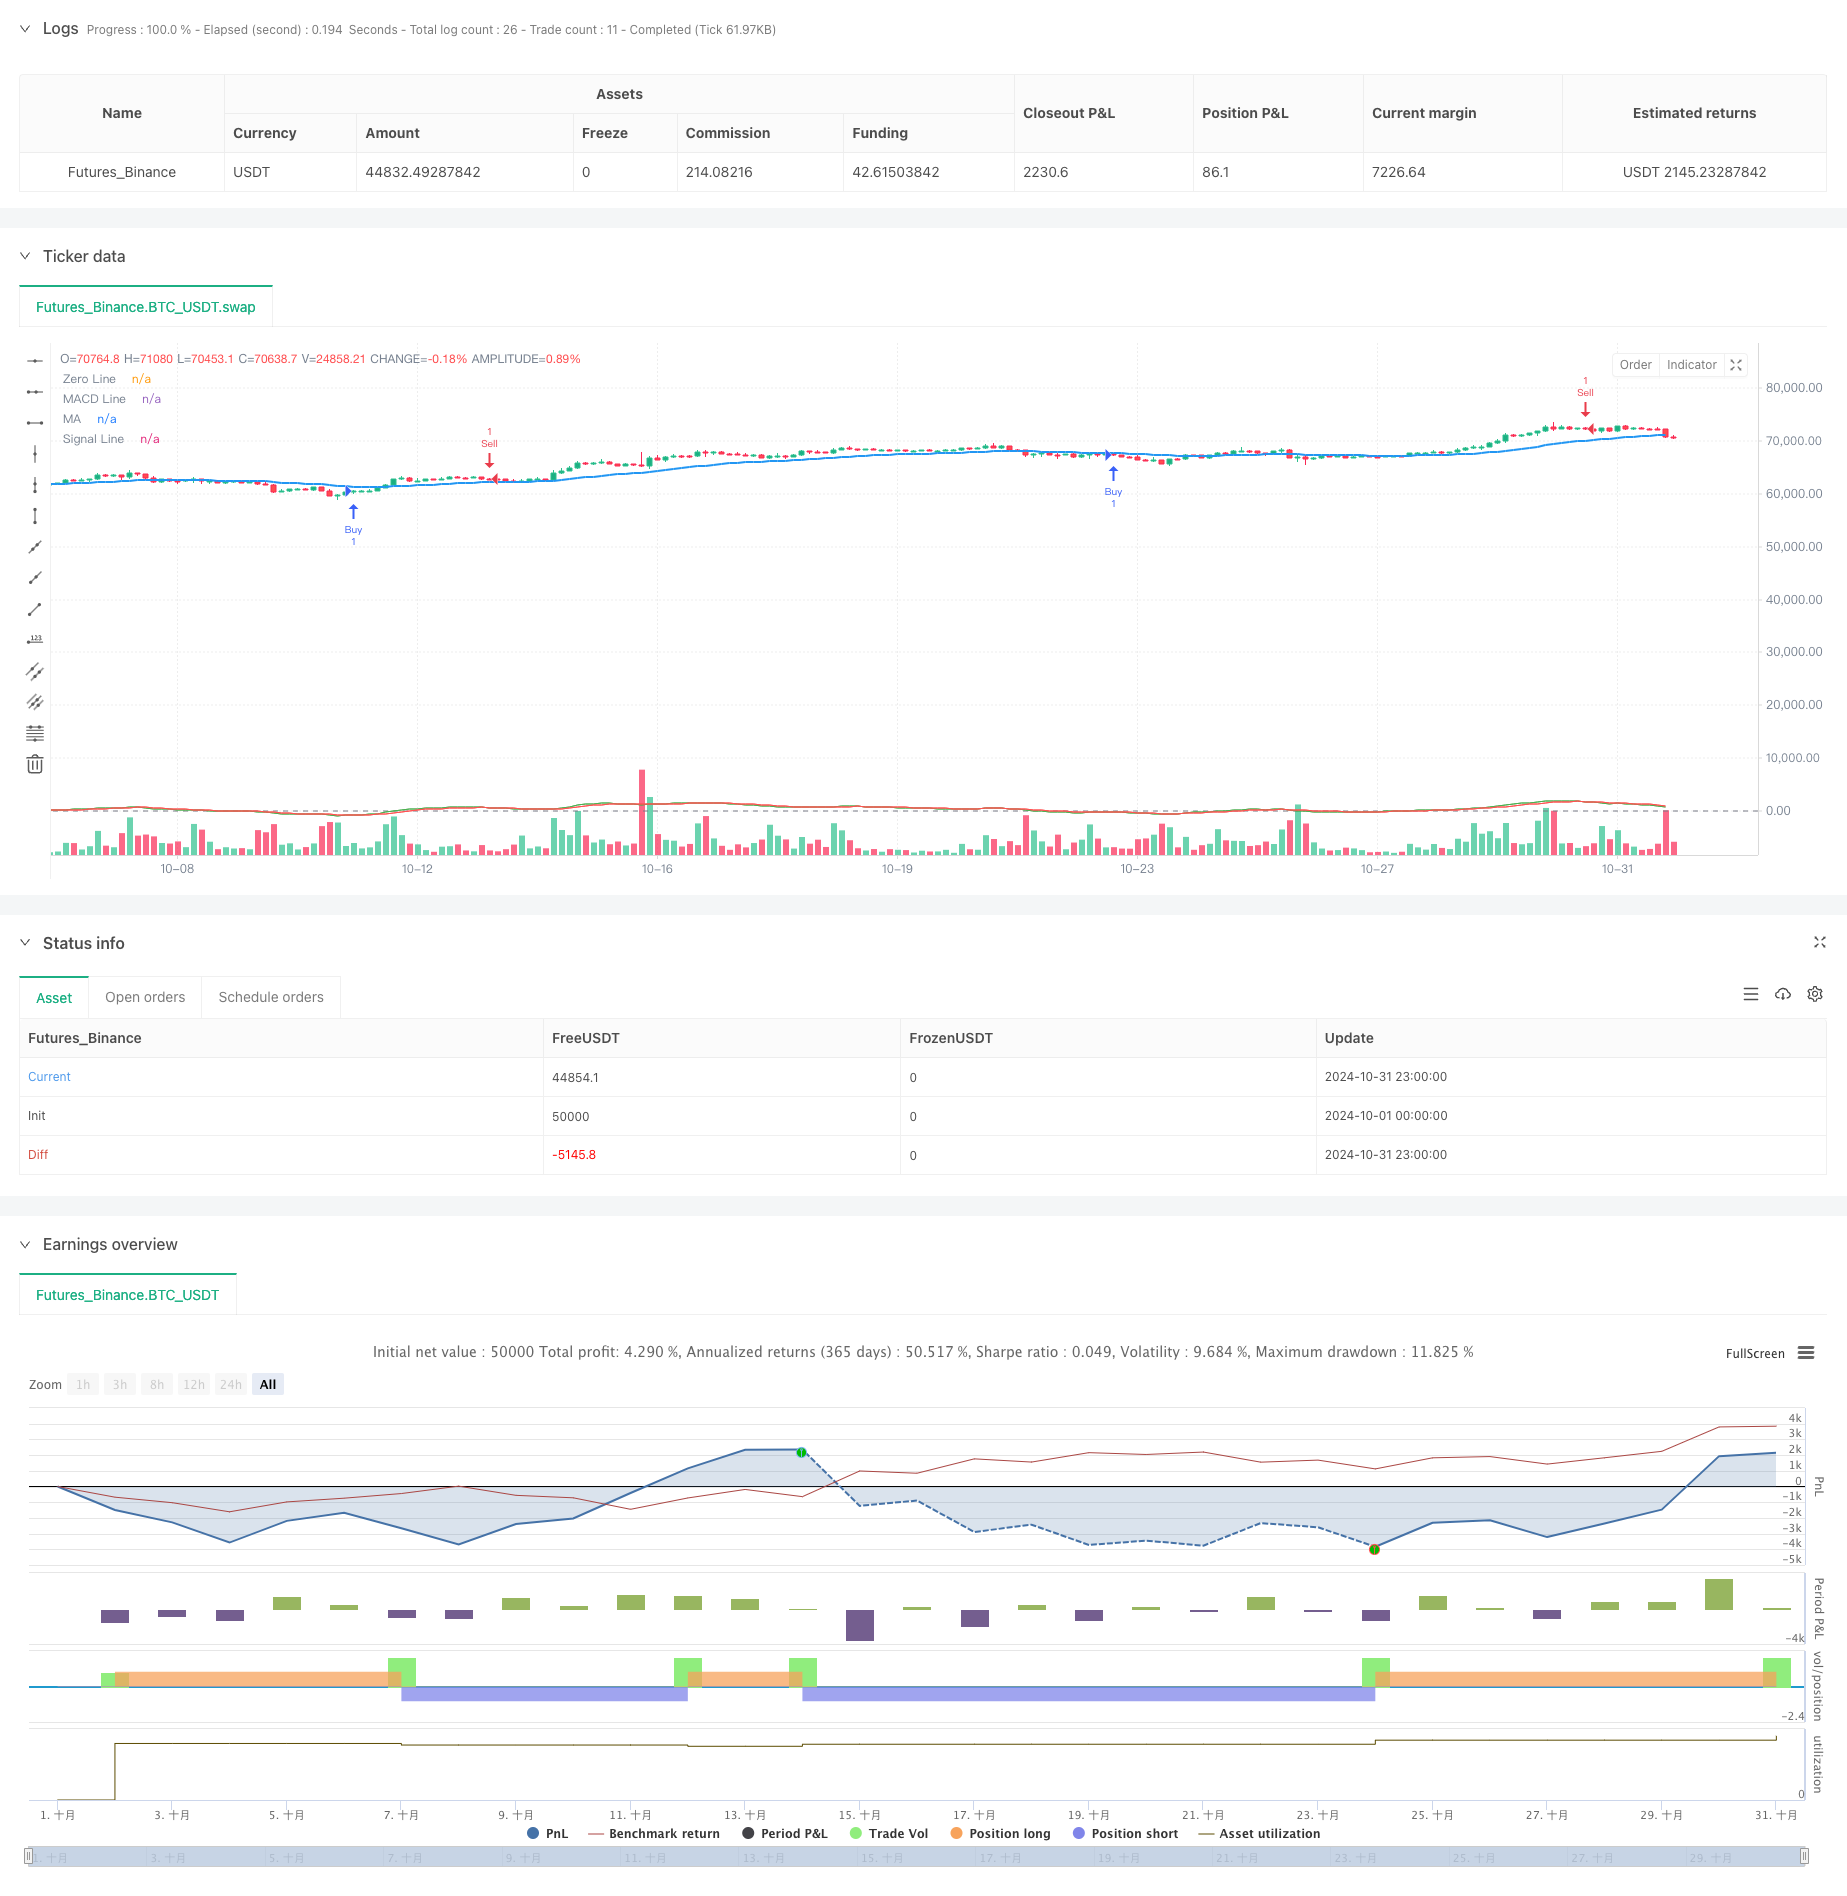
Aperçu
Cette stratégie est une stratégie de trading quantitative combinant la régression des valeurs moyennes et le suivi de la tendance, principalement grâce à l’utilisation combinée des trois indicateurs techniques MA, MACD et ATR pour réaliser la génération de signaux de trading et le contrôle du risque. L’idée centrale de la stratégie est de capturer les opportunités de revirement du marché lorsque les prix s’écartent de la ligne moyenne, en combinaison avec les signaux croisés de l’indicateur MACD, tout en utilisant les arrêts ATR dynamiques pour contrôler le risque.
Principe de stratégie
La stratégie utilise un mécanisme de triple vérification:
- Utilisez la moyenne mobile (MA) pour déterminer la déviation des prix, choisissez SMA ou EMA
- Le moment de la reprise est déterminé par l’indicateur MACD.
- Le paramètre ATR est utilisé pour définir dynamiquement la position de stop loss. Plus précisément, lorsque le prix est inférieur à la moyenne et que le MACD est à la fourche, une position de plus est ouverte; lorsque le prix est supérieur à la moyenne et que le MACD est à la fourche, une position de reprise est ouverte. En outre, le stop loss est automatiquement réglé en fonction de la volatilité de l’ATR.
Avantages stratégiques
- Haute fiabilité du signal: réduction des fausses interférences grâce à la vérification de multiples indicateurs
- Contrôle des risques: utilisation de l’ATR pour arrêter les pertes et éviter les retraits majeurs
- Flexibilité des paramètres: les paramètres peuvent être ajustés en fonction des caractéristiques du marché
- Une logique stratégique claire: les conditions d’entrée et de sortie sont claires, faciles à comprendre et à exécuter
- Adaptabilité: peut être appliquée à différentes périodes de temps et environnements de marché
Risque stratégique
- Les marchés agités pourraient être plus fréquents et augmenter les coûts
- Les réactions à la tendance de basculement pourraient être retardées
- L’optimisation des paramètres comporte un risque de surapprentissage
- Les stop-loss peuvent être plus importants en cas de fortes fluctuations du marché
- L’utilisation simultanée de plusieurs indicateurs peut réduire l’efficacité de la stratégie
Orientation de l’optimisation de la stratégie
- L’introduction d’indicateurs de trafic pour améliorer la fiabilité du signal
- Augmentation des filtres d’intensité de tendance pour éviter les faiblesses
- Optimisation des mécanismes de stop-loss, en tenant compte du trailing stop
- Ajout d’un filtre à volatilité pour ajuster les positions pendant les périodes de forte volatilité
- Développer des mécanismes de paramètres d’adaptation pour améliorer la stabilité de la stratégie
Résumer
Cette stratégie, combinant la régression des moyennes et le suivi des tendances, permet d’obtenir un système de négociation relativement robuste. Le mécanisme de vérification des multiples indicateurs améliore la fiabilité des signaux de négociation, tandis que les arrêts ATR dynamiques maîtrisent bien les risques. Bien qu’il y ait de la place pour l’optimisation, dans l’ensemble, il s’agit d’un cadre stratégique logiquement clair et pratique.
/*backtest
start: 2024-10-01 00:00:00
end: 2024-10-31 23:59:59
period: 3h
basePeriod: 3h
exchanges: [{"eid":"Futures_Binance","currency":"BTC_USDT"}]
*/

//@version=5
strategy("Mean Reversion Strategy with ATR, MACD and MA", overlay=true)

// === Настройки для индикаторов ===
// Параметры скользящей средней (MA)
maLength = input.int(30, title="Период скользящей средней (MA)")
maType = input.string("EMA", title="Тип скользящей средней", options=["SMA", "EMA"])

// Параметры ATR
atrLength = input.int(10, title="Период ATR")
atrMultiplier = input.float(10, title="ATR множитель для стоп-лосса")

// Параметры MACD
macdFastLength = input.int(8, title="Период быстрой EMA для MACD")
macdSlowLength = input.int(26, title="Период медленной EMA для MACD")
macdSignalLength = input.int(5, title="Период сигнальной линии MACD")

// === Рассчёт индикаторов ===
// Скользящая средняя
ma = if maType == "SMA"
    ta.sma(close, maLength)
else
    ta.ema(close, maLength)

// ATR (Средний истинный диапазон)
atr = ta.atr(atrLength)

// MACD
[macdLine, signalLine, _] = ta.macd(close, macdFastLength, macdSlowLength, macdSignalLength)

// Условия для входа на покупку и продажу
longCondition = ta.crossover(macdLine, signalLine) and close < ma
shortCondition = ta.crossunder(macdLine, signalLine) and close > ma

// === Управление позициями ===
if (longCondition)
    strategy.entry("Buy", strategy.long)
    // Стоп-лосс на основе ATR
    stopLossLevel = close - atr * atrMultiplier
    strategy.exit("Take Profit/Stop Loss", "Buy", stop=stopLossLevel)

if (shortCondition)
    strategy.entry("Sell", strategy.short)
    // Стоп-лосс на основе ATR
    stopLossLevel = close + atr * atrMultiplier
    strategy.exit("Take Profit/Stop Loss", "Sell", stop=stopLossLevel)

// Визуализация
plot(ma, title="MA", color=color.blue, linewidth=2)
plot(macdLine, title="MACD Line", color=color.green)
plot(signalLine, title="Signal Line", color=color.red)
hline(0, "Zero Line", color=color.gray)