अवलोकन
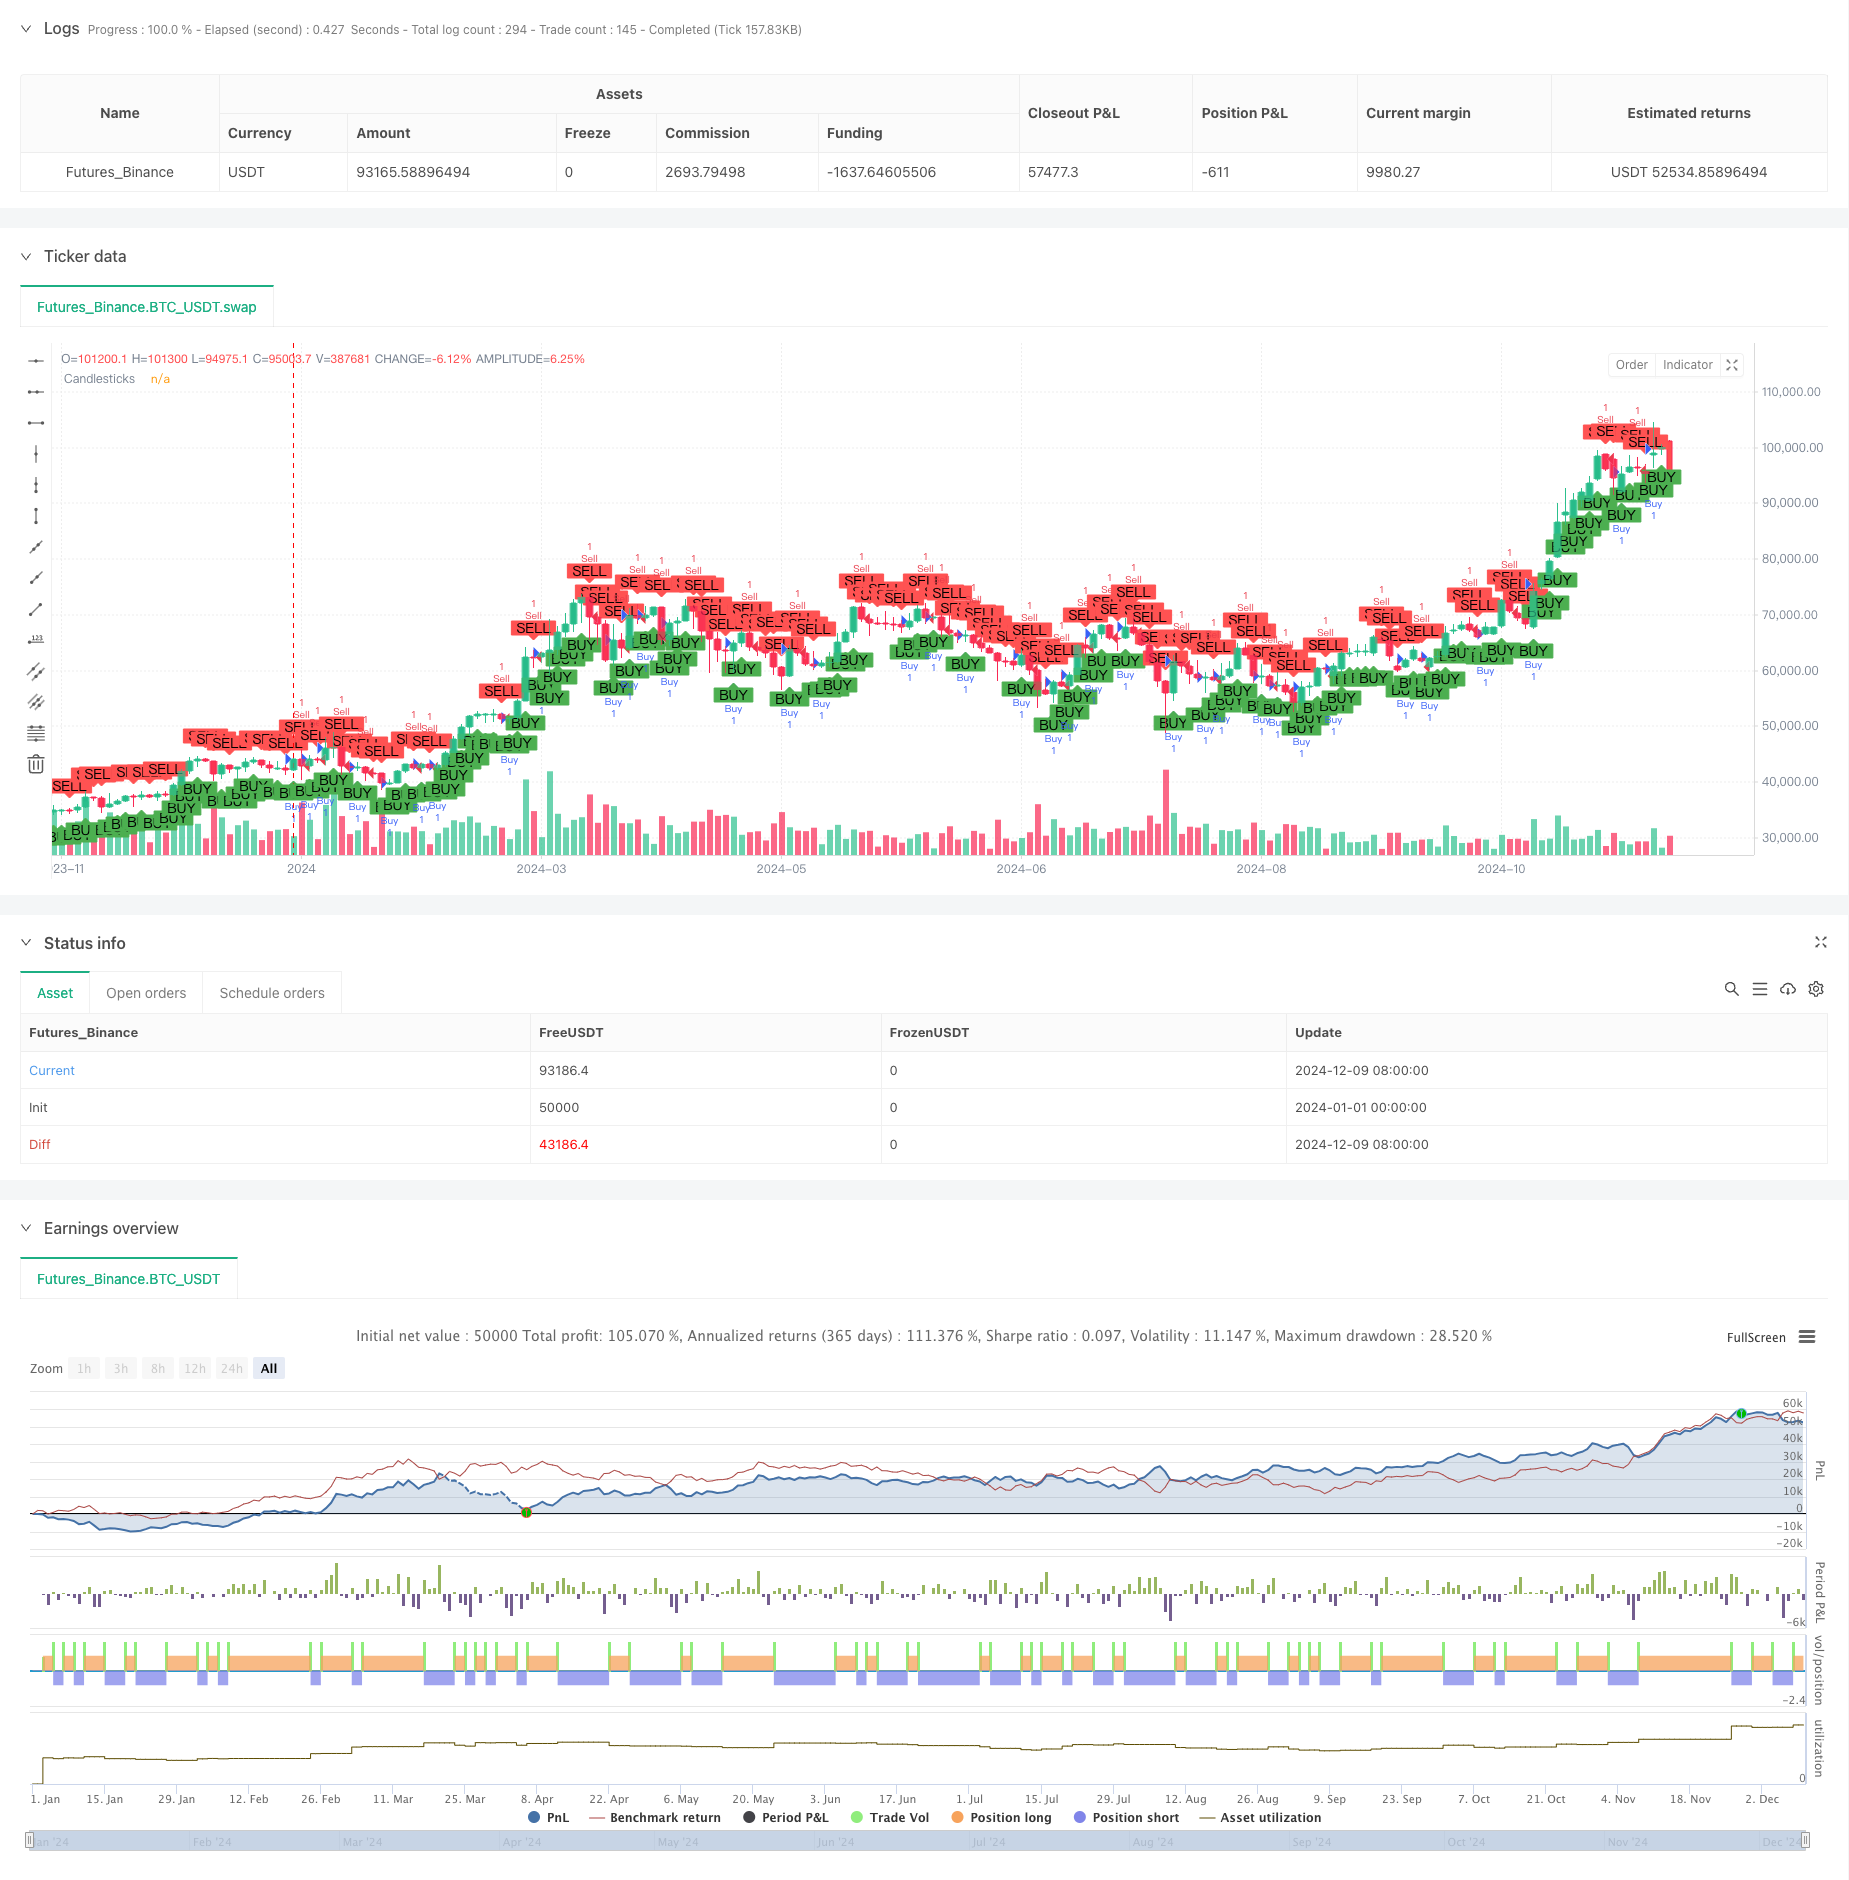
यह एक रणनीति है जो 1 मिनट के लिए K लाइन के समापन की दिशा में उच्च आवृत्ति वाले व्यापार पर आधारित है। रणनीति K लाइन के समापन मूल्य और उद्घाटन मूल्य के संबंध का आकलन करके बाजार की चाल को निर्धारित करती है, और पूर्वावलोकन K लाइन के गठन के बाद अधिक करती है, और पूर्वावलोकन K लाइन के गठन के बाद शून्य होती है। रणनीति एक निश्चित स्थिति रखने का समय, अगले K लाइन के समापन पर स्थिति को साफ़ करती है, और प्रति दिन अधिकतम व्यापार की संख्या को सीमित करती है, जोखिम को नियंत्रित करने के लिए।
रणनीति सिद्धांत
इस रणनीति का मुख्य तर्क यह है कि बाजार में अल्पकालिक रुझानों को K-रेखा के माध्यम से बंद करने की दिशा के आधार पर निर्धारित किया जाता हैः
- जब समापन मूल्य समापन मूल्य से अधिक होता है, तो एक सूर्य रेखा बनती है, जो दर्शाती है कि वर्तमान चक्र में खरीदार की ताकत अधिक है, और रणनीति का विकल्प अधिक है।
- जब समापन मूल्य समापन मूल्य से कम होता है, तो एक छाया रेखा बनती है, यह दर्शाता है कि वर्तमान चक्र में विक्रेता की ताकत का प्रभुत्व है, रणनीति का चयन करें।
- रणनीतियाँ जो एक त्वरित लाभ या हानि को प्राप्त करने के लिए स्थिति खोलने के बाद अगले K लाइन को बंद करते हैं।
- एक दिन में 200 लेनदेन तक सीमित करें ताकि ओवर-ट्रेडिंग को रोका जा सके
- जोखिम नियंत्रण के लिए प्रत्येक लेनदेन के लिए खाते में 1% धनराशि का उपयोग करें।
रणनीतिक लाभ
- लेनदेन का तर्क सरल, स्पष्ट, समझने और लागू करने में आसान है
- बाजार में उतार-चढ़ाव के जोखिम को कम करने के लिए कम समय के लिए होल्डिंग
- एक निश्चित अवधि के लिए स्थिति रखने से व्यक्तिपरक निर्णयों के विचलन से बचा जाता है
- प्रति दिन अधिकतम ट्रेडों की सीमा निर्धारित की गई है ताकि जोखिम को नियंत्रित किया जा सके
- प्रतिशत जोखिम प्रबंधन का उपयोग करें और अपने खाते के धन को सुरक्षित रखें
- ट्रेडिंग सिग्नल को दृश्य रूप से प्रदर्शित करके रणनीति की निगरानी और अनुकूलन में मदद करें
रणनीतिक जोखिम
- उच्च आवृत्ति वाले लेनदेन से लेनदेन की अधिक लागत हो सकती है समाधानः कम विचलन वाले ट्रेडों को चुनें और ट्रेडों के समय को अनुकूलित करें
- अत्यधिक अस्थिर बाजारों में संभावित लगातार नुकसान समाधानः बाजार में उतार-चढ़ाव को फ़िल्टर करने के लिए शर्तें बढ़ाएं
- रणनीतियाँ झूठी घुसपैठ से प्रभावित हो सकती हैं समाधानः अतिरिक्त संकेतकों की पुष्टि करें, जैसे कि लेनदेन में वृद्धि
- फिक्स्ड होल्डिंग के दौरान अधिक मुनाफे के अवसरों से वंचित रह सकते हैं समाधानः बाजार की गतिशीलता के आधार पर स्थिति रखने के समय को समायोजित करें
- अधिक बाजार जानकारी और तकनीकी संकेतकों पर विचार नहीं किया गया समाधानः अन्य तकनीकी मापदंडों के साथ अनुकूलित प्रवेश शर्तें
रणनीति अनुकूलन दिशा
- लेन-देन की मात्रा के संकेतकों को पेश करनाः लेन-देन की मात्रा के माध्यम से के-लाइन की प्रभावशीलता की पुष्टि करना, लेन-देन संकेतों की विश्वसनीयता में सुधार करना
- प्रवृत्ति फ़िल्टर जोड़ेंः प्रवृत्ति संकेतकों जैसे कि औसत रेखा के साथ, मुख्य प्रवृत्ति की दिशा में व्यापार करें
- गतिशील होल्डिंग समयः बाजार में उतार-चढ़ाव के आधार पर गतिशील रूप से होल्डिंग समय को समायोजित करना, रणनीति की अनुकूलनशीलता में सुधार करना
- पूंजी प्रबंधन का अनुकूलन करेंः ऐतिहासिक लाभ-हानि के आधार पर गतिशील रूप से स्थिति आकार को समायोजित करें
- बढ़ी हुई बाजार अस्थिरता फ़िल्टरिंगः अत्यधिक या बहुत कम अस्थिरता वाले बाजार की स्थिति में व्यापार को निलंबित करना
- समय फ़िल्टर जोड़ेंः उच्च अस्थिरता वाले बाजार के खुलने और बंद होने के समय से बचें
संक्षेप
यह रणनीति एक K-लाइन समापन दिशा पर आधारित उच्च आवृत्ति ट्रेडिंग प्रणाली है, जो सरल मूल्य व्यवहार विश्लेषण के माध्यम से अल्पकालिक बाजार के अवसरों को पकड़ती है। रणनीति के फायदे तर्क की सरलता, कम होल्डिंग समय और नियंत्रित जोखिम हैं, लेकिन उच्च व्यापारिक लागत, झूठी तोड़फोड़ और अन्य चुनौतियों का सामना करना पड़ता है। अधिक तकनीकी संकेतकों और अनुकूलन कार्यक्रमों को पेश करके रणनीति की स्थिरता और लाभप्रदता को और बढ़ाने की उम्मीद है। यह एक ट्रेडिंग रणनीति है जो अल्पकालिक व्यापारिक अवसरों की तलाश करने वाले निवेशकों के लिए प्रयास और सुधार के लायक है।
/*backtest
start: 2024-01-01 00:00:00
end: 2024-12-10 08:00:00
period: 2d
basePeriod: 2d
exchanges: [{"eid":"Futures_Binance","currency":"BTC_USDT"}]
*/

//@version=5
strategy("Candle Close Strategy", overlay=true)

// Define conditions for bullish and bearish candlesticks
isBullish = close > open
isBearish = close < open

// Track the number of bars since the trade was opened and the number of trades per day
var int barsSinceTrade = na
var int tradesToday = 0

// Define a fixed position size for testing
fixedPositionSize = 1

// Entry condition: buy after the close of a bullish candlestick
if (isBullish and tradesToday < 200)  // Limit to 200 trades per day
    strategy.entry("Buy", strategy.long, qty=fixedPositionSize)
    barsSinceTrade := 0
    tradesToday := tradesToday + 1

// Entry condition: sell after the close of a bearish candlestick
if (isBearish and tradesToday < 200)  // Limit to 200 trades per day
    strategy.entry("Sell", strategy.short, qty=fixedPositionSize)
    barsSinceTrade := 0
    tradesToday := tradesToday + 1

// Update barsSinceTrade if a trade is open
if (strategy.opentrades > 0)
    barsSinceTrade := nz(barsSinceTrade) + 1

// Reset tradesToday at the start of a new day
if (dayofmonth != dayofmonth[1])
    tradesToday := 0

// Exit condition: close the trade after the next candlestick closes
if (barsSinceTrade == 2)
    strategy.close("Buy")
    strategy.close("Sell")

// Plot bullish and bearish conditions
plotshape(series=isBullish, location=location.belowbar, color=color.green, style=shape.labelup, text="BUY")
plotshape(series=isBearish, location=location.abovebar, color=color.red, style=shape.labeldown, text="SELL")

// Plot the candlesticks
plotcandle(open, high, low, close, title="Candlesticks")