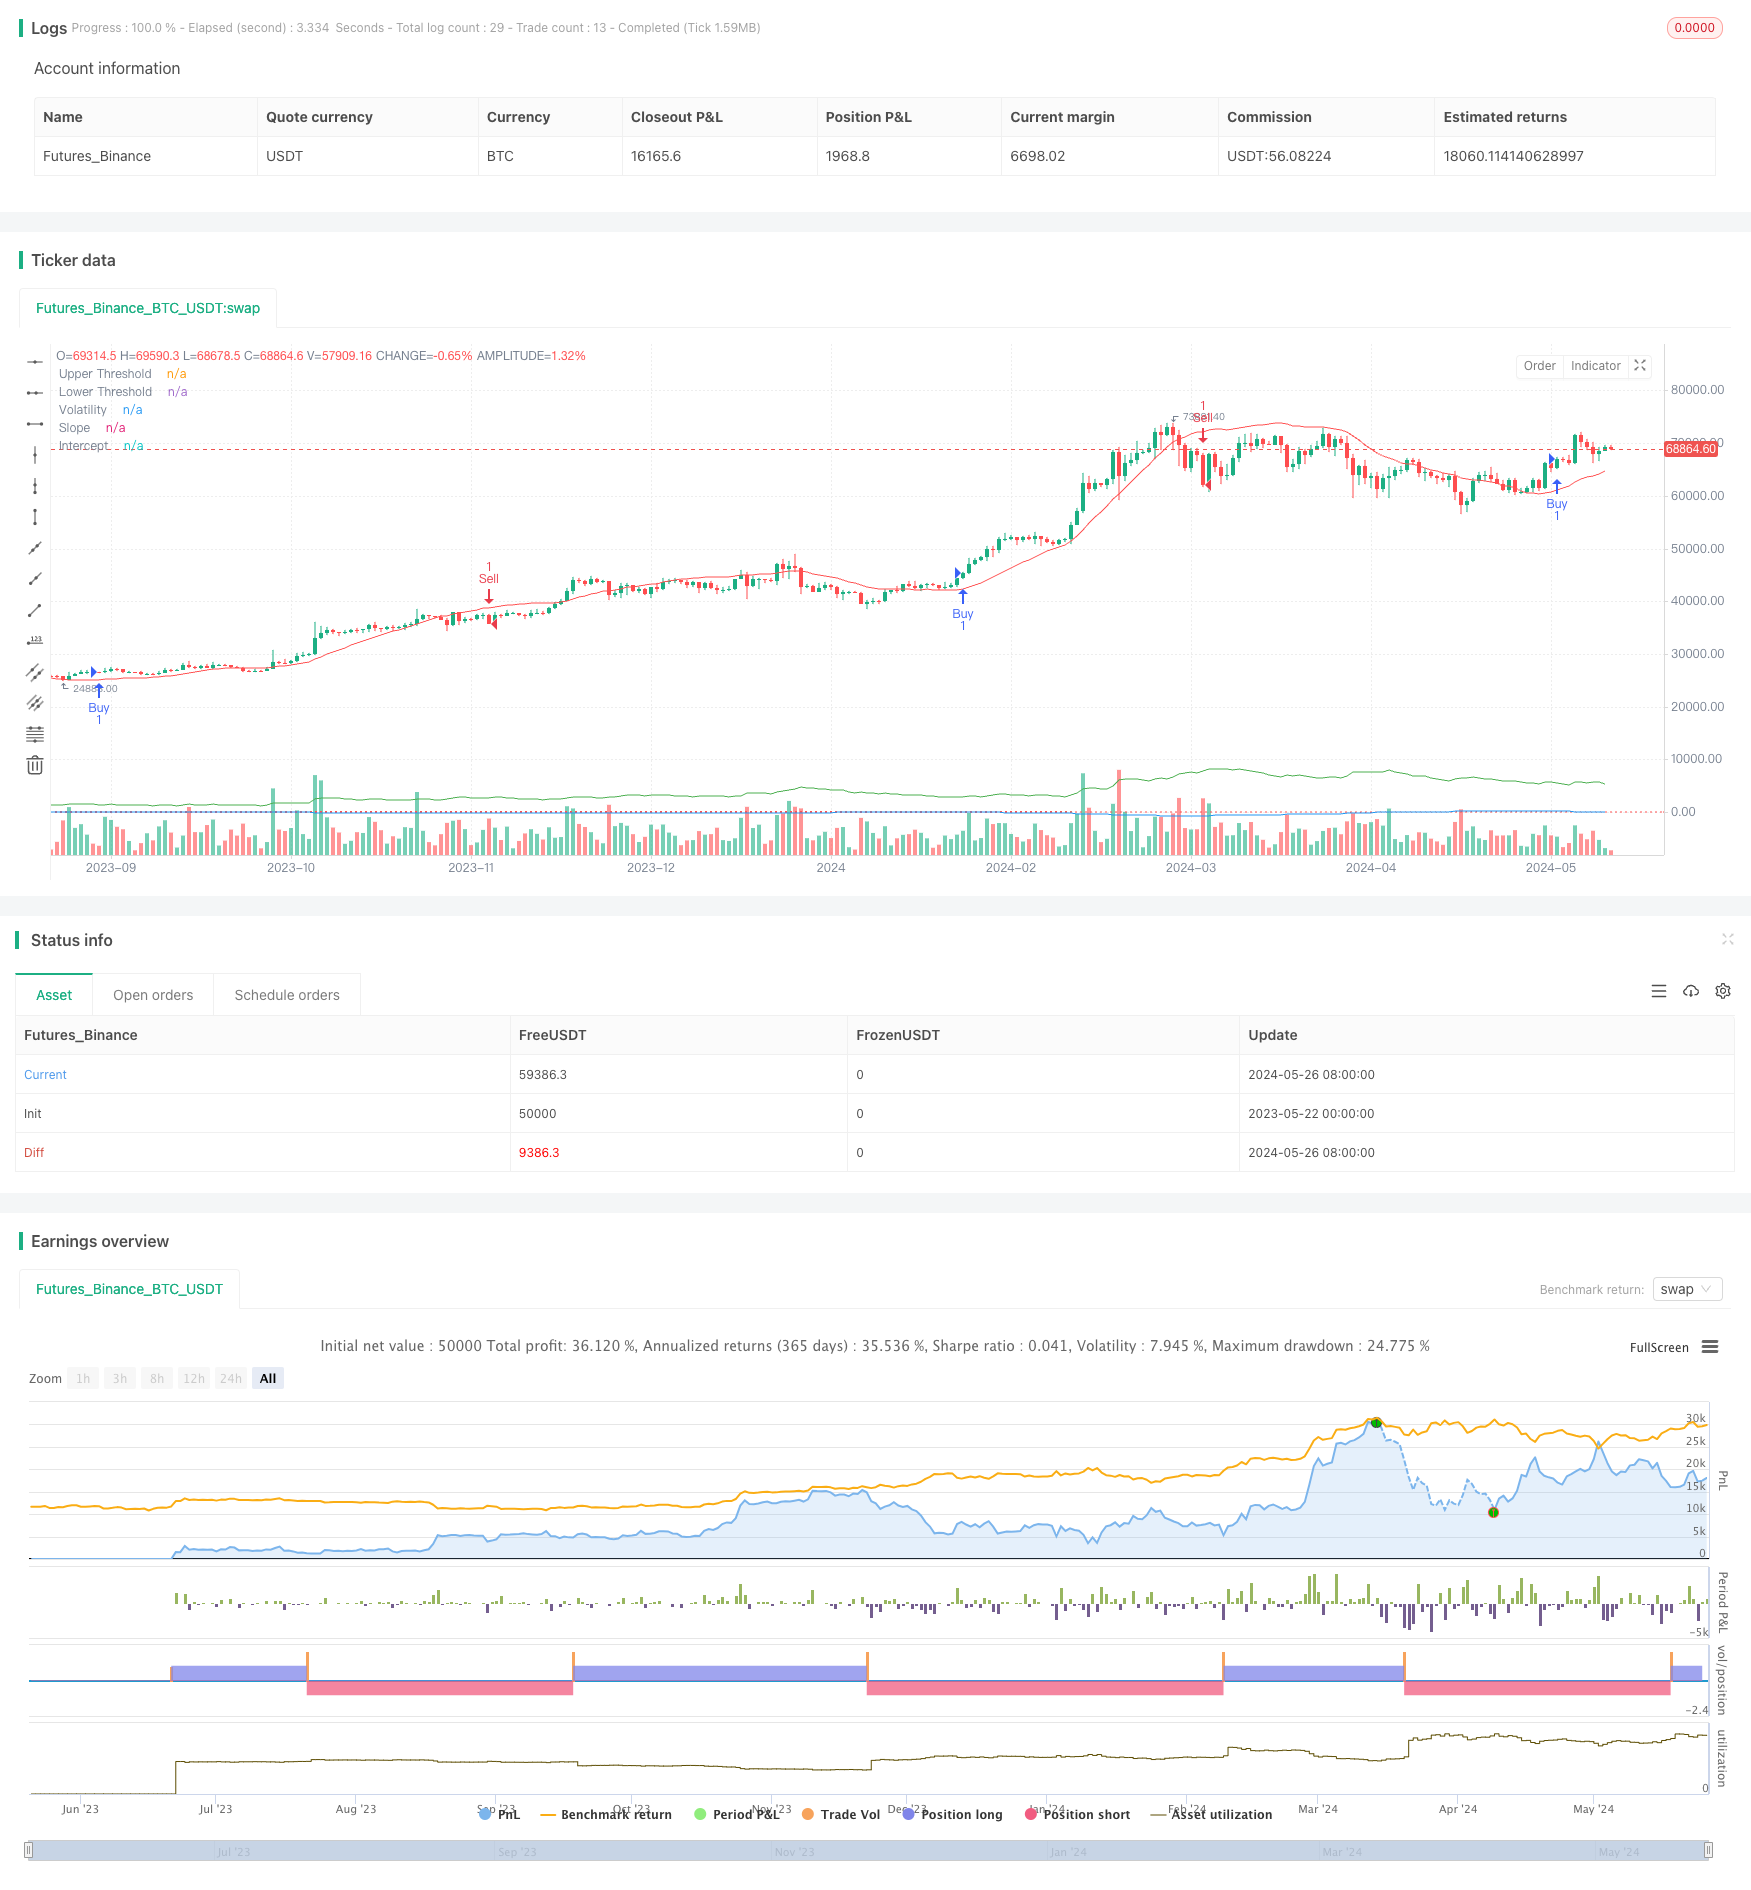
波動性と線形回帰に基づく長期短期市場体制最適化戦略
作者: リン・ハーンチャオチャン開催日:2024年5月28日17時40分37秒タグ:ATRエイマ

概要
この戦略は,異なる市場状態を特定するために線形回帰および変動指標を使用する. 購入または販売の条件が満たされると,戦略は対応するロングまたはショートポジションを確立する. さらに,この戦略は,さまざまな市場環境に適応するために市場条件に基づいてパラメータの最適化および調整を可能にします. 戦略は,指数移動平均 (EMA) を追加の指標として利用し,取引信号を確認します.
戦略の原則
- 線形回帰の交差点と傾きを計算して市場動向を決定する.
- 変動指数として,平均真差 (ATR) を倍数で計算する.
- 傾きが上限よりも高く,価格がレグレッションラインプラス波動度よりも高くなったとき,買い信号を生成する.
- 傾きが下値を下回り,価格がレグレッション線マイナス波動率を下回ったときに売り信号を生成する.
- 加算指標として,高速EMAと遅いEMAを使用する.
- 買い信号が発生し,速いEMAがスローEMAより上にある場合,ロングポジションを設定します.
- 売り信号が発生し,速いEMAがスローEMAを下回るとショートポジションを設定する.
戦略 の 利点
- 線形回帰指標と変動指標を組み合わせることで 戦略は市場状態と動向をより正確に特定することができます.
- 取引シグナルを確認するためのEMA指標の追加の使用は,戦略の信頼性を高めます.
- 鍵となるパラメータの最適化により,異なる市場環境と機器特性に適応できます.
- 動向と変動の両方を考慮すると,動向が明確であるときに迅速にポジションを確立し,変動が増加するときにリスクを制御することができます.
戦略リスク
- パラメータの不適切な選択は,戦略の不良の結果をもたらし,特定のツールと市場の特徴に基づいて最適化する必要があります.
- 不安定な市場やトレンドターニングポイントでは 戦略は頻繁に取引や誤った信号を経験する可能性があります
- 戦略は過去のデータに基づいているため,突然の出来事や異常な市場変動に迅速に対応しない可能性があります.
戦略の最適化方向
- 他の技術指標や基本的な要素を組み込み,意思決定の基盤を豊かにし,信号の正確性を向上させる.
- リグレッション長さ,波動性倍数,EMA期間など,異なるツールと市場の特徴に適応するためにパラメータ選択を最適化する.
- ストップ・ロストとテイク・プロフィートのメカニズムを導入し,個々の貿易リスクと総引き上げレベルを制御する.
- ポジションのサイズとマネジメントの規則を組み込むことを検討し,市場の変動と口座資本に基づいてポジションのサイズを調整する.
概要
この戦略は,EMAを確認指標として使用し,線形回帰および変動指標を使用して市場状態を特定し,適応性と論理的に明確な取引戦略を構築する.この戦略の利点は,トレンドと変動性を組み合わせ,パラメータ最適化が可能であるため,さまざまな市場環境に適している.しかし,この戦略はパラメータ選択,不安定な市場,ブラックスワンイベントなどのリスクに直面し,実用的なアプリケーションで継続的な最適化と改善を必要とする.将来の強化は,信号源を豊かにし,パラメータ選択を最適化し,戦略の安定性と収益性を向上させるためにリスク管理措置を精製することに焦点を当てることができる.
/*backtest
start: 2023-05-22 00:00:00
end: 2024-05-27 00:00:00
period: 1d
basePeriod: 1h
exchanges: [{"eid":"Futures_Binance","currency":"BTC_USDT"}]
*/

// This Pine Script™ code is subject to the terms of the Mozilla Public License 2.0 at https://mozilla.org/MPL/2.0/
// © tmalvao

//@version=5
strategy("Regime de Mercado com Regressão e Volatilidade Otimizado", overlay=true)

// Parâmetros para otimização
upperThreshold = input.float(1.0, title="Upper Threshold")
lowerThreshold = input.float(-1.0, title="Lower Threshold")
length = input.int(50, title="Length", minval=1)

// Indicadores de volatilidade
atrLength = input.int(14, title="ATR Length")
atrMult = input.float(2.0, title="ATR Multiplier")
atr = ta.atr(atrLength)
volatility = atr * atrMult

// Calculando a regressão linear usando função incorporada
intercept = ta.linreg(close, length, 0)
slope = ta.linreg(close, length, 1) - ta.linreg(close, length, 0)

// Sinal de compra e venda
buySignal = slope > upperThreshold and close > intercept + volatility
sellSignal = slope < lowerThreshold and close < intercept - volatility

// Entrando e saindo das posições
if (buySignal)
    strategy.entry("Buy", strategy.long)
if (sellSignal)
    strategy.entry("Sell", strategy.short)

// Indicadores adicionais para confirmação
emaFastLength = input.int(10, title="EMA Fast Length")
emaSlowLength = input.int(50, title="EMA Slow Length")
emaFast = ta.ema(close, emaFastLength)
emaSlow = ta.ema(close, emaSlowLength)

// Confirmando sinais com EMAs
if (buySignal and emaFast > emaSlow)
    strategy.entry("Buy Confirmed", strategy.long)
if (sellSignal and emaFast < emaSlow)
    strategy.entry("Sell Confirmed", strategy.short)

// Exibindo informações no gráfico
plot(slope, title="Slope", color=color.blue)
plot(intercept, title="Intercept", color=color.red)
plot(volatility, title="Volatility", color=color.green)
hline(upperThreshold, "Upper Threshold", color=color.green, linestyle=hline.style_dotted)
hline(lowerThreshold, "Lower Threshold", color=color.red, linestyle=hline.style_dotted)
関連性
- 強化された多指標モメンタム取引戦略
- ATRベースの取利益とストップ損失を伴う戦略をフォローする多期間の傾向
- K 連続キャンドル ブール・ベア戦略
- ケルトナー・チャネルズ EMA ATR戦略
- スーパートレンドとEMAの組み合わせ戦略
- 動的チャネルと移動平均取引システムによる多指標トレンドフォロー戦略
- ATR と EMA をベースとした動的取利益とストップ損失適応戦略
- 取引戦略をフォローする EMA ダイナミック・トレンド
- トリプルEMAクロスオーバー戦略
- 量に基づくATR動的ストップ損失最適化による多指数移動平均のクロスオーバー戦略
もっと
- MA MACD BB マルチインジケーター取引戦略 バックテストツール
- RSI+スーパートレンド トレンドフォローする取引戦略
- イチモク・クモ・トレード戦略
- ダイナミックATRストップ・ロスト&テイク・プロフィート 移動平均クロスオーバー戦略
- EMA トレンド・モメンタム・キャンドルスティック・パターンの戦略
- Gチャンネルトレンド検出戦略
- トレーリングストップ損失戦略の移動平均クロスオーバー
- ダイナミック・テイク・プロフィートとストップ・ロスのEMAクロスオーバー・トレーディング戦略
- ボリンジャー・バンドとEMA トレンドフォロー戦略
- WaveTrend オシレーター ダイバージェンス 戦略
- ハイブリッド・バイノミアルZスコア量的な戦略
- RSIとMAの組み合わせ戦略
- EMAのモメンタム・トレード戦略
- FVGのモメンタム・スカルピング戦略
- ATR と EMA をベースとした動的取利益とストップ損失適応戦略
- ブレイクと周波数フィルター (長みのみ) でトレンドフォロー
- フィボナッチ ゴールデンハーモニー ブレイクアウト戦略
- 線形回帰傾斜に基づく動的市場体制の特定戦略
- RSI ダイバージェンスをベースにしたトレンド逆転取引戦略
- 2つの移動平均RSIモメントストラテジー EMAとトレンドラインブレイクに基づいて